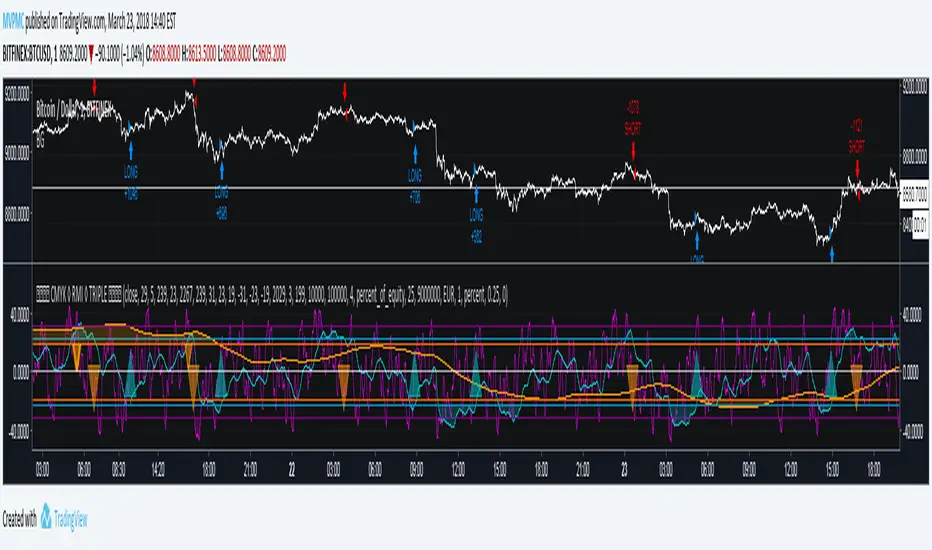
CMYK RMI TRIPLE◊ Introduction
This script makes use of three RMI's, to indicate Overbought/Oversold.
Adjustments can easily be made, through its settings or script.
◊ Origin
The Relative Momentum Index was developed by Roger Altman and was introduced in his article in the February, 1993 issue of Technical Analysis of Stocks & Commodities magazine.
While RSI counts up and down days from close to close, the Relative Momentum Index counts up and down days from the close relative to a close x number of days ago.
This results in an RSI that is smoother.
This is a part of Project XIAM.
◊ Theoretical Approach
Philosophy γ :: consequential
◊ Usage
You can use this as an indicator for manual trading, or apply AUTOTVIEW to automate your trading.
My advice is to combine this with another indicator before you do this.
The script is written in an organized and flexible manner to do this.
◊ Features
3 RMI's with seperately adjustable HIGH / LOW levels.
Trend adjustment on the SLOW RMI.
Adjustable Interval between entries / Once per dip-top entry.
Take Profit & Stop loss
◊ Community
Wanna share your findings ? or need help resolving a problem ?
CMYK :: discord.gg
AUTOVIEW :: discordapp.com
TRADINGVIEW UNOFFICIAL :: discord.gg
Relative Strength Index (RSI)
My BTC/USDT 45min Ichimoku Strat v2Improved last version by adding a RSI derivative condition, which is very effective for spotting sheep herd moves, and follow them asap.

Noro's FRSI Strategy v1.21Little changed Noro's Fast RSI Strategy v1.2 for using with
Noro's FRSI Indicator v1.21 for AutoView

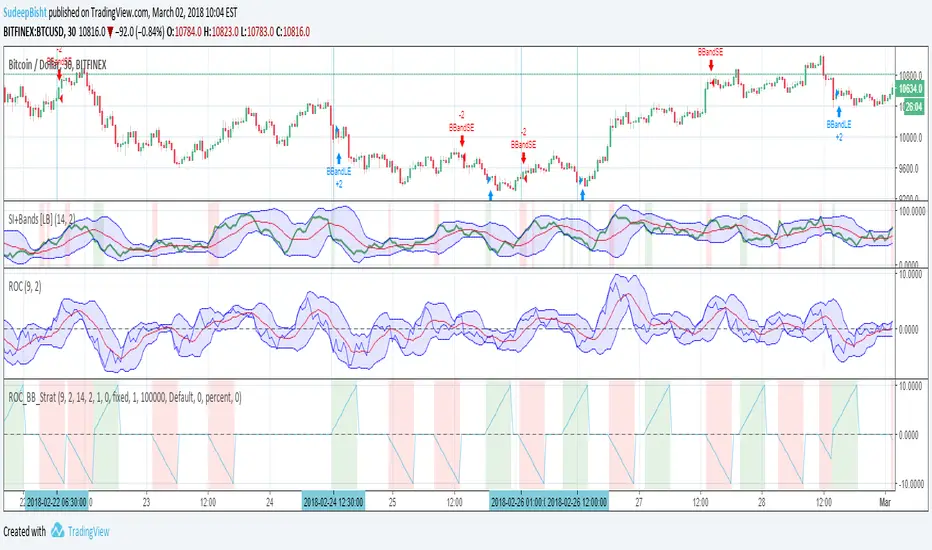
Sb_Rate_Of_Change_BB_Band_strategy Version 1.0The strategy couples the concept of rate of change along with the Bollinger bands.
Along with it LazyBear's RSI/MFI with Volatility Indicator is also taken to reduce the number of trades and improve efficiency.
Strategy (in Layman terms):
If in the past 10 candles RSI/MFI with Volatility Indicator has printed a red/green colour and the roc has gone above/below the Bollinger bands then the short/long order is placed respectively.
Message if you think of any modifications/ enhancements/ any opportunities. :)
Donations/Tips... :) -
BTC: 1BjswGcRR6c23pka7qh5t5k56j46cuyyy2
ETH: 0x64fed71c9d6c931639c7ba4671aeb6b05e6b3781
LTC: LKT2ykQ8QSzzfTDB6Tnsf12xwYPjgq95h4
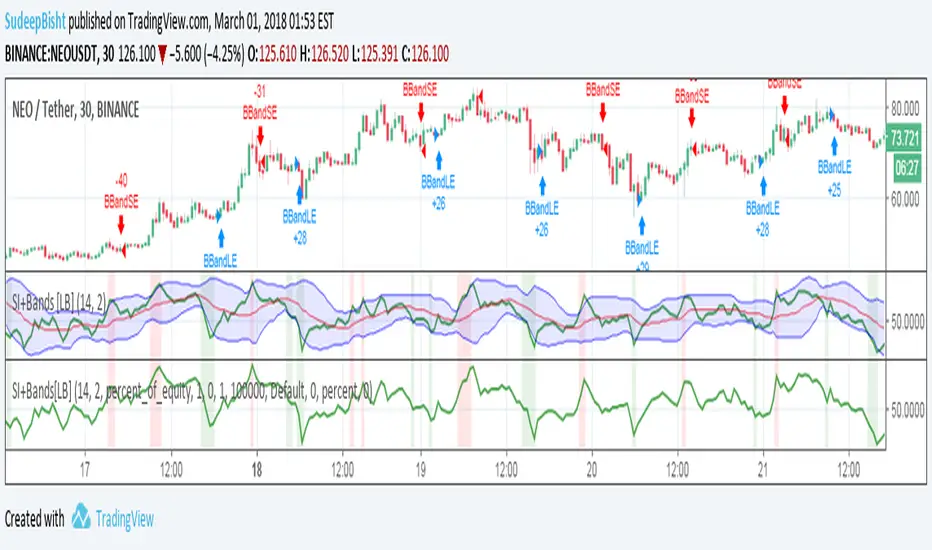
SB_RSI/MFI with Volatility Version 1.0Take on LazyBear's SB_RSI/MFI with Volatility Indicator.
The original indicator is coupled with the Bollinger Band strategy.
Original Idea:
Wanted to test the indicator with bbstrategy.
Message if you think of any modifications/ enhancements/ any opportunities. :)
Donations/Tips... :) -
BTC: 1BjswGcRR6c23pka7qh5t5k56j46cuyyy2
ETH: 0x64fed71c9d6c931639c7ba4671aeb6b05e6b3781
LTC: LKT2ykQ8QSzzfTDB6Tnsf12xwYPjgq95h4
SB_Compliment_RSI StrategyThe strategy modifies the original rsi strategy with the addition of compliment si (i.e. 100-rsi).
Strategy Idea: Previous rsi high and low value is recorded when the rsi crosses overBought(70) and OverSold(30) values.
Now when the rsi crosses above the overSold range, the rsi is matched with the compliment of previous high rsi value. If the compliment i.e.(100-prev_rsi_high) is less than or equal to rsi then long position is taken.
For short position, when the rsi crosses below the overBought range, the rsi is matched with the compliment of previous low rsi value. If compliment i.e.(100-prev_rsi_low) is greater than or equal to rsi.
Below s the code for the indicator present in the chart.
//@version=3
study(title="SB_Compliment_Relative Strength Index", shorttitle="RSI")
src = close, len = input(14, minval=1, title="Length")
up = rma(max(change(src), 0), len)
down = rma(-min(change(src), 0), len)
rsi = down == 0 ? 100 : up == 0 ? 0 : 100 - (100 / (1 + up / down))
plot(rsi, color=purple)
plot(100-rsi, color=orange)
band1 = hline(70)
band0 = hline(30)
fill(band1, band0, color=purple, transp=90)
The code also has switch code also which means it will enter the overBrought or overSold block one after the other.
Future modifications: Currently the value of rsi tracked is the one in which it crosses the overSold or OverBought range and not the highest/lowest value when the value is above/below OverBought/OverSold range.
Comment the perfect combination of indicators for it and will try to incorporate those indicators into it in the next version.
Message if you think of any modifications/ enhancements/ any opportunities. :)
Donations/Tips... :) -
BTC: 1BjswGcRR6c23pka7qh5t5k56j46cuyyy2
ETH: 0x64fed71c9d6c931639c7ba4671aeb6b05e6b3781
LTC: LKT2ykQ8QSzzfTDB6Tnsf12xwYPjgq95h4

SB_CM_RSI_2_Strategy_Version 2.0(New: Profit booking present which is not present in the previous indicator)
The strategy is based on the indicator posted by @ChrisMoody "CM RSI-2 Strategy Lower Indicator" which is based on "Larry Connors RSI-2 Strategy - Lower RSI"
In this strategy, the longs are placed when a green color is encountered in the rsi in the previous candle and short when the red color is encountered in the rsi.
Although the profits are booked when the rsi crossover the 10 level mark or crossunder the 90 level mark.
Just message in the script if you have any different idea regarding this indicator.
For the original indicator you can refer to :
For Tips to continue :) -
BTC: 1BjswGcRR6c23pka7qh5t5k56j46cuyyy2
ETH: 0x64fed71c9d6c931639c7ba4671aeb6b05e6b3781
LTC: LKT2ykQ8QSzzfTDB6Tnsf12xwYPjgq95h4

SB_CM_RSI_2_Strategy_Version 1.0The strategy is based on the indicator posted by @ChrisMoody "CM RSI-2 Strategy Lower Indicator" which is based on "Larry Connors RSI-2 Strategy - Lower RSI"
In this strategy the longs are placed when a green color is encountered in the rsi and short when red color is encountered in the rsi.
Although the profits can be booked at different interval.
Just message in the script if you have any different idea regarding this indicator.
For the original indicator you can refer to :
For Tips to continue :) :
BTC: 1BjswGcRR6c23pka7qh5t5k56j46cuyyy2
ETH: 0x64fed71c9d6c931639c7ba4671aeb6b05e6b3781
LTC: LKT2ykQ8QSzzfTDB6Tnsf12xwYPjgq95h4

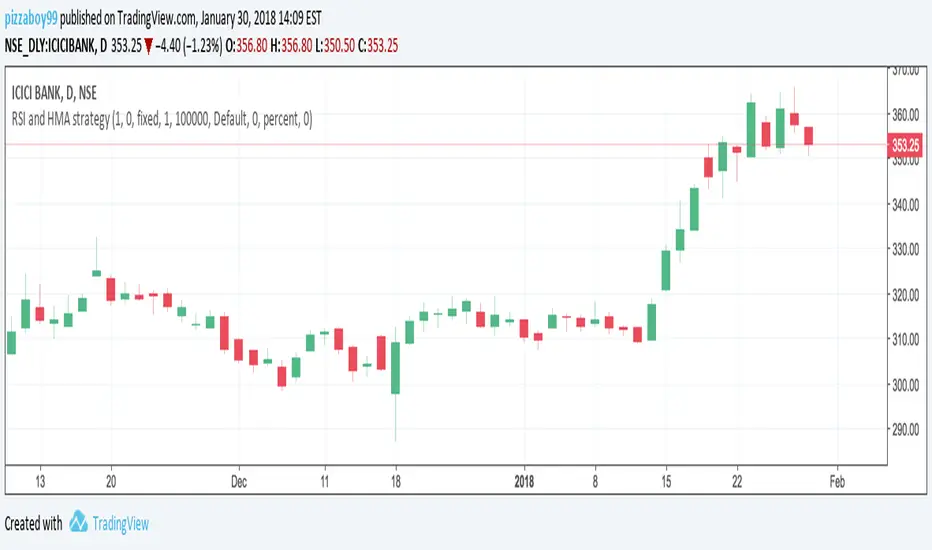
SD_Bull_Bear_Engulfing_Rsi_SdThis strategy combines the idea of a bullish or bearish candle engulfing coupled with standard deviation (a 100% increase or a 50% decrease). The exit condition is placed if the percentage increase is achieved or 35<rsi<65.
The strategy requires refinement so please test the script and let know what can be incorporated to improve the efficiency.

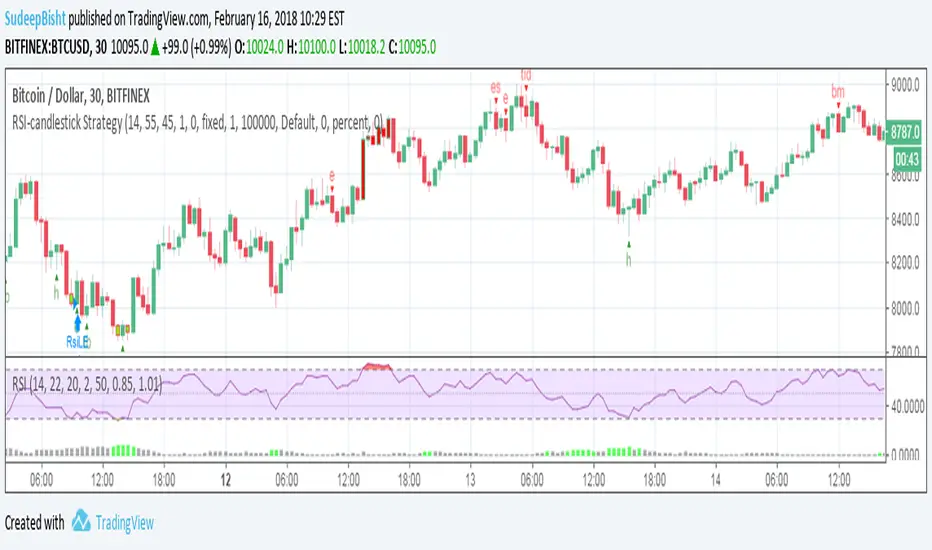
RSI-candlestick StrategyThe script follows a modified rsi strategy and orders are placed if a candlestick pattern is identified in the current or previous candle.
(For optimized results you can add or remove the strategy entry and exits based on the chart you wish to apply the script to).

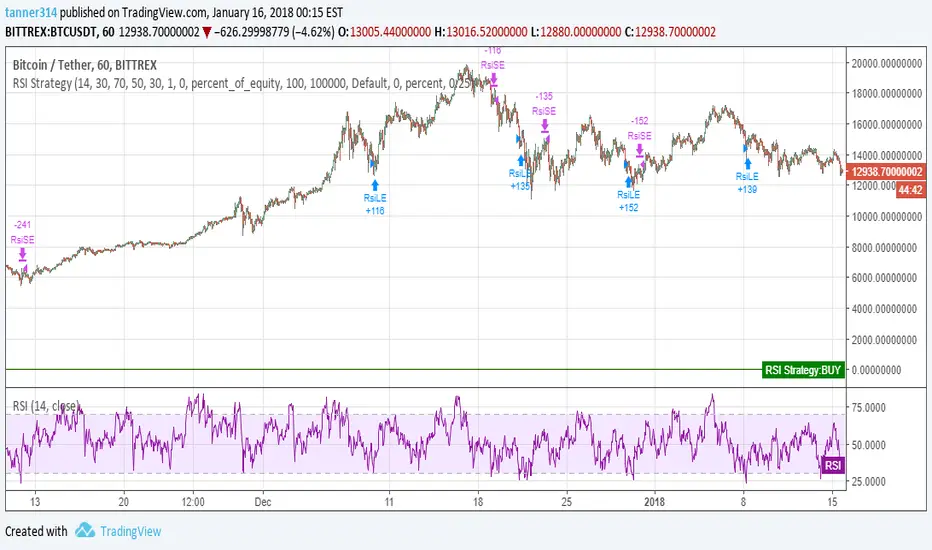
RSI Strategy - TannerHello everyone, this is my first script on TV. I have done some research on cryptocurrency strategies and much of which has been in technical indicators by combining trend and momentum analysis together. Pine Script is quite a difficult language to learn as opposed to Python.
Anyways, I made some adjustments for the RSI strategy to include a stop loss/take profit and added indicators upon the first initial overbought and oversold levels(70 and 30 respectively). Please DO give me advice or recommendations. Primarily, I am confused as to what metric the stop loss and take profit parameters are using as they do not change when the values are changed in the input. I am unable to tell whether the strategy repaints. Could someone explain why repainting typically occurs in crossovers?
*DISCLAIMER*
This script is merely to help myself and others learn about the Pine Script language. I would not advise you to use this script for live trading. Thanks!

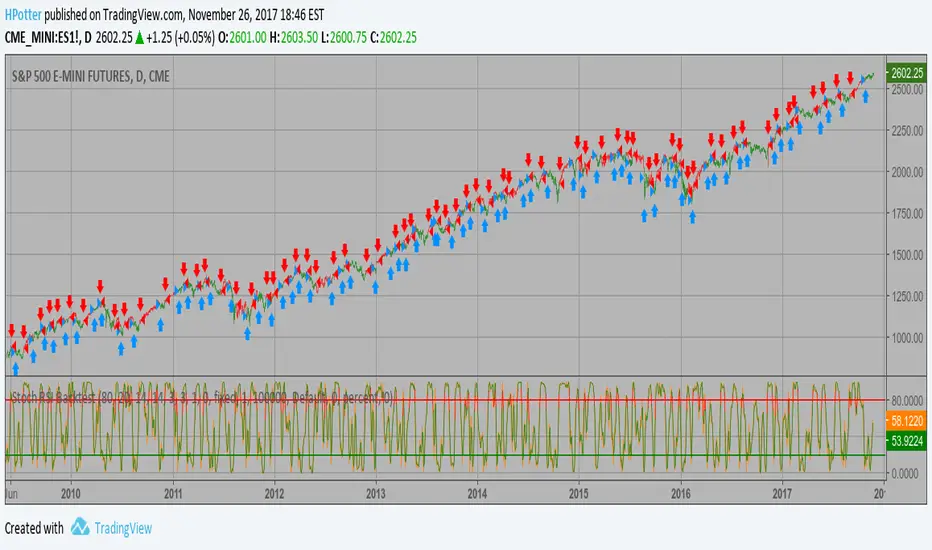
Stochastic RSI Backtest This strategy used to calculate the Stochastic RSI
You can change long to short in the Input Settings
WARNING:
- For purpose educate only
- This script to change bars colors.
Smoothed RSI Backtest ver.2 This is new version of RSI oscillator indicator, developed by John Ehlers.
The main advantage of his way of enhancing the RSI indicator is smoothing
with minimum of lag penalty.
You can change long to short in the Input Settings
WARNING:
- For purpose educate only
- This script to change bars colors.

Smoothed RSI Backtest This is new version of RSI oscillator indicator, developed by John Ehlers.
The main advantage of his way of enhancing the RSI indicator is smoothing
with minimum of lag penalty.
You can change long to short in the Input Settings
WARNING:
- For purpose educate only
- This script to change bars colors.

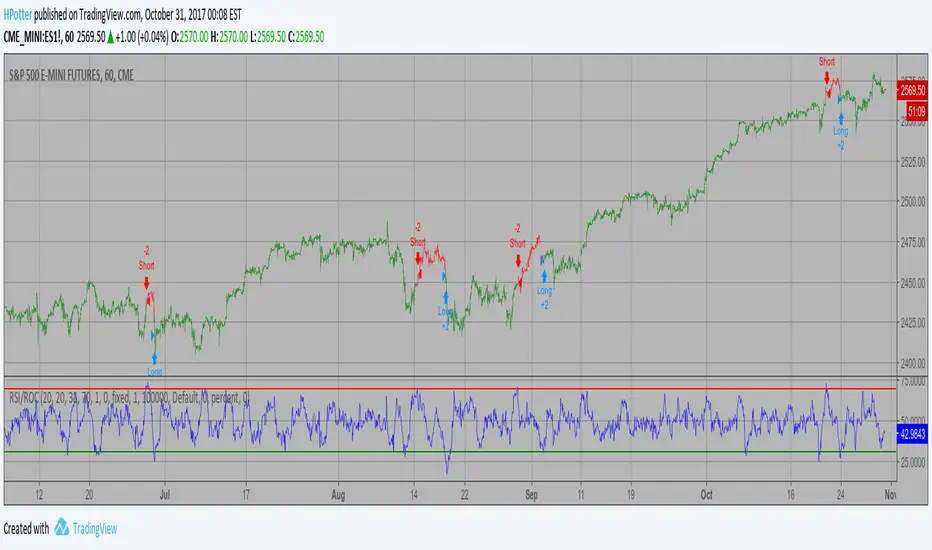
RSI based on ROC Backtest This is the new-age indicator which is version of RSI calculated upon
the Rate-of-change indicator.
The name "Relative Strength Index" is slightly misleading as the RSI
does not compare the relative strength of two securities, but rather
the internal strength of a single security. A more appropriate name
might be "Internal Strength Index." Relative strength charts that compare
two market indices, which are often referred to as Comparative Relative Strength.
And in its turn, the Rate-of-Change ("ROC") indicator displays the difference
between the current price and the price x-time periods ago. The difference can
be displayed in either points or as a percentage. The Momentum indicator displays
the same information, but expresses it as a ratio.
You can change long to short in the Input Settings
WARNING:
- For purpose educate only
- This script to change bars colors.
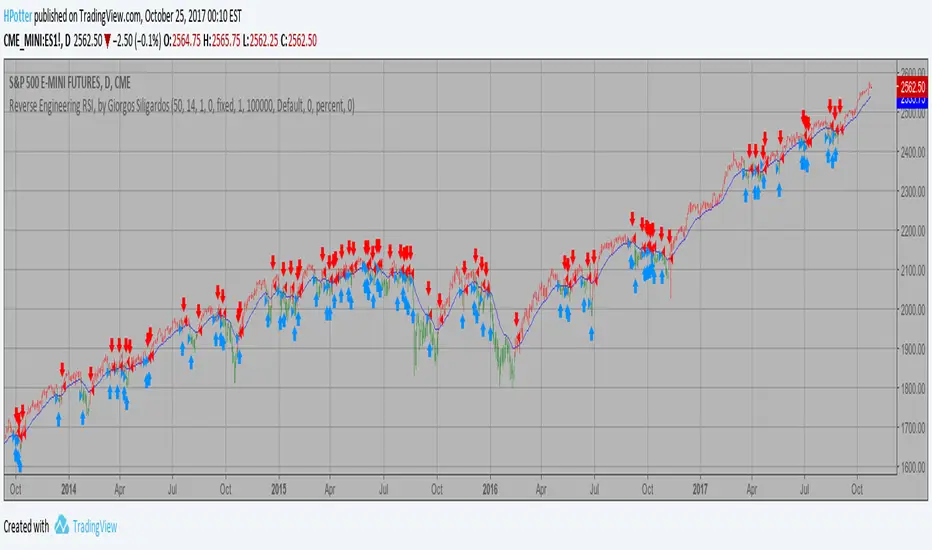
Reverse Engineering RSI, by Giorgos Siligardos Backtest The related article is copyrighted material from
Stocks & Commodities.
You can change long to short in the Input Settings
WARNING:
- For purpose educate only
- This script to change bars colors.
Relative Volatility Index Backtest The RVI is a modified form of the relative strength index (RSI).
The original RSI calculation separates one-day net changes into
positive closes and negative closes, then smoothes the data and
normalizes the ratio on a scale of zero to 100 as the basis for the
formula. The RVI uses the same basic formula but substitutes the
10-day standard deviation of the closing prices for either the up
close or the down close. The goal is to create an indicator that
measures the general direction of volatility. The volatility is
being measured by the 10-days standard deviation of the closing prices.
You can change long to short in the Input Settings
WARNING:
- For purpose educate only
- This script to change bars colors.

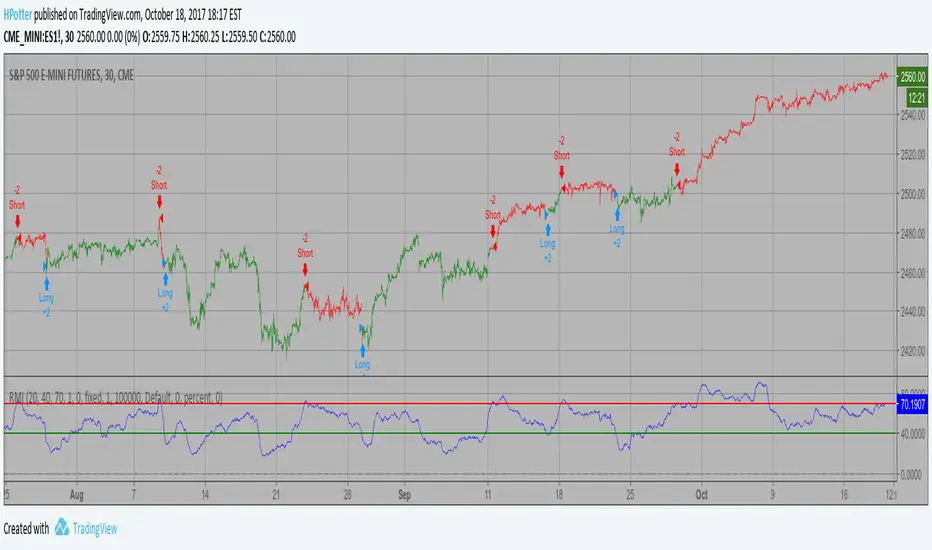
Relative Momentum Index Backtest The Relative Momentum Index (RMI) was developed by Roger Altman. Impressed
with the Relative Strength Index's sensitivity to the number of look-back
periods, yet frustrated with it's inconsistent oscillation between defined
overbought and oversold levels, Mr. Altman added a momentum component to the RSI.
As mentioned, the RMI is a variation of the RSI indicator. Instead of counting
up and down days from close to close as the RSI does, the RMI counts up and down
days from the close relative to the close x-days ago where x is not necessarily
1 as required by the RSI). So as the name of the indicator reflects, "momentum" is
substituted for "strength".
You can change long to short in the Input Settings
WARNING:
- For purpose educate only
- This script to change bars colors.
True Strength Indicator BTCUSD 2HScript based on True Strength Index (TSI) and RSI
A technical momentum indicator that helps traders determine overbought and oversold conditions of a security by incorporating the short-term purchasing momentum of the market with the lagging benefits of moving averages. Generally a 25-day exponential moving average (EMA) is applied to the difference between two share prices, and then a 13-day EMA is applied to the result, making the indicator more sensitive to prevailing market conditions.
!!! IMPORTANT IN ORDER TO AVOID REPAITING ISSUES
!!! USE Chart resolution >= resCustom parameter, suggestion 2H
Yellow zones indicates that you can claim position for better profits even before a claim confirmation.
Dark zones indicates areas where RSI shows overbought and oversold conditions.
BTCUSD
