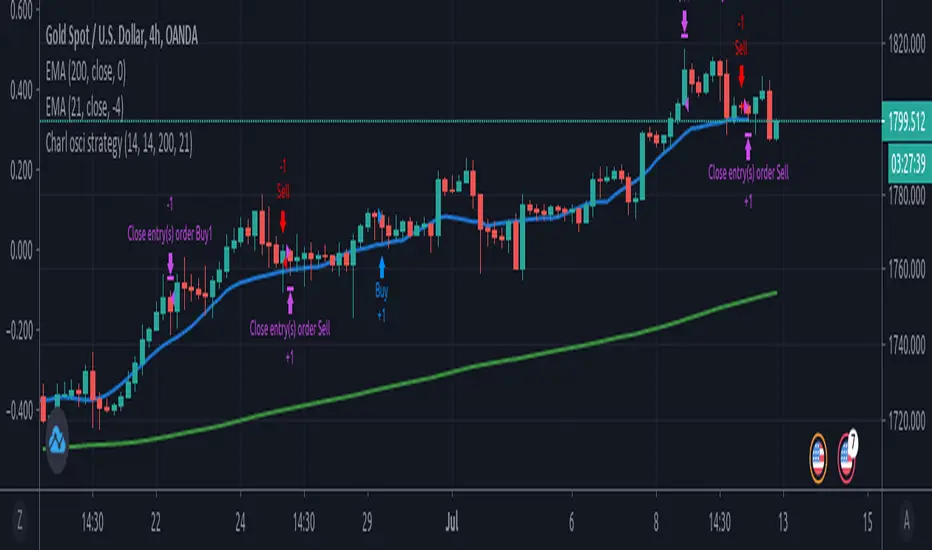
Charl osci strategyTrade trend continuation and reversal on forex, stocks and commodities.
Strategy uses RSI, MFI and macd divergence along with EMA.
Relative Strength Index (RSI)
EMA Crossover StrategyEMA Crossover Strategy
This strategy will enter a long trade when the 21 EMA crosses over the 55 EMA and both EMAs and the close price are above the 200 EMA (long-term trend).
It will enter a short trade when the 21 EMA crosses under the 55 EMA and both EMAs and the close price are below the 200 EMA.
It will exit a long trade when the RSI crosses under from overbought and indicates that the uptrend could be coming to an end.
It will exit a short trade when the RSI crosses over from oversold and indicates that the downtrend could be coming to an end.
Backtesting shows that it works best on:
30 MIN:
SYMBOL - PROFIT FACTOR
AUDCAD - 1.126
EURJPY - 1.12
EURNZD - 1.04
EURUSD - 1.65
GBPAUD - 1.27
USDCAD - 1.08
1 HR:
SYMBOL - PROFIT FACTOR
CADJPY- 1.23
EURNZD- 1.166
GBPJPY- 1.23
GBPUSD- 1.282
NZDJPY- 1.246
USDCHF- 1.344
3 HR:
SYMBOL - PROFIT FACTOR
CADCHF- 1.975
EURGBP- 1.776
EURNZD- 1.911
GBPAUD- 1.364
GBPCHF- 1.311
USDJPY- 1.162
XAUUSD - 2.00
As always, this strategy does not guarantee you to achieve profits and you should always use confirmations before entering a trade.

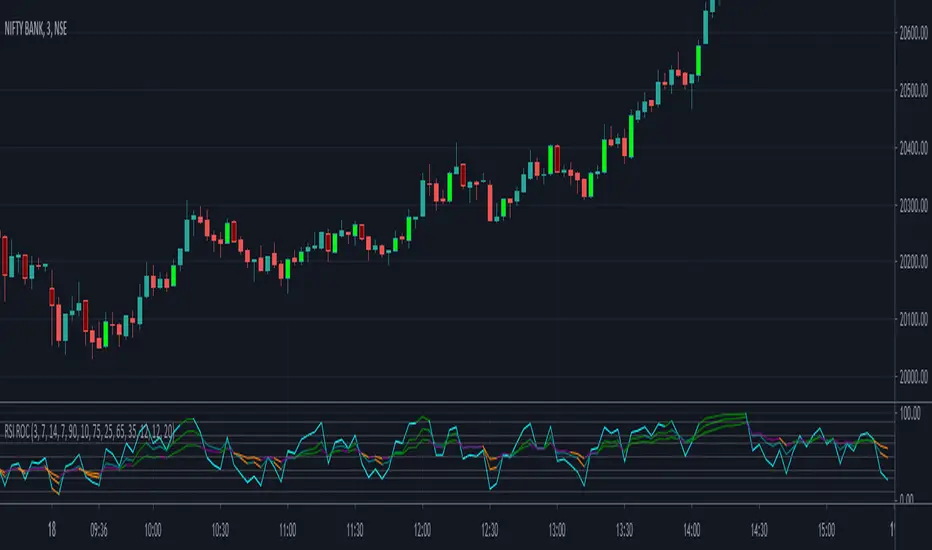
RSI - Rate of ChangeCode based on RSI lower value crossing over higher value
RSI Rate of Change of different lengths used in all parts of code
ADX and CCI use is limited in V1.0
Script provides 3 RSIs and overbrought and oversold for each of these RSIs. When RSI cross over each other clearly Buy and Sell signals are fired.
Lime is buy and Maroon means sell. Use it along with EMA
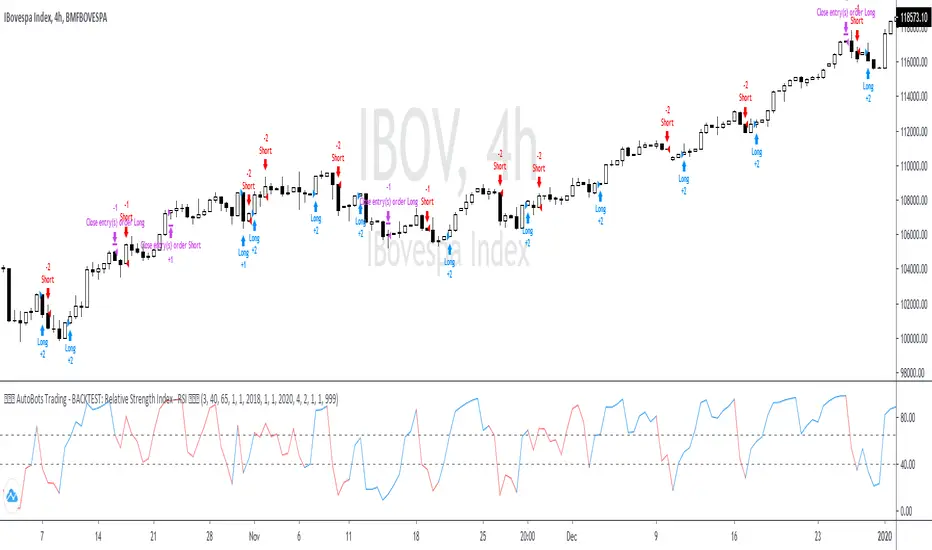
1. AutoBots Trading - BACKTEST: RSIBACKTEST: Relative Strength Index - RSI
1. Description: entry point The relative strength index ( RSI ) is a momentum indicator used in technical analysis that measures the magnitude of recent price changes to evaluate overbought or oversold conditions in the price of a stock or other asset. The RSI is displayed as an oscillator (a line graph that moves between two extremes) and can have a reading from 0 to 100. The indicator was originally developed by J. Welles Wilder Jr. and introduced in his seminal 1978 book, "New Concepts in Technical Trading Systems."
2. Strategy rules: defined based on the component, signal count, entry prices, open order count, position check, position averages, conditional closes and close signals.
3. Risk management: system was defined based on the choice of only long, only short or both sides. Defining the choice of take profit, stop loss and trailing stos (no repaint).
4. Symbol: IBOV (only)
5. Suggested Timeframe: 4H
6. Parameter for optimization: 3, 40, 65, side: both, tp: 4%, sl: 2%, ts: na
7. Walk forward simulation
7.1. In sample period: jan/2018-jan/2020
7.2. Out of sample period: jan/2020 - ago/2020
** For purpose educate only
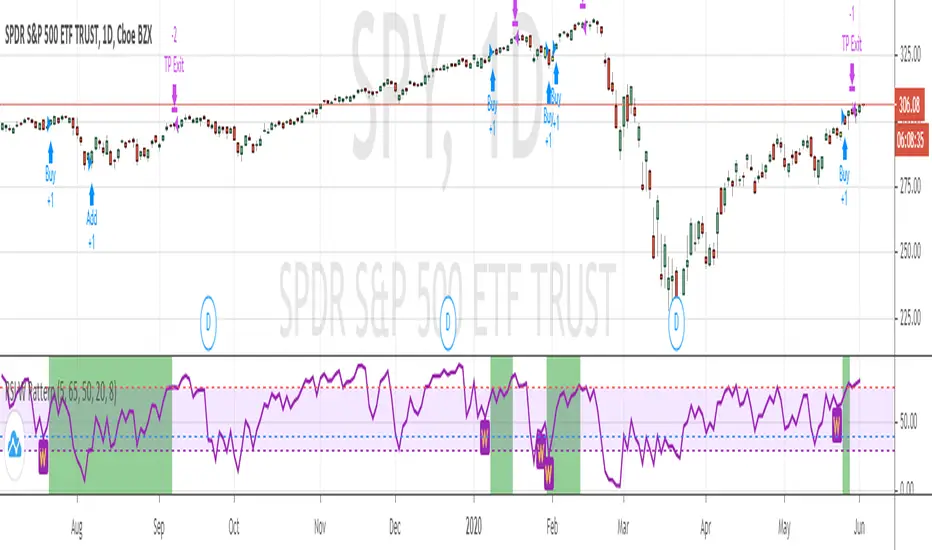
RSI W Pattern strategyThis strategy is similar to RSI V pattern strategy, but it looks for W pattern in RSI chart.
RULES
======
BUY
1. ema20 is above ema50
2. RSI5 crossing up 30 from oversold area
3. and RSI5 must be below overbought area (default value set to 65)
Add to existing Position
1. You can add on the next W pattern OR
2. if RSI5 is crossing up from below 20
Exit
1. when RSI5 reaches 75
Note: This is for short term/swing trading . which gets on when price dip in trending and quickly gets you out on RSI overbought area
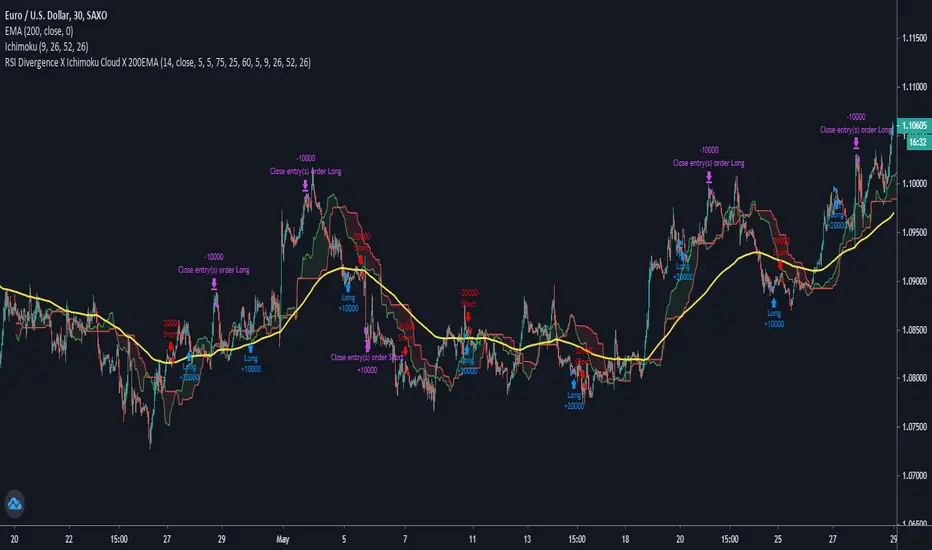
RSI Divergence X Ichimoku Cloud X 200EMAHi all,
This script is a combination of the RSI Divergence Strategy combined with Ichimoku Cloud and 200 EMA .
A long position is entered only when the RSI identifies a bullish divergence (either regular or hidden), and that the Ichimoku Cloud is above the 200 EMA . This is to ensure that there is a confirmation of a bullish trend before an entry.
Similarly, a short position is entered only when the RSI identified a bearish divergence (either regular or hidden), and that the Ichimoku Cloud is below the 200 EMA . This is to ensure that there is a confirmation of a bearish trend before an entry.
I find that this script works best on Intraday charts.
This is just a simple script I built on my third attempt of backtesting strategies on TradingView. Do give it a go and let me know if you guys have any feedback or comments about it. Happy trading!
MACD Bull Crossover and RSI Oversold 5 Candles Ago-Long StrategyHello everyone, I've been having a great time perfecting this strategy for a few weeks now. I finally feel like it's time to release it to the public and share what I have been working on.
This strategy only enters a long trade when the MACD crosses over the signal line and the RSI was oversold looking back 5 candles ago. The logic behind this is to wait for RSI to enter the oversold territory, and then when the market starts to recovery the MACD will crossover telling us the sell off is over.
This strategy will close once these 2 conditions are met.
1. MACD Histogram is above 0 and MACD crosses under the signal line.
2. RSI was overbought 5 previous candles ago.
In the strategies settings, you'll be able to enable visual stop-loss and profit levels and change those levels to what you like, enable up to 5 EMA'S,
ADDONS That Affect Strategy:
* Enable visual stop-loss and profit levels as soon as a buy signal is triggered.
* Modify stop-loss and profit levels.
* Modify RSI oversold and RSI overbought levels.
* Modify MACD Fast and Slow moving average.
ADDONS That Do Not Affect Strategy:
* Enable up to 5 EMA's. (This will not affect strategy, and is the only purpose is for people who like following EMA's.)
Thank you for taking the time to try my strategy. I hope you have the best success. I will be making a short strategy, and alerts for this strategy soon. Follow me for updates!

Dark strategy 1this strategy for bitcoin only on 30 min
you can use it by adjusting the entry values
this is based on ichimoku kinko hyo cloud and RSI
use ichimoku kinko hyo cloud for jumps and full
and use RSI in Oscillating situation
by your comment about it make we be aware of your idea

EMA(Rsi,length) Strategy onEMAのソースをRsi、期間をlenght(=デフォルトでは5)としたもの作成しました。
作成したものはデフォルトで黄色で表れております。
インジケーター上の緑色は、通常のRSIです
作成した際に参考にした足と通貨
5分足のUSDJPYとEURUSD
主にデイトレ目線で作っております。
デフォルト設定では
"EMAが75を上抜け、または25を下抜けた際に逆張りでエントリーをするもの"
として作成しております。
◎利確と損切りの幅ならびにインジケーター上の水平線は変更可能となっており、変更後はストラテジーテスターの各値も付随して自動変更します。
設定画面の各項目
RSI : 一般的なRSIの終値に対しての期間(デフォルトでは14)
Length : EMAでの期間をlengthとしております(デフォルトでは5)
up、downはインジケーター表示上のデフォルトでの75と25の水平線の位置
shortprofit,shortloss : ショートで入るとした場合の利確と損切りの長さ。(longprofit,longlossについても同様)
なおショートのポジションを持っている際にロングのポジションエントリーポイントに入った際は、持ってるショートのポジションは手仕舞いし、新たなロングのみポジションをもつようになっております。
免責事項ならびにお願い:上記の様に、各値、ならびにストラテジーテスターを設定しているつもりですが、プログラミングの入力ミスなどがある場合がございます。お知らせいただけますと幸いです。
また、投資をする際はご自身の責任と判断にて投資をなさるようお願いいたします。

E.B. INVERSE CROSSING MOVING AVERAGE - RSIThis strategy uses the EMAs 10, 20 and 200.
When the EMA 10 is above EMA 100 and crossunder EMA 20, the strategy will buy the stock. The RSI must be under BuyLevel
When the EMA 10 is under EMA 100 and crossover EMA 20, the strategy will sell the stock. The RSI must be above SellLevel
When the RSI crossunder the BuyLevel, the Buy transaction will be closed.
When the RSI crossover the SellLevel, the Sell transaction will be closed.
If during a buy/sell transaction the EMA 10 crosses EMA 100, the transaction will be closed too.
You can adapt the EMA's value and RSI's value.
Just DM to me for access!!

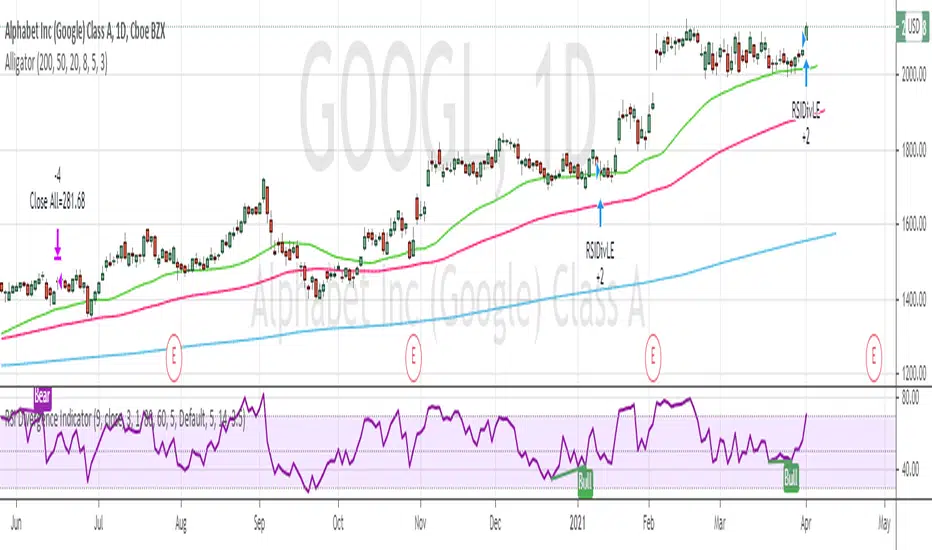
RSI5_50 with DivergenceThis is variation of RSI Divergence strategy.
I have added a filter (long term RSI) to the Rules. strategy BUYs when RSI 50 period is above 50 line and there is divergence on the short term RSI
settings
=========
short term RSI period 5
long term RSI period 50
stopLoss is 8% --- if setting is enabled
BUY Rule
========
RSI 50 is above 50 line
short term RSI is showing divergence
Add to existing
==============
if already in position, BUY when shorTermRSI is crossing above 20
TakeProfit
=========
when longTermRSI reaches 60,65, 70 and 75 level , take partial profits .
(not when crossing down --- This may affect on profits , because when price goes down , it goes very fast )
Exit
=====
when longTermRSI is crossing down 30
OR stopLoss value hits
Note: When I tested this with GOOGL stock , I have got excellent results ... any experts there , please check everything is good with scripting ...
Happy Trading

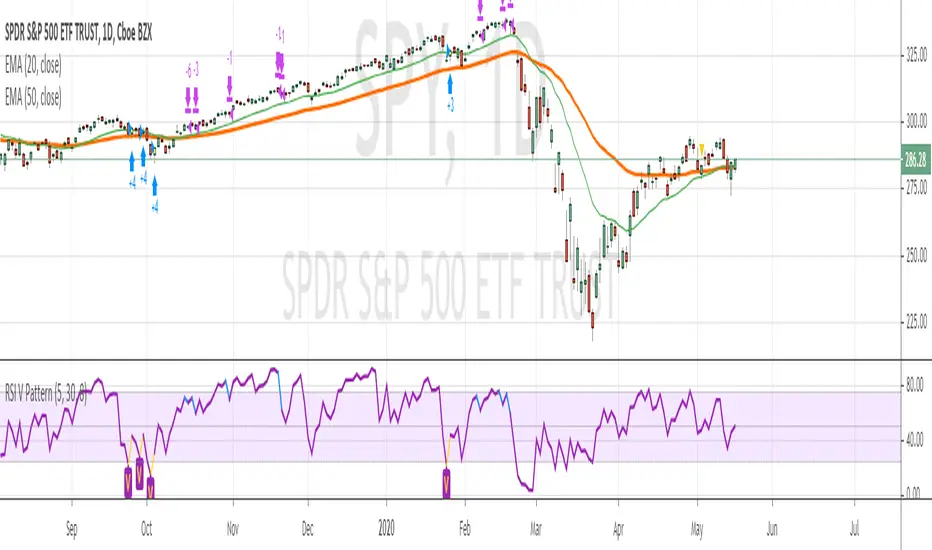
RSI V Pattern strategyThis strategy based on RSI for swing trading or short term trading
Strategy Rules
=============
LONG
1. ema20 is above ema50 --- candles are colored green on the chart
2. RSI value sharply coming up
previous candle1 low is previous candle2 low and previous candle1 RSI value is less than previous candle2
current candle RSI value is greater than previous candle1 and crossing above 30
above which makes a V shape on RSI indicator, colored in yellow on the chart , price bar is colored in yellow
3. Enter Long when the above V pattern occurs
EXIT LONG
1. when the RSI reaches 70 , close half position and move stop loss to up
2. when RSI reaches high value 90, close 3/4 position
3. when RSI crossing below 10 OR stopLoss hit , whichever happens first , close whole position
Note : take profit levels are colored in blue on RSI and Price candles
I have tested SPY , QQQ on daily chart , performance results are with 80% win rate and more than 3 profit factor
Happy Trading
Fibonacci + RSI - StrategyStrategy: Fibonacci + RSI:
- Intraday trading strategy (Scalping).
Time Frames Tested with best Results:
30 Minutes.
5 Minutes.
15 Minutes.
1 Minute
Indicators Used:
RSI (30 / 70)
Fibonacci (1 - 0.784)
How it Works:
Once the Price Hits the 1 or -1 Fibonacci Level and bounces a little bit, It checks the RSI if Over Bought or Over Sold According to 30 - 70.
If both conditions are satisfied, it triggers a Long or Short Positions.
Further Notes:
- I have put a Stop-loss with a 2% just for further upgrades.
- Not advised to use in High Volatility Markets.
- No Repaint was observed during a 2-Weeks Tests.
If you have any suggestions or modifications please contact to add.
If you have observed any bad behavior please contact to fix.
Trade wisely.

Mathias & Christer Timeframe RSIThis strategy is based on High and low RSI.
If RSI is => 80 and RSI drops enter Sell position
If RSI is =< 20 anr RSI goes up enter Buy position.
as exit I use MA crosses
MA short (30)
MA Long (50)

RSI Divergence Indicator strategyThis strategy is based on RSI divergence indicator.
RSI period setting 5
Go Long when Bull or Hidden Bull is shown
Exit when RSI goes above 75 OR when bear condition appears
PROFIT + V2We are glad to introduce you our new strategy PROFIT +.
The strategy PROFIT + is based on price and volume correlation analysis.
The entries are quick with tight stop loss. Best suits fot those who like
to get quick profit in the beginning of the price move.
It was tested on BTC , Bitmex exchange on 1 hour timeframe,
but it can also be used on 30, 15 and 10 minutes tf.
There is also ALERT INDICATOR for the strategy to receive notification
when there is a buy/sell signal.
To get acces to the strategy pm me.
-------------------------------------------------------------------------
Рады представить нашу новую торговую стратегию PROFIT+.
Стратегия PROFIT + основана на анализе корреляции цены и объёма.
Входы в стратегии быстрые с коротким стопом. Больше подходит для
тех кто любит забирать быстрый профит в самом начале движения.
Стратегия была тестирована на инструменте BTC биржа BITMEX
на 1 часовом таймфрейме, но она также работает на 30, 15 и 10 минутных тф.
Для стратегии также доступен ИНДИКАТОР АЛЕРТ для получения оповещения
при появлении buy/sell сигналов.
Для получения доступа к стратегии пишите мне в личные сообщения.

ALLinBull&Bear v9.0 STRATEGYEach of my Allin Custom Indicators combined, ads to your understanding where the Market could go next. Each of them have their own purpose and set of rules.
You will weight gathered information to get a better understanding of when to ENTER or EXIT a position (SHORT or LONG).
First you need to find the right Indicator Settings and the best preforming TimeFrame for chosen crypto or fiat pair. You will do that with a "STRATEGY" Indicator. I chose either 3min TF for highly liquid assets or 15min TF for assets of low liquidity but you can choose whatever you want to up to 30min TF.
Do not stop until you find 80% or more Precent Profitable result (test different setting on different TF for best results) in Strategy Tester. You can backtest your Strategy with different settings and in different TimeFames to find the very best results for that pair.
BACKTESTING past results does not guarantee your future results. BACKTESTING is used to fine-tune your indicator.
Example: with a guitar tuner (Strategy Tester in our case) you fine-tune your guitar (our Indicators in our case) so you know what tone the guitar will produce when you hit a certain note ("in-tuned" visual interpretation of the Market in our case). It is normal to get a 100% Precent Profitable result from backtesting with very little Drawdown. More than 80% and low drawdown usually means Indicators is "in-tune".
CUSTOM INDICATOR TYPE: STRATEGY
SETUP
There are five different settings. To use them efficiently you need to understand what is their purpose and meaning.
"2nd", "3rd" and "4th" FIELD
All of my custom indicators use data from 4 different TimeFrames. First TimeFrame is the one you picked in TradingView. Now you need to set up the other three TimeFrames. To do that you need to click on the "Settings" icon on this indicator and change the "2nd", "3rd" and "4th" field. The preferred setting I use to start searching for the best performing set of Settings is 2-8-32 OR 3-9-27 OR 4-16-64 OR 5-20-80. Those numbers are multiplication of chosen TimeFrame.
Example: setting 2-8-32 on a 5-minute TimeFrame means it will gather data from 5min TF, 10min TF (5minX2), 40min TF (5minX8) and 160min TF (5minX32).
Smoother FIELD
This Field is used to average down all that data indicator it is gathering from the price chart. I use integers like for example 9, 18, 27, and any number in between. It is connected to volatility. High Volatility needs Low Number and vice versa.
Threshold FIELD
This Field is used to cancel down all the mini signal confirmations that are false due to an insignificant influence on future price movements. This number is usually best at 21. When you set all other Fields and get satisfying results you can still try and fine-tune it even more and get even better results.
HOW TO USE IT
First, you have to choose your TimeFrame. I choose either 3min TF for highly liquid assets and 15min TF for assets of low liquidity but you can choose whatever you want to up to 30min TF. Example: if you chose 30min TimeFrame and you fill the "4th" Field with the number "80", one of observed TF by the indicator will be "30minX80" or "2400min" or "40h" TimeFrame, so it is HUGE.
It always depends based on the nature of the actual pair you are looking at. If it is very volatile with a lot of volume, the market beat for this pair settings is very different from another pair with for example very little volume and low volatility. So you need to find the right Indicator Settings at the right TimeFrame for each pair you are following. You are basically tuning your Indicator like you would tune your guitar so you know what to expect before hitting those "strings" of yours.
Find the best performing setting and TimeFrame with help from a TradingView feature called "Strategy Tester". Get familiar with this feature. But rule of thumb is: everything more than 80% Precent Profitable result with Max Drawdown (negative yield from the worst closed position) lower or similar to AvgTrade is considered good enough tuning of my Indicators.
You need to reevaluate your best setting whenever your last trade gets a negative result or something big (whale manipulation) happens on the market. You need to re-tune your Indicator so it will be in tune with the Market again. Check and try to find better performing (better Precent Profitable result, lower Drawdown) settings periodically every few days to find your best yielding results.
CUSTOM INDICATOR: BULL&BEAR
HOW TO READ IT
WHITE WAVY LINE AND TWO HORIZONTAL WHITE LINES
With this one just follow the existing rules when exiting an oversold or overbought area as in RSI,CCI or SRSI indicator. When combining with the signal colored lines in the background it then makes better sense if it is a false signal and it will turn back or it is the right signal and it will exit the oversold or overbought area and advance in that direction.
IN THE BACKGROUND: NINE COLORED LINES
Rule of thumb here is the more GREEN LINES you see the more LONG/BUY the Signal is and vice versa. It helps to look at those lines a few hours back to get the "feel" where the market is pushing the price. First (1), second (2) and seventh (7) line are the most important lines and they have to be aligned and prevailed in the same color to get a viable signal but it still needs to be confirmed with other Signals.
Before making any decisions based on visualisation you should refresh the page. Indicator is very data sensitive and needs that very last data for the most accurate visual representation of the Market.

ALLinOscillator v3.0 STRATEGYEach of my Allin Custom Indicators combined, ads to your understanding where the Market could go next. Each of them have their own purpose and set of rules.
You will weight gathered information to get a better understanding of when to ENTER or EXIT a position (SHORT or LONG).
First you need to find the right Indicator Settings and the best preforming TimeFrame for chosen crypto or fiat pair. You will do that with a "STRATEGY" Indicator. I chose either 3min TF for highly liquid assets or 15min TF for assets of low liquidity but you can choose whatever you want to up to 30min TF.
Do not stop until you find 80% or more Precent Profitable result (test different setting on different TF for best results) in Strategy Tester. You can backtest your Strategy with different settings and in different TimeFames to find the very best results for that pair.
BACKTESTING past results does not guarantee your future results. BACKTESTING is used to fine-tune your indicator.
Example: with a guitar tuner (Strategy Tester in our case) you fine-tune your guitar (our Indicators in our case) so you know what tone the guitar will produce when you hit a certain note ("in-tuned" visual interpretation of the Market in our case). It is normal to get a 100% Precent Profitable result from backtesting with very little Drawdown. More than 80% and low drawdown usually means Indicators is "in-tune".
CUSTOM INDICATOR TYPE: STRATEGY
SETUP
There are five different settings. To use them efficiently you need to understand what is their purpose and meaning.
"2nd", "3rd" and "4th" FIELD
All of my custom indicators use data from 4 different TimeFrames. First TimeFrame is the one you picked in TradingView. Now you need to set up the other three TimeFrames. To do that you need to click on the "Settings" icon on this indicator and change the "2nd", "3rd" and "4th" field. The preferred setting I use to start searching for the best performing set of Settings is 2-8-32 OR 3-9-27 OR 4-16-64 OR 5-20-80. Those numbers are multiplication of chosen TimeFrame.
Example: setting 2-8-32 on a 5-minute TimeFrame means it will gather data from 5min TF, 10min TF (5minX2), 40min TF (5minX8) and 160min TF (5minX32).
Smoother FIELD
This Field is used to average down all that data indicator it is gathering from the price chart. I use integers like for example 9, 18, 27, and any number in between. It is connected to volatility. High Volatility needs Low Number and vice versa.
Threshold FIELD
This Field is used to cancel down all the mini signal confirmations that are false due to an insignificant influence on future price movements. This number is usually best at 21. When you set all other Fields and get satisfying results you can still try and fine-tune it even more and get even better results.
HOW TO USE IT
First, you have to choose your TimeFrame. I choose either 3min TF for highly liquid assets and 15min TF for assets of low liquidity but you can choose whatever you want to up to 30min TF. Example: if you chose 30min TimeFrame and you fill the "4th" Field with the number "80", one of observed TF by the indicator will be "30minX80" or "2400min" or "40h" TimeFrame, so it is HUGE.
It always depends based on the nature of the actual pair you are looking at. If it is very volatile with a lot of volume, the market beat for this pair settings is very different from another pair with for example very little volume and low volatility. So you need to find the right Indicator Settings at the right TimeFrame for each pair you are following. You are basically tuning your Indicator like you would tune your guitar so you know what to expect before hitting those "strings" of yours.
Find the best performing setting and TimeFrame with help from a TradingView feature called "Strategy Tester". Get familiar with this feature. But rule of thumb is: everything more than 80% Precent Profitable result with Max Drawdown (negative yield from the worst closed position) lower or similar to AvgTrade is considered good enough tuning of my Indicators.
You need to reevaluate your best setting whenever your last trade gets a negative result or something big (whale manipulation) happens on the market. You need to re-tune your Indicator so it will be in tune with the Market again. Check and try to find better performing (better Precent Profitable result, lower Drawdown) settings periodically every few days to find your best yielding results.
CUSTOM INDICATOR: OSCILLATOR
HOW TO READ IT
GREEN AREA on the bottom and RED AREA on top are just like the oversold or overbought areas in RSI, CCI or SRSI and uses the same principle.
Example: when a WHITE wave line crosses-UP WHITE horizontal line in GREEN area it means that it is a LONG/BUY signal/confirmation. It needs to be confirmed with other confirmation signals in that same Indicator on in a "BULL&BEAR" Indicator to get better understanding that the price would not turn back down due to a false price move in UPWARDS direction.
GREEN or RED OSCILLATOR WAVE AREAS indicates the direction price is going and how strong the "force" behind the price move is.
Example: if WHITE LINE is over the RED/GREEN LINE the area turns GREEN and it is a LONG/BUY signal. When a shadow color is on the OTHER SIDE that means it is an added confirmation for a LONG/BUY position. When a SHADOW AREA is over the GREEN AREA and turns RED it usually means there are still forces pulling the price down.
Before making any decisions based on visualisation you should refresh the page. Indicator is very data sensitive and needs that very last data for the most accurate visual representation of the Market.

Pure RSI long onlyPlease watch the comment lines in the formula.
This is the demostration that RSI resembles actually the real trend and you could be successfull only using different levels of RSI for entering and leaving the market.
Adding a simple moving average you may obtain explosive results.

BlackPika TrendTrader StrategyIntroducing the Trend Trader
This strategy uses moving averages as its base and it can be effective for trading ALT/BTC pairs on higher timeframes (4H to D)
It is intended to give you a direction of the trend of the market. I personally use it to gauge the trend and trade major pairs.
The backtester has 0.1% commision set and a slippage of 1 tick.
Some more custom options are available as following
Fixed TP
Fixed SL
Trailing TP
Trailing SL
Nothing above constitutes as a financial advise. If you have any question, please feel free to ask !
Good luck in your trading.

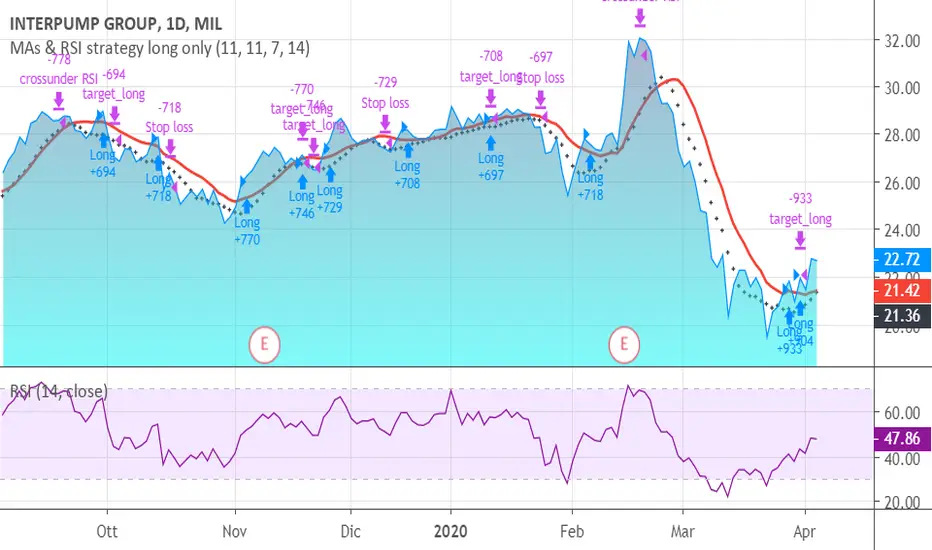
MAs & RSI strategy long onlyThis system originates from many articles by Enrico Malverti, Trading System, 2015.
Many trading systems are more stable if you use simple and not so innovative indicators, like exponential moving averages and Relative Strengthe index.
Differently by the original article:
- there is no ATR Filter, but we have introduced a Schaff Indicator. If you have multiple shares/commodities to choose, prefer what has a better value of Schaff;
- there is no fixed stop loss but a second moving average (fast), used as target. There are also Simple Mov Averages on lows (trailing stop loss for long) and a SMA on highs (trailing stop loss for short position).
Be careful, in the system only long case, because being short is not the reverse of being long (as stated in my blog)
SMA on highs are therefore only graphically put.
In this version, I’ve changed the “religious” use of EMAs (“sponsored by” Alexander Elder) to “ordinary” MAs: this because since simple moving averages measure all the factor in addition egual each one, this involve a sort of “offset” in the graph, while EMAs give a major “importance” to the last value (last close itself, you’re already considering): therefore this calculation may be counterproductive.
HOW TO OPERATE
BUY when prices crosses over SMAon long period (we suggest, however, sma long = Sma fast period = no. 11 for italian and european shares)
SELL when
prices go under SMA on lows (7 period), or under on SMA fast!
RSI crosses under level 70 or is higher than 75 (or 80, but in code there is 75)
Laguerre RSI by KivancOzbilgic STRATEGYBacktesting.
" Laguerre RSI is based on John EHLERS' Laguerre Filter to avoid the noise of RSI .
Change alpha coefficient to increase/decrease lag and smoothness.
Buy when Laguerre RSI crosses upwards above 20.
Sell when Laguerre RSI crosses down below 80.
While indicator runs flat above 80 level, it means that an uptrend is strong.
While indicator runs flat below 20 level, it means that a downtrend is strong. "
Developer: John EHLERS
Author: KivancOzbilgic

ARKADIY V1.0This strategy is made for trading Bitcoin (BTC) using data from BITMEX exchange on 4 hour timeframe.
There is also a special indicator for the strategy to receive alerts on your tradingview platform which is very handful to enter the market as soon as there is a buy/sell signal.
Strategy is based on Pine script v.4 and it uses several indicators and oscillators (modified RSI, CCI, ADX, TRIX and EMA) to generate a buy/sell signal for BTC.
There is no repaint, which means that a signal will not disappear when price goes in wrong direction.
And this is one of the advantages of the strategy over other 90% strategies.
The strategy is a SWING strategy, which means that a signal for opening a position (buy or sell) at the same time closes previous position.
Because of its specificity the strategy doesn’t have take profit/stop loss options and doesn’t use leverage.
The strategy has a backtest statistics on TradingView. 2018 – 1197%, 2019 – 79%, until March 13, 2020 – 88% of net profit.
Max drawdown (the sum of non-profitable trades until receiving a profitable trade) during a year not more than 14%.
To get access to the strategy write in comments and in private messages.
_____________________________________________________________________________________________________________
Данная стратегия работает на инструменте биткоин ( BTC ) по котировкам биржи BITMEX на 4 часовом таймфрейме, а также имеет удобные алерты для сигналов на сделку (будильник).
Это позволит Вам заниматься своими делами, не следя за тем, что происходит на рынке, но в нужное время совершить сделку, получив предупреждение на телефон / компьютер.
Стратегия построена на последней версии Pine Script, в ее основе лежит совокупность множества индикаторов и правил (модифицированные RSI, CCI, ADX, TRIX and EMA), которые в определенный момент дают сигнал на покупку или продажу BTC . Стратегия протестирована с использованием аргумента "Recalculate After Order is Filled" и подразумевает "non-repaint" базис. Другими словами, если стратегия показала вход в сделку (по итогу закрытия свечи) - то сигнал так и остается без изменений. Это выгодно отличает данную стратегию от 90% таковых в Trading View и дает уверенность, что появившийся сигнал не исчезнет в случае, если рынок пойдет в противоположную сторону.
Данная стратегия относится к сегменту SWING стратегий, когда один сигнал является одновременно закрытием одной сделки и открытием противоположной.
В связи со спецификой стратегии она не использует стоп-ордера, поэтому предполагает торговлю без плечей.
Ваш риск ограничен временным интервалом от момента, как цена пошла в противоположную сторону, до момента пока стратегия не дала сигнал на перекладку в новую сделку.
Статистика, подтвержденная бэктестом в Trading View, за последние пару лет: 2018 - 197%, 2019 - 79%, на 13.03.20 - 88%. Это данные по Чистой прибыли на вложенный капитал.
Максимальная длящаяся просадка (совокупность минусовых сделок до момента возникновения плюсовой сделки) в течение года составляет не более 18%
Основные отличия от индикаторов наших коллег:
+ Результаты бэктеста не в excell, а в платформе Trading View – прозрачная статистика по сделкам
+ Построен на принципах non-repaint basis – сигналы не исчезают и не появляются из неоткуда
+ Работает на 4Н таймфрейме. Это значит сделки не могут быть чаще, чем в раз в 4 часа. Занимайтесь своими делами, пока стратегия стоит на страже рыночного анализа. Она сама Вам сообщит, когда нужно открыть / закрыть сделку.
+ Разберется любой! Стратегия построена по принципу one-click setup
+ Поддержка с возможностью организации телефонного звонка.
Для предоставления доступа к данной стратегии - пожалуйста пишите в комментариях запрос с копией в личные сообщения. Мы быстро с Вами свяжемся.
