**MACD + RSI + MFI by IspatialResources – Multi-Tool Indicator**
This indicator is a **multi-functional technical analysis tool** that combines the following professional oscillators into a single panel:
* ✅ **Customizable MACD**
* ✅ **Advanced RSI with Moving Average and Bollinger Bands**
* ✅ **Money Flow Index (MFI)**
* ✅ **Module-based enable/disable system**
* ✅ **Fully configurable alerts**
It is designed to help identify **overbought and oversold conditions, trend strength, and momentum shifts**, improving market reading across multiple assets.
---
### 🔹 INCLUDED MODULES
**1️⃣ MACD**
* Fast and slow moving average settings
* Selectable MA type (SMA / EMA)
* Dynamic histogram
* Momentum change alerts
**2️⃣ Advanced RSI**
* Classic RSI with dynamic levels
* Moving average applied to RSI
* Optional **Bollinger Bands on RSI**
* Visual overbought and oversold signals
* Extreme condition alerts
**3️⃣ MFI (Money Flow Index)**
* Buying and selling pressure detection
* Overbought and oversold zones
* Ideal for volume and strength analysis
---
### 🔹 SUPPORTED MARKETS
This indicator can be used on:
* 📈 Cryptocurrencies
* 📊 Stock Indices
* 💱 Forex
* 📉 Stocks
It works on **all timeframes**: intraday, swing trading, and long-term analysis.
---
### 🔹 HOW TO USE IT
* Enable or disable each module from the settings panel.
* Use the **RSI with bands** to detect extreme zones.
* Confirm potential entries with the **MACD**.
* Filter false signals with the **MFI**.
* Combine it with market structure, support, and resistance.
---
### ⚠️ RISK DISCLAIMER
This indicator is **for educational and technical analysis purposes only**.
**It does not constitute financial advice and does not guarantee results.**
Trading involves risk, and each user is responsible for their own decisions.
---
### 👤 AUTHOR
Created by **Ismael** as a personal tool for market analysis and study.
---
🚀 If you find this indicator useful, feel free to support it with a “like” for future updates.
Relative Strength Index (RSI)

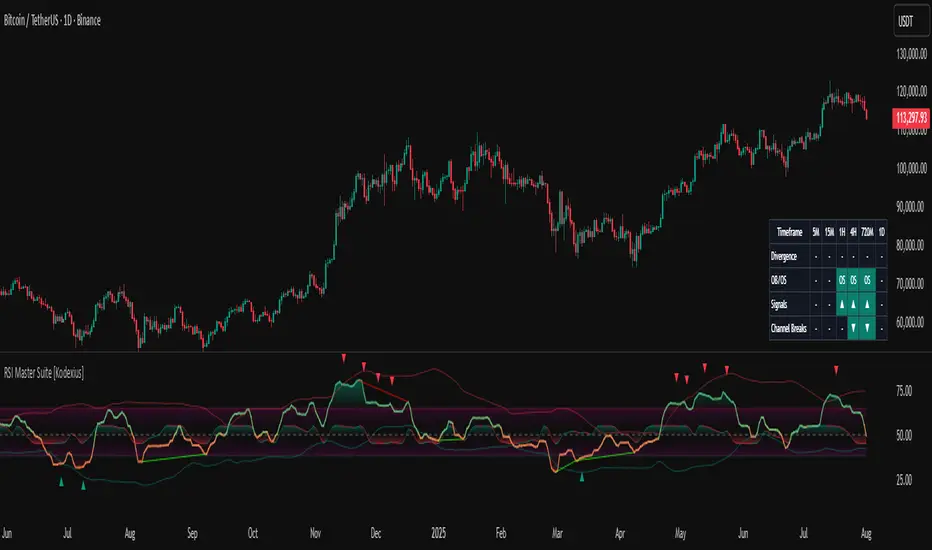
RSI Master Suite [Kodexius]RSI Master Suite is a custom momentum engine built around a proprietary RSI style oscillator, designed to go far beyond a simple overbought and oversold line. The core calculation uses internal smoothing and optional adaptive logic to create a cleaner, more stable signal that is still responsive to real time price action. On top of that engine, the script adds structure, context and visual layers that turn the oscillator into a complete decision support panel.
Instead of watching a single line cross fixed levels, you get dynamic channels, gradient zones, reversal markers, divergence mapping, multi timeframe readings, a compressed stochastic flow and automated RSI based trendlines. The goal is to let you read the state of momentum at a glance: where it is stretched, where it is reverting, how different timeframes align and where conditions may support a potential shift in direction.
This is not ordinary RSI. It is a complete momentum intelligence engine that is designed to help you identify trend strength, exhaustion, breakout style conditions and potential reversal points with a structured and visually guided approach.
⚠️ Note:
This suite builds on a custom RSI engine and enhances it with an MTF dashboard, dynamic channels, divergence and deviation logic, stochastic flow and smart alerting. It is suitable for traders who rely on price action and momentum context, from short term scalpers to swing traders and more systematic trend followers.
🔹 Features
🔸 Enhanced RSI Core
- Custom RSI style oscillator with optional adaptive smoothing that aims to reduce noise while keeping momentum turns visible in real time.
- Configurable source and oscillator length to adapt the tool to different markets, assets and styles.
- Optional RSI moving average for an extra layer of confirmation on crosses and reversals.
♦️ Adaptiveness Logic - Heart of the Oscillator
The adaptive RSI engine continuously measures how efficiently price has been moving over a recent window comparing net directional movement to the total back-and-forth volatility.
When price is trending cleanly, the engine behaves closer to a fast response, allowing the oscillator to track momentum shifts more aggressively. In choppy or noisy phases, it automatically slows down and applies a heavier smoothing profile, down-weighting random fluctuations while preserving the larger structural swings.
🔸 Dynamic Channel Suite
- Multiple channel modes (Bollinger-style, Keltner-style or Donchian-style) applied directly to RSI, giving a clear view of volatility and expansion/contraction phases in momentum.
- Upper and lower channel bands highlight when RSI is pressing into extreme territory or breaking out of its usual range.
- Channel touches and breaks can be used as an additional filter for exhaustion or continuation behavior.
🔸 Gradient Overbought/Oversold Zones
- Customizable OB/OS levels with gradient fills, making it easy to see when RSI is entering, residing in, or exiting critical zones.
- Smooth shading between overbought, oversold and midline areas provides instant visual context instead of relying on hard lines alone.
- Midline (50) is clearly marked, helping to distinguish between bullish and bearish momentum regimes.
🔸 Reversal Signal Markers
- Bullish and bearish reversal markers are plotted when RSI conditions suggest a potential shift after reaching OB/OS zones.
- Signals rely on interactions between Enhanced RSI and its internal smoothing, reducing noise compared to raw threshold crosses.
- Markers are placed directly on the RSI line for quick recognition without cluttering the price chart.
🔸 Divergence Mapping (Regular & Hidden)
- Detects regular bullish/bearish divergences as well as hidden bullish/bearish divergences between price and RSI.
- Optional “wait for candle close” behavior, giving you the choice between more reactive or more conservative confirmations.
- Separate visibility toggles for each divergence type so you can focus only on the signals that fit your approach.
🔸 Compressed Stochastic “Flow” Overlay
- Built-in adaptive and normalized Stochastic RSI layer, normalized into a compact band around the midline to avoid overcrowding the panel.
- The design focuses on direction and pressure rather than raw values: the flow band shows whether short-term momentum is actively feeding into the current RSI regime or fading against it, giving an immediate read on micro-structure underneath the main signal.
- Visual emphasis on whether the stochastic flow is leaning bullish or bearish, rather than on exact numeric values.
- Filled zones above/below the midline help to quickly gauge short-term momentum thrusts within the broader RSI context.
🔸 Multi-Timeframe (MTF) Dashboard
- Compact dashboard table that summarizes RSI conditions across multiple user-defined timeframes.
Per-timeframe cells show:
- Divergence bias (bullish/bearish/none),
- OB/OS state,
- Basic directional “signal” hints,
- RSI channel breaks (upside/downside).
Makes it easy to see alignment or conflict between intraday and higher-timeframe momentum without changing charts.
Timeframe labels auto-format into familiar units (e.g., 1H, 4H, 1D) for readability.
🔸 Oscillator-Based Trendlines & Break Detection
- Automatic drawing of oscillator trendlines derived from swing pivots on the oscillator, not just on price.
- Lines adapt to bullish or bearish structures, focusing on clean slopes with minimal internal violations.
- Breaks of these RSI trendlines are highlighted with labels, providing an additional structural confirmation of potential momentum shifts.
🔸 Alert-Ready Event Logic
- Integrated alert conditions for RSI-based reversals and all four divergence types (regular/hidden, bullish/bearish).
- Designed so you can create alerts directly from the indicator, turning key RSI events into actionable notifications.
Altogether, RSI Master Suite consolidates multiple momentum tools into one cohesive interface, helping you read the “story” of RSI and its derivatives more intuitively and efficiently.
🔹 How To Use
▶ Reading the Core Momentum Engine
- The main line represents the custom momentum engine: values sustained above the midline indicate a bullish-leaning regime, while values below it point to a more bearish-leaning backdrop. Gradient OB/OS zones make it easy to see where conditions are stretched or rotating out of extremes instead of behaving like simple on/off thresholds.
- The dynamic channel adds a second layer of structure:
• When the engine is pressing into or outside the outer channel, momentum is extended relative to its recent behaviour.
• When it oscillates closer to the mid-area of the channel, conditions are more neutral or mean-reverting.
- If the internal moving average is enabled, crosses between the engine and its average can highlight transitions between phases rather than just single-bar spikes, especially around overbought/oversold zones.
▶ Working With Reversals & Divergences
- Reversal markers appear when the engine has pushed into OB/OS regions and then begins to turn with confirmation from its internal smoothing. They are meant as attention points around potential inflection zones in momentum, not as blind entry or exit signals on their own.
- Divergence mapping compares the structure of price swings with the structure of the engine:
• Regular bullish/bearish divergences highlight potential exhaustion when price makes a new extreme but momentum does not confirm.
• Hidden bullish/bearish divergences highlight potential continuation when price pulls back but the engine remains relatively strong (or weak) underneath.
- You can choose which divergence types to display and whether they should only confirm on candle close. Keeping “wait for close” enabled generally provides a more conservative, less noisy view of divergence structure.
▶ Using the Compressed Stochastic “Flow” Overlay
- The Stochastic flow band is designed as a micro-structure layer on top of the main engine, compressed into a tight band around the midzone so it doesn’t require a separate oscillator panel.
- When the flow spends more time in the upper side of its band, short-term impulse is aligning with bullish pressure; when it leans to the lower side, short-term activity is skewed bearish. This makes it easier to judge whether recent pushes are driving with, or fading against, the current momentum regime.
- Filled areas above and below the central line turn this overlay into a quick visual gauge of short-term thrust inside the broader momentum context, especially when viewed together with reversals and divergences.
▶ Reading the Multi-Timeframe Dashboard
- The MTF dashboard compresses multiple timeframes into a small table so you can see cross-timeframe alignment without changing charts. Each column corresponds to one timeframe from your list, and each row represents a different aspect of the engine: divergence bias, OB/OS status, directional hint and channel break state.
- A practical approach is to:
• Scan for alignment, where several higher timeframes show similar momentum regimes or biases.
• Note areas of conflict, where lower timeframes are diverging or reverting while higher timeframes remain extended.
- Used this way, the dashboard acts as a context map you glance at before drilling into any individual setup.
▶ Trendlines, Breaks & Structure
- The oscillator-based trendlines are drawn from swing pivots on the engine itself. This can reveal underlying momentum structure that does not always appear clearly on raw price swings.
- Rising lines typically reflect underlying strength, while falling lines reflect underlying weakness. When these lines are broken and annotated on the panel, they can serve as structural confirmation that a prior momentum phase is weakening or transitioning into something new.
- Many users keep this component off for day-to-day monitoring and switch it on when they want a more detailed structural read on momentum phases.
👑Relative Strength Index Beast Mode👑 Relative Strength Index – Beast Mode
Key Features:
- Smooth, bold purple RSI line (14-period by default, fully customizable)
- Unique 8-level octave grid (0 to 100) with permanent side labels:
→ bottom (0) • strong oversold (12.5) • oversold (30)
→ middle (50) • overbought (70) • strong overbought (87.5) • top (100)
- Color-coded zones:
• Green zone = Strong buying pressure building
• Red zone = Extreme selling pressure / distribution
• Thick black midline at 50
- Extra reference lines: 80 (strong momentum), dashed 70/30 levels
- Clean, always-visible labels that stay fixed on the right side
Ideal for traders who:
- Want deeper insight than basic overbought/oversold
- Trade RSI divergence, failure swings, or hidden zones
- Love clean, professional, and informative charts
This isn’t just an RSI plot.
This is the King of RSI indicators.
Coded in Pine Script™ v6 | Super lightweight & fast | Made by KULDEEP157

Combined: Net Volume, RSI & ATR# Combined: Net Volume, RSI & ATR Indicator
## Overview
This custom TradingView indicator overlays **Net Volume** and **RSI (Relative Strength Index)** on the same chart panel, with RSI scaled to match the visual range of volume spikes. It also displays **ATR (Average True Range)** values in a table.
## Key Features
### Net Volume
- Calculates buying vs selling pressure by analyzing lower timeframe data
- Displays as a **yellow line** centered around zero
- Automatically selects optimal timeframe or allows manual override
- Shows net buying pressure (positive values) and selling pressure (negative values)
### RSI (Relative Strength Index)
- Traditional 14-period RSI displayed as a **blue line**
- **Overlays directly on the volume chart** - scaled to match volume spike heights
- Includes **70/30 overbought/oversold levels** (shown as dotted red/green lines)
- Adjustable scale factor to fine-tune visual sizing relative to volume
- Optional **smoothing** with multiple moving average types (SMA, EMA, RMA, WMA, VWMA)
- Optional **Bollinger Bands** around RSI smoothing line
- **Divergence detection** - identifies regular bullish/bearish divergences with labels
### ATR (Average True Range)
- Displays current ATR value in a **table at top-right corner**
- Configurable period length (default: 50)
- Multiple smoothing methods: RMA, SMA, EMA, or WMA
- Helps assess current market volatility
## Use Cases
- **Momentum & Volume Confirmation**: See if RSI trends align with net volume flows
- **Divergence Trading**: Automatically spots when price makes new highs/lows but RSI doesn't
- **Volatility Assessment**: Monitor ATR for position sizing and stop-loss placement
- **Overbought/Oversold + Volume**: Identify exhaustion when RSI hits extremes with volume spikes
## Customization
All components can be toggled on/off independently. RSI scale factor allows you to adjust how prominent the RSI line appears relative to volume bars.

Profitable Pair Correlation Divergence Scanner v6This strategy identifies divergence opportunities between two correlated assets using a combination of Z-Score spread analysis, trend confirmation, RSI & MACD momentum checks, correlation filters, and ATR-based stop-loss/take-profit management. It’s optimized for positive P&L and realistic trade execution.
Key Features:
Pair Divergence Detection:
Measures deviation between returns of two assets and identifies overbought/oversold spread conditions using Z-Score.
Trend Alignment:
Trades only in the direction of the primary asset’s trend using a fast EMA vs slow EMA filter.
Momentum Confirmation:
Confirms trades with RSI and MACD to reduce false signals.
Correlation Filter:
Ensures the pair is strongly correlated before taking trades, avoiding noisy signals.
Risk Management:
Dynamic ATR-based stop-loss and take-profit ensures proper reward-to-risk ratio.
Exit Conditions:
Automatically closes positions when Z-Score normalizes, or ATR-based exits are hit.
How It Works:
Calculate Returns:
Computes returns for both assets over the selected timeframe.
Z-Score Spread:
Calculates the spread between returns and normalizes it using moving average and standard deviation.
Trend Filter:
Only takes long trades if the fast EMA is above the slow EMA, and short trades if the fast EMA is below the slow EMA.
Momentum Confirmation:
Confirms trade direction with RSI (>50 for longs, <50 for shorts) and MACD alignment.
Correlation Check:
Ensures the pair’s recent correlation is strong enough to validate divergence signals.
Trade Execution:
Opens positions when Z-Score crosses thresholds and all conditions align. Positions close when Z-Score normalizes or ATR-based SL/TP is hit.
Plot Explanation:
Z-Score: Blue line shows divergence magnitude.
Entry Levels: Red/Green lines mark long/short thresholds.
Exit Zone: Gray lines show normalization zone.
EMA Trend Lines: Purple (fast), Orange (slow) for trend alignment.
Correlation: Teal overlay shows current correlation strength.
Usage Tips:
Use highly correlated pairs for best results (e.g., EURUSD/GBPUSD).
Run on higher timeframe charts (1h or 4h) to reduce noise.
Adjust ATR multiplier based on volatility to avoid premature stops.
Combine with alerts for automated notifications or webhook execution.
Conclusion:
The Profitable Pair Correlation Divergence Scanner v6 is designed for traders who want systematic, low-risk, positive P&L trading opportunities with minimal manual monitoring. By combining trend alignment, momentum confirmation, correlation filters, and dynamic exits, it reduces false signals and improves execution reliability.
Run it on TradingView and watch how it captures divergence opportunities while maintaining positive P&L across trades.

Trend Finder - Buy/Sell (Anuj Edition)Renko Trend Finder – Anuj Edition is a powerful trend-following tool designed to detect market direction using Renko logic instead of traditional candlesticks.
Renko filtering removes market noise, making trends clearer and reversals easier to identify.
This indicator internally builds Renko-style price movement and generates clean, high-quality Buy and Sell signals without repainting.

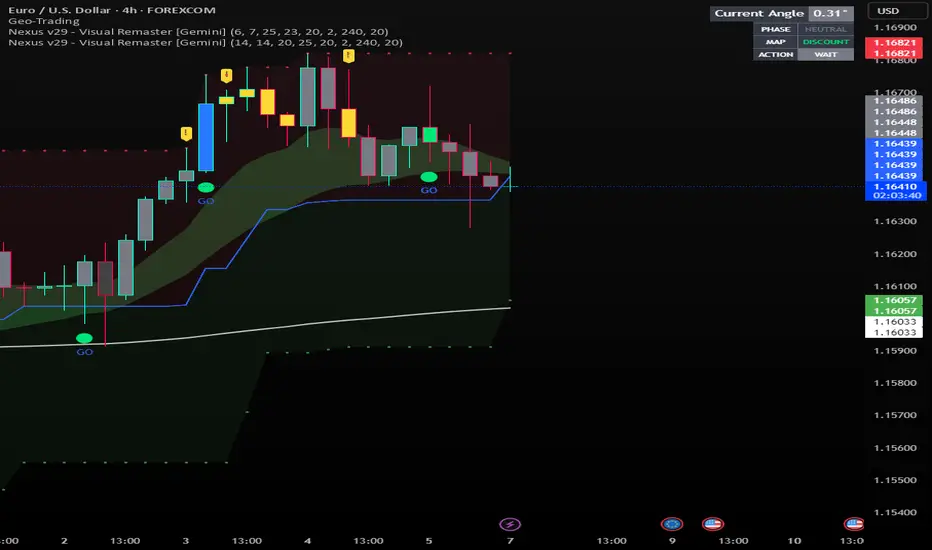
Nexus v29 - Visual Remaster- The Unified Physics EngineTitle: Nexus v29 - Visual Remaster :The Unified Physics Engine
Description:
The Physics of Price Movement
Most indicators fail because they look at only one dimension of the market. They might show you price direction (RSI) or activity (Volume), but they rarely tell you if the move has actual power behind it.
Nexus v29 is built on a "Unified Physics" philosophy. Just as an object in the physical world needs Mass, Acceleration, and Energy to move effectively, a price trend needs Volume, Force, and Trend Strength to sustain a run.
This indicator visualizes the "Life Cycle" of a trend, filtering out the noise (churn) to highlight only the high-probability explosion points where physics aligns in your favor.
How It Works: The 3 Components
1. The Energy (ADX Filter)
The White Line: This is your master switch. It measures the total energy in the system.
The Logic: When the white line is below the threshold (25), the market is in a "Dead Zone." No matter how good the candle looks, there is no kinetic energy to sustain a move. We stay flat.
The Signal: When the line crosses above 25, the engine is on.
2. The Mass (Volume Fuel)
The Background Bars: These represent the market participation.
Grey Bars: Wasted fuel. High volume in a low-energy market is just churn/absorption.
Silver/Blue Bars: Active fuel. Volume that is successfully converting into price movement.
3. The Vector (Force Histogram)
The Colored Bars: This represents the immediate directional force (Momentum).
Lime Green: Explosion. Price is pushing up, Volume is supporting it, and ADX confirms the energy. This is a valid Long environment.
Red: Crash. Price is pushing down with supported volume and high energy. This is a valid Short environment.
Orange/Maroon: Fakeout/Churn. Divergences where price and volume disagree.
The "Equation" Strategy
This script is not just a visualizer; it implements a strict "Physics Equation" to filter trades. A signal is only valid if ALL of the following conditions are met simultaneously:
Trend Alignment: Price must be on the correct side of the 200 SMA (Long > 200, Short < 200).
Volatility Gate: The market must be expanding (ATR > Baseline).
Force Threshold: The momentum impulse must be significant (Force Histogram > 100), ensuring we are catching a runaway train, not a bicycle.
Active Energy: ADX must be > 25.
How to Trade It
Entry: Wait for a Lime Green (Long) or Red (Short) bar that breaks out while the White Line (ADX) is rising. This confirms "Unified Physics"—Mass, Force, and Energy are all aligned.
The Lifecycle Exit: Do not wait for the trend to reverse. Exit when the "physics" break.
Look for the Force Histogram bars to start shrinking for 2 consecutive candles. This indicates momentum is fading (deceleration).
Exit immediately on the close of the second shrinking bar to capture the bulk of the impulsive move (The "Meat" of the trade) before the inevitable pullback.
Indicator Settings
RSI Length: Standard 14 (The Speed).
Volume Lookback: 100 (For relative scaling).
ADX Threshold: 25 (The "Go/No-Go" Line).
Trend Filter: 200 Period SMA.
Disclaimer: Trading involves high risk. This tool helps visualize market conditions based on historical physics but does not guarantee future performance. Always use proper risk management.
Dynamic 15-Ticker Multi-Symbol Table 2025 EditionTitle:
Dynamic 15-Ticker Multi-Symbol Table 2025 Edition
Description:
This script provides a multi-ticker table for TradingView charts. It is fully open-source and free to use. The table displays up to 15 tickers, including SPY as the baseline symbol. The script updates in real-time on any timeframe.
Features:
SPY baseline: The first row always shows SPY for reference.
Custom tickers: Add up to 14 additional tickers via the input settings. Rows without tickers remain hidden.
Price and direction: Each ticker row displays the current price and an indicator of direction based on recent price movement.
RSI (14) indicator: Shows the current relative strength index value with a simple directional marker.
Volume formatting: Displays volume values in thousands, millions, or billions automatically. Volume change is indicated with directional markers.
Stable layout: The table uses alternating row colors for readability and maintains consistent row count without collapsing or disappearing rows.
Real-time updates: All displayed values refresh automatically on any chart timeframe.
How to use:
Add the script to your chart.
Enter your chosen tickers in the input settings. SPY will remain as the first ticker automatically.
Tickers not entered will remain hidden. When a ticker is removed, the row will be removed-dynamically.
Observe live prices, RSI values, and volume changes directly on your chart without switching symbols.
Additional notes:
The script is fully open-source; users are encouraged to modify or improve it.
No external links or references are required to understand its function.
This script does not repaint and does not require additional requests to update values.

Open Interest RSI [BackQuant]Open Interest RSI
A multi-venue open interest oscillator that aggregates OI across major derivatives exchanges, converts it to coin or USD terms, and runs an RSI-style engine on that aggregated OI so you can track positioning pressure, crowding, and mean reversion in leverage flows, not just in price.
What this is
This tool is an RSI built on top of aggregated open interest instead of price. It pulls futures OI from several major exchanges, converts it into a unified unit (COIN or USD), sums it into a single synthetic OI candle, then applies RSI and smoothing to that combined series.
You can then render that Open Interest RSI in different visual modes:
Clean line or colored line for classic oscillator-style reads.
Column-style oscillator for impulse and compression views.
Flag mode that fills between OI RSI and its EMA for trend/mean reversion blends. See:
Heatmap mode that paints the panel based on OI RSI extremes, ideal for scanning. See:
On top of that it includes:
Aggregated OI source selection (Binance, Bybit, OKX, Bitget, Kraken, HTX, Deribit).
Choice of OI units (COIN or USD).
Reference lines and OB/OS zones.
Extreme highlighting for either trend or mean reversion.
A vertical OI RSI meter that acts as a quick strength gauge.
Aggregated open interest source
Under the hood, the indicator builds a synthetic open interest candle by:
Looping over a list of supported exchanges: Binance, Bybit, OKX, Bitget, Kraken, HTX, Deribit.
Looping over multiple contract suffixes (such as USDT.P, USD.P, USDC.P, USD.PM) to capture different contract types on each venue.
Requesting OI candles from each venue + contract combination for the same underlying symbol.
Converting each OI stream into a common unit: In COIN mode, everything is normalized into coin-denominated OI. In USD mode, coin OI is multiplied by price to approximate notional OI.
Summing up open, high, low and close of OI across venues into a single aggregated OI candle.
If no valid OI is available for the current symbol across all sources, the script throws a clear runtime error so you know you are on an unsupported market.
This gives you a single, exchange-agnostic open interest curve instead of being tied to one venue. That aggregated OI is then passed into the RSI logic.
How the OI RSI is calculated
The RSI side is straightforward, but it is applied to the aggregated OI close:
Compute a base RSI of aggregated OI using the Calculation Period .
Apply a simple moving average of length Smoothing Period (SMA) to reduce noise in the raw OI RSI.
Optionally apply an EMA on top of the smoothed OI RSI as a moving average signal line.
Key parameters:
Calculation Period – base RSI length for OI.
Smoothing Period (SMA) – extra smoothing on the RSI value.
EMA Period – EMA length on the smoothed OI RSI.
The result is:
oi_rsi – raw RSI of aggregated OI.
oi_rsi_s – SMA-smoothed OI RSI.
ma – EMA of the smoothed OI RSI.
Thresholds and extremes
You control three core thresholds:
Mid Point – central reference level, typically 50.
Extreme Upper Threshold – high-level OI RSI edge (for example 80).
Extreme Lower Threshold – low-level OI RSI edge (for example 20).
These thresholds are used for:
Reference lines or OB/OS zone fills.
Heatmap gradient bounds.
Background highlighting of extremes.
The Extreme Highlighting mode controls how extremes are interpreted:
None – do nothing special in extreme regions.
Mean-Rev – background turns red on high OI RSI and green on low OI RSI, framing extremes as contrarian zones.
Trend – background turns green on high OI RSI and red on low OI RSI, framing extremes as participation zones aligned with the prevailing move.
Reference lines and OB/OS zones
You can choose:
None – clean plotting without guides.
Basic Reference Lines – mid, upper and lower thresholds as simple gray horizontals.
OB/OS Levels – filled zones between:
Upper OB: from the upper threshold to 100, colored with the short/overbought color.
Lower OS: from 0 to the lower threshold, colored with the long/oversold color.
These guides help visually anchor the OI RSI within "normal" versus "extreme" regions.
Plotting modes
The Plotting Type input controls how OI RSI is drawn. All modes share the same underlying OI and RSI logic, but emphasise different aspects of the signal.
1) Line mode
This is the classic oscillator representation:
Plots the smoothed OI RSI as a simple line using RSI Line Color and RSI Line Width .
Optionally plots the EMA overlay on the same panel.
Works well when you want standard RSI-style signals on leverage flows: crosses of the midline, divergences versus price, and so on.
2) Colored Line mode
In this mode:
The OI RSI is plotted as a line, but its color is dynamic.
If the smoothed OI RSI is above the mid point, it uses the Long/OB Color .
If it is below the mid point, it uses the Short/OS Color .
This creates an instant visual regime switch between "bullish positioning pressure" and "bearish positioning pressure", while retaining the feel of a traditional RSI line.
3) Oscillator mode
Oscillator mode renders OI RSI as vertical columns around the mid level:
The smoothed OI RSI is plotted as columns using plot.style_columns .
The histogram base is fixed at 50, so bars extend above and below the mid line.
Bar color is dynamic, using long or short colors depending on which side of the mid point the value sits.
This representation makes impulse and compression in OI flows more obvious. It is especially useful when you want to focus on how quickly OI RSI is expanding or contracting around its neutral level. See:
4) Flag mode
Flag mode turns OI RSI and its EMA into a two-line band with a filled area between them:
The smoothed OI RSI and its EMA are both plotted.
A fill is drawn between them.
The fill color flips between the long color and the short color depending on whether OI RSI is above or below its EMA.
Black outlines are added to both lines to make the band clear against any background.
This creates a "flag" style region where:
Green fills show OI RSI leading its EMA, suggesting positive positioning momentum.
Red fills show OI RSI trailing below its EMA, suggesting negative positioning momentum.
Crossovers of the two lines can be read as shifts in OI momentum regime.
Flag mode is useful if you want a more structural view that combines both the level and slope behaviour of OI RSI. See:
5) Heatmap mode
Heatmap mode recasts OI RSI as a single-row gradient instead of a line:
A single row at level 1 is plotted using column style.
The color is pulled from a gradient between the lower and upper thresholds: Near the lower threshold it approaches the short/oversold color and near the upper threshold it approaches the long/overbought color.
The EMA overlay and reference lines are disabled in this mode to keep the panel clean.
This is a very compact way to track OI RSI state at a glance, especially when stacking it alongside other indicators. See:
OI RSI vertical meter
Beyond the main plot, the script can draw a small "thermometer" table showing the current OI RSI position from 0 to 100:
The meter is a two-column table with a configurable number of rows.
Row colors form an inverted gradient: red at the top (100) and green at the bottom (0).
The script clamps OI RSI between 0 and 100 and maps it to a row index.
An arrow marker "▶" is drawn next to the row corresponding to the current OI RSI value.
0 and 100 labels are printed at the ends of the scale for orientation.
You control:
Show OI RSI Meter – turn the meter on or off.
OI RSI Blocks – number of vertical blocks (granularity).
OI RSI Meter Position – panel anchor (top/bottom, left/center/right).
The meter is particularly helpful if you keep the main plot in a small panel but still want an intuitive strength gauge.
How to read it as a market pressure gauge
Because this is an RSI built on aggregated open interest, its extremes and regimes speak to positioning pressure rather than price alone:
High OI RSI (near or above the upper threshold) indicates that open interest has been increasing aggressively relative to its recent history. This often coincides with crowded leverage and a buildup of directional pressure.
Low OI RSI (near or below the lower threshold) indicates aggressive de-leveraging or closing of positions, often associated with flushes, forced unwinds or post-liquidation clean-ups.
Values around the mid point indicate more balanced positioning flows.
You can combine this with price action:
Price up with rising OI RSI suggests fresh leverage joining the move, a more persistent trend.
Price up with falling OI RSI suggests shorts covering or longs taking profit, more fragile upside.
Price down with rising OI RSI suggests aggressive new shorts or levered selling.
Price down with falling OI RSI suggests de-leveraging and potential exhaustion of the move.
Trading applications
Trend confirmation on leverage flows
Use OI RSI to confirm or question a price trend:
In an uptrend, rising OI RSI with values above the mid point indicates supportive leverage flows.
In an uptrend, repeated failures to lift OI RSI above mid point or persistent weakness suggest less committed participation.
In a downtrend, strong OI RSI on the downside points to aggressive shorting.
Mean reversion in positioning
Use thresholds and the Mean-Rev highlight mode:
When OI RSI spends extended time above the upper threshold, the crowd is extended on one side. That can set up squeeze risk in the opposite direction.
When OI RSI has been pinned low, it suggests heavy de-leveraging. Once price stabilises, a re-risking phase is often not far away.
Background colours in Mean-Rev mode help visually identify these periods.
Regime mapping with plotting modes
Different plotting modes give different perspectives:
Heatmap mode for dashboard-style use where you just need to know "hot", "neutral" or "cold" on OI flows at a glance.
Oscillator mode for short term impulses and compression reads around the mid line. See:
Flag mode for blending level and trend of OI RSI into a single banded visual. See:
Settings overview
RSI group
Plotting Type – None, Line, Colored Line, Oscillator, Flag, Heatmap.
Calculation Period – base RSI length for OI.
Smoothing Period (SMA) – smoothing on RSI.
Moving Average group
Show EMA – toggle EMA overlay (not used in heatmap).
EMA Period – length of EMA on OI RSI.
EMA Color – colour of EMA line.
Thresholds group
Mid Point – central reference.
Extreme Upper Threshold and Extreme Lower Threshold – OB/OS thresholds.
Select Reference Lines – none, basic lines or OB/OS zone fills.
Extreme Highlighting – None, Mean-Rev, Trend.
Extra Plotting and UI
RSI Line Color and RSI Line Width .
Long/OB Color and Short/OS Color .
Show OI RSI Meter , OI RSI Blocks , OI RSI Meter Position .
Open Interest Source
OI Units – COIN or USD.
Exchange toggles: Binance, Bybit, OKX, Bitget, Kraken, HTX, Deribit.
Notes
This is a positioning and pressure tool, not a complete system. It:
Models aggregated futures open interest across multiple centralized exchanges.
Transforms that OI into an RSI-style oscillator for better comparability across regimes.
Offers several visual modes to match different workflows, from detailed analysis to compact dashboards.
Use it to understand how leverage and positioning are evolving behind the price, to gauge when the crowd is stretched, and to decide whether to lean with or against that pressure. Attach it to your existing signals, not in place of them.
Also, please check out @NoveltyTrade for the OI Aggregation logic & pulling the data source!
Here is the original script:

Bollinger Bands Mean Reversion using RSI [Krishna Peri]How it Works
Long entries trigger when:
- RSI reaches oversold levels, and
- At least one bullish candle closes inside the lower Bollinger Band
Short entries trigger when:
- RSI reaches overbought levels, and
- At least one bearish candle closes inside the upper Bollinger Band
This approach aims to capture exhaustion moves where price pushes into extreme deviation from its mean and then snaps back toward the middle band.
Important Disclaimer
This is a mean-reversion strategy, which means it performs best in sideways, ranging, or slowly oscillating market conditions. When markets shift into strong trends, Bollinger Bands expand and volatility increases, which may cause some signals to become inaccurate or fail altogether.
For best results, combine this script with:
- Price action
- Market structure
- Higher-timeframe trend context
- Previous day/week/month highs & lows
- Untested liquidity levels or imbalance zones
- Session timing (Asia, London, NY)
Using these confluences helps filter out low-probability trades and significantly improves consistency and precision.

Impulse Reactor RSI-SMA Trend Indicator [ApexLegion]Impulse Reactor RSI-SMA Trend Indicator
Introduction and Theoretical Background
Design Rationale
Standard indicators frequently generate binary 'BUY' or 'SELL' signals without accounting for the broader market context. This often results in erratic "Flip-Flop" behavior, where signals are triggered indiscriminately regardless of the prevailing volatility regime.
Impulse Reactor was engineered to address this limitation by unifying two critical requirements: Quantitative Rigor and Execution Flexibility.
The Solution
Composite Analytical Framework This script is not a simple visual overlay of existing indicators. It is an algorithmic synthesis designed to function as a unified decision-making engine. The primary objective was to implement rigorous quantitative analysis (Volatility Normalization, Structural Filtering) directly within an alert-enabled framework. This architecture is designed to process signals through strict, multi-factor validation protocols before generating real-time notifications, allowing users to focus on structurally validated setups without manual monitoring.
How It Works
This is not a simple visual mashup. It utilizes a cross-validation algorithm where the Trend Structure acts as a gatekeeper for Momentum signals:
Logic over Lag: Unlike simple moving average crossovers, this script uses a 15-layer Gradient Ribbon to detect "Laminar Flow." If the ribbon is knotted (Compression), the system mathematically suppresses all signals.
Volatility Normalization: The core calculation adapts to ATR (Average True Range). This means the indicator automatically expands in volatile markets and contracts in quiet ones, maintaining accuracy without constant manual tweaking.
Adaptive Signal Thresholding: It incorporates an 'Anti-Greed' algorithm (Dynamic Thresholding) that automatically adjusts entry criteria based on trend duration. This logic aims to mitigate the risk of entering positions during periods of statistical trend exhaustion.
Why Use It?
Market State Decoding: The gradient Ribbon visualizes the underlying trend phase in real-time.
◦ Cyan/Blue Flow: Strong Bullish Trend (Laminar Flow).
◦ Magenta/Pink Flow: Strong Bearish Trend.
◦ Compressed/Knotted: When the ribbon lines are tightly squeezed or overlapping, it signals Consolidation. The system filters signals here to avoid chop.
Noise Reduction: The goal is not to catch every pivot, but to isolate high-confidence setups. The logic explicitly filters out minor fluctuations to help maintain position alignment with the broader trend.
⚖️ Chapter 1: System Architecture
Introduction: Composite Analytical Framework
System Overview
Impulse Reactor serves as a comprehensive technical analysis engine designed to synthesize three distinct market dimensions—Momentum, Volatility, and Trend Structure—into a unified decision-making framework. Unlike traditional methods that analyze these metrics in isolation, this system functions as a central processing unit that integrates disparate data streams to construct a coherent model of market behavior.
Operational Objective
The primary objective is to transition from single-dimensional signal generation to a multi-factor assessment model. By fusing data from the Impulse Core (Volatility), Gradient Oscillator (Momentum), and Structural Baseline (Trend), the system aims to filter out stochastic noise and identify high-probability trade setups grounded in quantitative confluence.
Market Microstructure Analysis: Limitations of Conventional Models
Extensive backtesting and quantitative analysis have identified three critical inefficiencies in standard oscillator-based strategies:
• Bounded Oscillator Limitations (The "Oscillation Trap"): Traditional indicators such as RSI or Stochastics are mathematically constrained between fixed values (0 to 100). In strong trending environments, these metrics often saturate in "overbought" or "oversold" zones. Consequently, traders relying on static thresholds frequently exit structurally valid positions prematurely or initiate counter-trend trades against prevailing momentum, resulting in suboptimal performance.
• Quantitative Blindness to Quality: Standard moving averages and trend indicators often fail to distinguish the qualitative nature of price movement. They treat low-volume drift and high-velocity expansion identically. This inability to account for "Volatility Quality" leads to delayed responsiveness during critical market events.
• Fractal Dissonance (Timeframe Disconnect): Financial markets exhibit fractal characteristics where trends on lower timeframes may contradict higher timeframe structures. Manual integration of multi-timeframe analysis increases cognitive load and susceptibility to human error, often resulting in conflicting biases at the point of execution.
Core Design Principles
To mitigate the aforementioned systemic inefficiencies, Impulse Reactor employs a modular architecture governed by three foundational principles:
Principle A:
Volatility Precursor Analysis Market mechanics demonstrate that volatility expansion often functions as a leading indicator for directional price movement. The system is engineered to detect "Volatility Deviation" — specifically, the divergence between short-term and long-term volatility baselines—prior to its manifestation in price action. This allows for entry timing aligned with the expansion phase of market volatility.
Principle B:
Momentum Density Visualization The system replaces singular momentum lines with a "Momentum Density" model utilizing a 15-layer Simple Moving Average (SMA) Ribbon.
• Concept: This visualization represents the aggregate strength and consistency of the trend.
• Application: A fully aligned and expanded ribbon indicates a robust trend structure ("Laminar Flow") capable of withstanding minor counter-trend noise, whereas a compressed ribbon signals consolidation or structural weakness.
Principle C:
Adaptive Confluence Protocols Signal validity is strictly governed by a multi-dimensional confluence logic. The system suppresses signal generation unless there is synchronized confirmation across all three analytical vectors:
1. Volatility: Confirmed expansion via the Impulse Core.
2. Momentum: Directional alignment via the Hybrid Oscillator.
3. Structure: Trend validation via the Baseline. This strict filtering mechanism significantly reduces false positives in non-trending (choppy) environments while maintaining sensitivity to genuine breakouts.
🔍 Chapter 2: Core Modules & Algorithmic Logic
Module A: Impulse Core (Normalized Volatility Deviation)
Operational Logic The Impulse Core functions as a volatility-normalized momentum gauge rather than a standard oscillator. It is designed to identify "Volatility Contraction" (Squeeze) and "Volatility Expansion" phases by quantifying the divergence between short-term and long-term volatility states.
Volatility Z-Score Normalization
The formula implements a custom normalization algorithm. Unlike standard oscillators that rely on absolute price changes, this logic calculates the Z-Score of the Volatility Spread.
◦ Numerator: (atr_f - atr_s) captures the raw momentum of volatility expansion.
◦ Denominator: (std_f + 1e-6) standardizes this value against historical variance.
◦ Result: This allows the indicator scales consistently across assets (e.g., Bitcoin vs. Euro) without manual recalibration.
f_impulse() =>
atr_f = ta.atr(fastLen) // Fast Volatility Baseline
atr_s = ta.atr(slowLen) // Slow Volatility Baseline
std_f = ta.stdev(atr_f, devLen) // Volatility Standard Deviation
(atr_f - atr_s) / (std_f + 1e-6) // Normalized Differential Calculation
Algorithmic Framework
• Differential Calculation: The system computes the spread between a Fast Volatility Baseline (ATR-10) and a Slow Volatility Baseline (ATR-30).
• Normalization Protocol: To standardize consistency across diverse asset classes (e.g., Forex vs. Crypto), the raw differential is divided by the standard deviation of the volatility itself over a 30-period lookback.
• Signal Generation:
◦ Contraction (Squeeze): When the Fast ATR compresses below the Slow ATR, it registers a potential volatility buildup phase.
◦ Expansion (Release): A rapid divergence of the Fast ATR above the Slow ATR signals a confirmed volatility expansion, validating the strength of the move.
Module B: Gradient Oscillator (RSI-SMA Hybrid)
Design Rationale To mitigate the "noise" and "false reversal" signals common in single-line oscillators (like standard RSI), this module utilizes a 15-Layer Gradient Ribbon to visualize momentum density and persistence.
Technical Architecture
• Ribbon Array: The system generates 15 sequential Simple Moving Averages (SMA) applied to a volatility-adjusted RSI source. The length of each layer increases incrementally.
• State Analysis:
Momentum Alignment (Laminar Flow): When all 15 layers are expanded and parallel, it indicates a robust trend where buying/selling pressure is distributed evenly across multiple timeframes. This state helps filter out premature "overbought/oversold" signals.
• Consolidation (Compression): When the distance between the fastest layer (Layer 1) and the slowest layer (Layer 15) approaches zero or the layers intersect, the system identifies a "Non-Tradable Zone," preventing entries during choppy market conditions.
// Laminar Flow Validation
f_validate_trend() =>
// Calculate spread between Ribbon layers
ribbon_spread = ta.stdev(ribbon_array, 15)
// Only allow signals if Ribbon is expanded (Laminar Flow)
is_flowing = ribbon_spread > min_expansion_threshold
// If compressed (Knotted), force signal to false
is_flowing ? signal : na
Module C: Adaptive Signal Filtering (Behavioral Bias Mitigation)
This subsystem, operating as an algorithmic "Anti-Greed" Mechanism, addresses the statistical tendency for signal degradation following prolonged trends.
Dynamic Threshold Adjustment
• Win Streak Detection: The algorithm internally tracks the outcome of closed trade cycles.
• Sensitivity Multiplier: Upon detecting consecutive successful signals in the same direction, a Penalty_Factor is applied to the entry logic.
• Operational Impact: This effectively raises the Required_Slope threshold for subsequent signals. For example, after three consecutive bullish signals, the system requires a 30% steeper trend angle to validate a fourth entry. This enforces stricter discipline during extended trends to reduce the probability of entering at the point of trend exhaustion.
Anti-Greed Logic: Dynamic Threshold Calculation
f_adjust_threshold(base_slope, win_streak) =>
// Adds a 10% penalty to the difficulty for every consecutive win
penalty_factor = 0.10
risk_scaler = 1 + (win_streak * penalty_factor)
// Returns the new, harder-to-reach threshold
base_slope * risk_scaler
Module D: Trend Baseline (Triple-Smoothed Structure)
The Trend Baseline serves as the structural filter for all signals. It employs a Triple-Smoothed Hybrid Algorithm designed to balance lag reduction with noise filtration.
Smoothing Stages
1. Volatility Banding: Utilizes a SuperTrend-based calculation to establish the upper and lower boundaries of price action.
2. Weighted Filter: Applies a Weighted Moving Average (WMA) to prioritize recent price data.
3. Exponential Smoothing: A final Exponential Moving Average (EMA) pass is applied to create a seamless baseline curve.
Functionality
This "Heavy" baseline resists minor intraday volatility spikes while remaining responsive to sustained structural shifts. A signal is only considered valid if the price action maintains structural integrity relative to this baseline
🚦 Chapter 3: Risk Management & Exit Protocols
Quantitative Risk Management (TP/SL & Trailing)
Foundational Architecture: Volatility-Adjusted Geometry Unlike strategies relying on static nominal values, Impulse Reactor establishes dynamic risk boundaries derived from quantitative volatility metrics. This design aligns trade invalidation levels mathematically with the current market regime.
• ATR-Based Dynamic Bracketing:
The protocol calculates Stop-Loss and Take-Profit levels by applying Fibonacci coefficients (Default: 0.786 for SL / 1.618 for TP) to the Average True Range (ATR).
◦ High Volatility Environments: The risk bands automatically expand to accommodate wider variance, preventing premature exits caused by standard market noise.
◦ Low Volatility Environments: The bands contract to tighten risk parameters, thereby dynamically adjusting the Risk-to-Reward (R:R) geometry.
• Close-Validation Protocol ("Soft Stop"):
Institutional algorithms frequently execute liquidity sweeps—driving prices briefly below key support levels to accumulate inventory.
◦ Mechanism: When the "Soft Stop" feature is enabled, the system filters out intraday volatility spikes. The stop-loss is conditional; execution is triggered only if the candle closes beyond the invalidation threshold.
◦ Strategic Advantage: This logic distinguishes between momentary price wicks and genuine structural breakdowns, preserving positions during transient volatility.
• Step-Function Trailing Mechanism:
To protect unrealized PnL while allowing for normal price breathing, a two-phase trailing methodology is employed:
◦ Phase 1 (Activation): The trailing function remains dormant until the price advances by a pre-defined percentage threshold.
◦ Phase 2 (Dynamic Floor): Once armed, the stop level creates a moving floor, adjusting relative to price action while maintaining a volatility-based (ATR) buffer to systematically protect unrealized PnL.
• Algorithmic Exit Protocols (Dynamic Liquidity Analysis)
◦ Rationale: Inefficiencies of Static Targets Static "Take Profit" levels often result in suboptimal exits. They compel traders to close positions based on arbitrary figures rather than evolving market structure, potentially capping upside during significant trends or retaining positions while the underlying trend structure deteriorates.
◦ Solution: Structural Integrity Assessment The system utilizes a Dynamic Liquidity Engine to continuously audit the validity of the position. Instead of targeting a specific price point, the algorithm evaluates whether the trend remains statistically robust.
Multi-Factor Exit Logic (The Tri-Vector System)
The Smart Exit protocol executes only when specific algorithmic invalidation criteria are met:
• 1. Momentum Exhaustion (Confluence Decay): The system monitors a 168-hour rolling average of the Confluence Score. A significant deviation below this historical baseline indicates momentum exhaustion, signaling that the driving force behind the trend has dissipated prior to a price reversal. This enables preemptive exits before a potential drawdown.
• 2. Statistical Over-Extension (Mean Reversion): Utilizing the core volatility logic, the system identifies instances where price deviates beyond 2.0 standard deviations from the mean. While the trend may be technically bullish, this statistical anomaly suggests a high probability of mean reversion (elastic snap-back), triggering a defensive exit to capitalize on peak valuation.
• 3. Oscillator Rejection (Immediate Pivot): To manage sudden V-shaped volatility, the system monitors RSI pivots. If a sharp "Pivot High" or divergence is detected, the protocol triggers an immediate "Peak Exit," bypassing standard trend filters to secure liquidity during high-velocity reversals.
🎨 Chapter 4: Visualization Guide
Gradient Oscillator Ribbon
The 15-layer SMA ribbon visualized via plot(r1...r15) represents the "Momentum Density" of the market.
• Visuals:
◦ Cyan/Blue Ribbon: Indicates Bullish Momentum.
◦ Pink/Magenta Ribbon: Indicates Bearish Momentum.
• Interpretation:
◦ Laminar Flow: When the ribbon expands widely and flows in parallel, it signifies a robust trend where momentum is distributed evenly across timeframes. This is the ideal state for trend-following.
◦ Compression (Consolidation): If the ribbon becomes narrow, twisted, or knotted, it indicates a "Non-Tradable Zone" where the market lacks a unified direction. Traders are advised to wait for clarity.
◦ Over-Extension: If the top layer crosses the Overbought (85) or Oversold (15) lines, it visually warns of potential market overheating.
Trend Baseline
The thick, color-changing line plotted via plot(baseline) represents the Structural Backbone of the market.
• Visuals: Changes color based on the trend direction (Blue for Bullish, Pink for Bearish).
• Interpretation:
Structural Filter: Long positions are statistically favored only when price action sustains above this baseline, while short positions are favored below it.
Dynamic Support/Resistance: The baseline acts as a dynamic support level during uptrends and resistance during downtrends.
Entry Signals & Labels
Text labels ("Long Entry", "Short Entry") appear when the system detects high-probability setups grounded in quantitative confluence.
• Visuals: Labeled signals appear above/below specific candles.
• Interpretation:
These signals represent moments where Volatility (Expansion), Momentum (Alignment), and Structure (Trend) are synchronized.
Smart Exit: Labels such as "Smart Exit" or "Peak Exit" appear when the system detects momentum exhaustion or structural decay, prompting a defensive exit to preserve capital.
Dynamic TP/SL Boxes
The semi-transparent colored zones drawn via fill() represent the risk management geometry.
• Visuals: Colored boxes extending from the entry point to the Take Profit (TP) and Stop Loss (SL) levels.
• Function:
Volatility-Adjusted Geometry: Unlike static price targets, these boxes expand during high volatility (to prevent wicks from stopping you out) and contract during low volatility (to optimize Risk-to-Reward ratios).
SAR + MACD Glow
Small glowing shapes appearing above or below candles.
• Visuals: Triangle or circle glows near the price bars.
• Interpretation:
This visual indicates a secondary confirmation where Parabolic SAR and MACD align with the main trend direction. It serves as an additional confluence factor to increase confidence in the trade setup.
Support/Resistance Table
A small table located at the bottom-right of the chart.
• Function: Automatically identifies and displays recent Pivot Highs (Resistance) and Pivot Lows (Support).
• Interpretation: These levels can be used as potential targets for Take Profit or invalidation points for manual Stop Loss adjustments.
🖥️ Chapter 5: Dashboard & Operational Guide
Integrated Analytics Panel (Dashboard Overview)
To facilitate rapid decision-making without manual calculation, the system aggregates critical market dimensions into a unified "Heads-Up Display" (HUD). This panel monitors real-time metrics across multiple timeframes and analytical vectors.
A. Intermediate Structure (12H Trend)
• Function: Anchors the intraday analysis to the broader market structure using a 12-hour rolling window.
• Interpretation:
◦ Bullish (> +0.5%): Indicates a positive structural bias. Long setups align with the macro flow.
◦ Bearish (< -0.5%): Indicates structural weakness. Short setups are statistically favored.
◦ Neutral: Represents a ranging environment where the Confluence Score becomes the primary weighting factor.
B. Composite Confluence Score (Signal Confidence)
• Definition: A probability metric derived from the synchronization of Volatility (Impulse Core), Momentum (Ribbon), and Trend (Baseline).
• Grading Scale:
Strong Buy/Sell (> 7.0 / < 3.0): Indicates full alignment across all three vectors. Represents a "Prime Setup" eligible for standard position sizing.
Buy/Sell (5.0–7.0 / 3.0–5.0): Indicates a valid trend but with moderate volatility confirmation.
Neutral: Signals conflicting data (e.g., Bullish Momentum vs. Bearish Structure). Trading is not recommended ("No-Trade Zone").
C. Statistical Deviation Status (Mean Reversion)
• Logic: Utilizes Bollinger Band deviation principles to quantify how far price has stretched from the statistical mean (20 SMA).
• Alert States:
Over-Extended (> 2.0 SD): Warning that price is statistically likely to revert to the mean (Elastic Snap-back), even if the trend remains technically valid. New entries are discouraged in this zone.
Normal: Price is within standard distribution limits, suitable for trend-following entries.
D. Volatility Regime Classification
• Metric: Compares current ATR against a 100-period historical baseline to categorize the market state.
• Regimes:
Low Volatility (Lvl < 1.0): Market Compression. Often precedes volatility expansion events.
Mid Volatility (Lvl 1.0 - 1.5): Standard operating environment.
High Volatility (Lvl > 1.5): Elevated market stress. Risk parameters should be adjusted (e.g., reduced position size) to account for increased variance.
E. Performance Telemetry
• Function: Displays the historical reliability of the Trend Baseline for the current asset and timeframe.
• Operational Threshold: If the displayed Win Rate falls below 40%, it suggests the current market behavior is incoherent (choppy) and does not respect trend logic. In such cases, switching assets or timeframes is recommended.
Operational Protocols & Signal Decoding
Visual Interpretation Standards
• Laminar Flow (Trade Confirmation): A valid trend is visually confirmed when the 15-layer SMA Ribbon is fully expanded and parallel. This indicates distributed momentum across timeframes.
• Consolidation (No-Trade): If the ribbon appears twisted, knotted, or compressed, the market lacks a unified directional vector.
• Baseline Interaction: The Triple-Smoothed Baseline acts as a dynamic support/resistance filter. Long positions remain valid only while price sustains above this structure.
System Calibration (Settings)
• Adaptive Signal Filtering (Prev. Anti-Greed): Enabled by default. This logic automatically raises the required trend slope threshold following consecutive wins to mitigate behavioral bias.
• Impulse Sensitivity: Controls the reactivity of the Volatility Core. Higher settings capture faster moves but may introduce more noise.
⚙️ Chapter 6: System Configuration & Alert Guide
This section provides a complete breakdown of every adjustable setting within Impulse Reactor to assist you in tailoring the engine to your specific needs.
🌐 LANGUAGE SETTINGS (Localization)
◦ Select Language (Default: English):
Function: Instantly translates all chart labels, dashboard texts into your preferred language.
Supported: English, Korean, Chinese, Spanish
⚡ IMPULSE CORE SETTINGS (Volatility Engine)
◦ Deviation Lookback (Default: 30): The period used to calculate the standard deviation of volatility.
Role: Sets the baseline for normalizing momentum. Higher values make the core smoother but slower to react.
◦ Fast Pulse Length (Default: 10): The short-term ATR period.
Role: Detects rapid volatility expansion.
◦ Slow Pulse Length (Default: 30): The long-term ATR baseline.
Role: Establishes the background volatility level. The core signal is derived from the divergence between Fast and Slow pulses.
🎯 TP/SL SETTINGS (Risk Management)
◦ SL/TP Fibonacci (Default: 0.786 / 1.618): Selects the Fibonacci ratio used for risk calculation.
◦ SL/TP Multiplier (Default: 1.5 / 2): Applies a multiplier to the ATR-based bands.
Role: Expands or contracts the Take Profit and Stop Loss boxes. Increase these values for higher volatility assets (like Altcoins) to avoid premature stop-outs.
◦ ATR Length (Default: 14): The lookback period for calculating the Average True Range used in risk geometry.
◦ Use Soft Stop (Close Basis):
Role: If enabled, Stop Loss alerts only trigger if a candle closes beyond the invalidation level. This prevents being stopped out by wick manipulations.
🔊 RIBBON SETTINGS (Momentum Visualization)
◦ Show SMA Ribbon: Toggles the visibility of the 15-layer gradient ribbon.
◦ Ribbon Line Count (Default: 15): The number of SMA lines in the ribbon array.
◦ Ribbon Start Length (Default: 2) & Step (Default: 1): Defines the spread of the ribbon.
Role: Controls the "thickness" of the momentum density visualization. A wider step creates a broader ribbon, useful for higher timeframes.
📎 DISPLAY OPTIONS
◦ Show Entry Lines / TP/SL Box / Position Labels / S/R Levels / Dashboard: Toggles individual visual elements on the chart to reduce clutter.
◦ Show SAR+MACD Glow: Enables the secondary confirmation shapes (triangles/circles) above/below candles.
📈 TREND BASELINE (Structural Filter)
◦ Supertrend Factor (Default: 12) & ATR Period (Default: 90): Controls the sensitivity of the underlying Supertrend algorithm used for the baseline calculation.
◦ WMA Length (40) & EMA Length (14): The smoothing periods for the Triple-Smoothed Baseline.
◦ Min Trend Duration (Default: 10): The minimum number of bars the trend must be established before a signal is considered valid.
🧠 SMART EXIT (Dynamic Liquidity)
◦ Use Smart Exit: Enables the momentum exhaustion logic.
◦ Exit Threshold Score (Default: 3): The sensitivity level for triggering a Smart Exit. Lower values trigger earlier exits.
◦ Average Period (168) & Min Hold Bars (5): Defines the rolling window for momentum decay analysis and the minimum duration a trade must be held before Smart Exit logic activates.
🛡️ TRAILING STOP (Step)
◦ Use Trailing Stop: Activates the step-function trailing mechanism.
◦ Step 1 Activation % (0.5) & Offset % (0.5): The price must move 0.5% in your favor to arm the first trail level, which sets a stop 0.5% behind price.
◦ Step 2 Activation % (1) & Offset % (0.2): Once price moves 1%, the trail tightens to 0.2%, securing the position.
🌀 SAR & MACD SETTINGS (Secondary Confirmation)
◦ SAR Start/Increment/Max: Standard Parabolic SAR parameters.
◦ SAR Score Scaling (ATR): Adjusts how much weight the SAR signal has in the overall confluence score.
◦ MACD Fast/Slow/Signal: Standard MACD parameters used for the "Glow" signals.
🔄 ANTI-GREED LOGIC (Behavioral Bias)
◦ Strict Entry after Win: Enables the negative feedback loop.
◦ Strict Multiplier (Default: 1.1): Increases the entry difficulty by 10% after each win.
Role: Prevents overtrading and entering at the top of an extended trend.
🌍 HTF FILTER (Multi-Timeframe)
◦ Use Auto-Adaptive HTF Filter: Automatically selects a higher timeframe (e.g., 1H -> 4H) to filter signals.
◦ Bypass HTF on Steep Trigger: Allows an entry even against the HTF trend if the local momentum slope is exceptionally steep (catch powerful reversals).
📉 RSI PEAK & CHOPPINESS
◦ RSI Peak Exit (Instant): Triggers an immediate exit if a sharp RSI pivot (V-shape) is detected.
◦ Choppiness Filter: Suppresses signals if the Choppiness Index is above the threshold (Default: 60), indicating a flat market.
📐 SLOPE TRIGGER LOGIC
◦ Force Entry on Steep Slope: Overrides other filters if the price angle is extremely vertical (high velocity).
◦ Slope Sensitivity (1.5): The angle required to trigger this override.
⛔ FLAT MARKET FILTER (ADX & ATR)
◦ Use ADX Filter: Blocks signals if ADX is below the threshold (Default: 20), indicating no trend.
◦ Use ATR Flat Filter: Blocks signals if volatility drops below a critical level (dead market).
🔔 Alert Configuration Guide
Impulse Reactor is designed with a comprehensive suite of alert conditions, allowing you to automate your trading or receive real-time notifications for specific market events.
How to Set Up:
Click the "Alert" (Clock) icon in the TradingView toolbar.
Select "Impulse Reactor " from the Condition dropdown.
Choose one of the specific trigger conditions below:
🚀 Entry Signals (Trend Initiation)
Long Entry:
Trigger: Fires when a confirmed Bullish Setup is detected (Momentum + Volatility + Structure align).
Usage: Use this to enter new Long positions.
Short Entry:
Trigger: Fires when a confirmed Bearish Setup is detected.
Usage: Use this to enter new Short positions.
🎯 Profit Taking (Target Levels)
Long TP:
Trigger: Fires when price hits the calculated Take Profit level for a Long trade.
Usage: Automate partial or full profit taking.
Short TP:
Trigger: Fires when price hits the calculated Take Profit level for a Short trade.
Usage: Automate partial or full profit taking.
🛡️ Defensive Exits (Risk Management)
Smart Exit:
Trigger: Fires when the system detects momentum decay or statistical exhaustion (even if the trend hasn't fully reversed).
Usage: Recommended for tightening stops or closing positions early to preserve gains.
Overbought / Oversold:
Trigger: Fires when the ribbon extends into extreme zones.
Usage: Warning signal to prepare for a potential reversal or pullback.
💡 Secondary Confirmation (Confluence)
SAR+MACD Bullish:
Trigger: Fires when Parabolic SAR and MACD align bullishly with the main trend.
Usage: Ideal for Pyramiding (adding to an existing winning position).
SAR+MACD Bearish:
Trigger: Fires when Parabolic SAR and MACD align bearishly.
Usage: Ideal for adding to short positions.
⚠️ Chapter 7: Conclusion & Risk Disclosure
Methodological Synthesis
Impulse Reactor represents a shift from reactive price tracking to proactive energy analysis. By decomposing market activity into its atomic components — Volatility, Momentum, and Structure — and reconstructing them into a coherent decision model, the system aims to provide a quantitative framework for market engagement. It is designed not to predict the future, but to identify high-probability conditions where kinetic energy and trend structure align.
Disclaimer & Risk Warnings
◦ Educational Purpose Only
This indicator, including all associated code, documentation, and visual outputs, is provided strictly for educational and informational purposes. It does not constitute financial advice, investment recommendations, or a solicitation to buy or sell any financial instruments.
◦ No Guarantee of Performance
Past performance is not indicative of future results. All metrics displayed on the dashboard (including "Win Rate" and "P&L") are theoretical calculations based on historical data. These figures do not account for real-world trading factors such as slippage, liquidity gaps, spread costs, or broker commissions.
◦ High-Risk Warning
Trading cryptocurrencies, futures, and leveraged financial products involves a substantial risk of loss. The use of leverage can amplify both gains and losses. Users acknowledge that they are solely responsible for their trading decisions and should conduct independent due diligence before executing any trades.
◦ Software Limitations
The software is provided "as is" without warranty. Users should be aware that market data feeds on analysis platforms may experience latency or outages, which can affect signal generation accuracy.

Bli-Rik : Trend + HTF 34 + HTF RSI Rel + Stoch Filtersprovides you accurate buy and sell signals on 5 mins and 15 mins chart, mainly foe sensex

RSI MACD Proportional ComboThis indicator combines two of the most widely used momentum tools in the market:
RSI and MACD into a single proportional framework.
MACD values are normalized so they can be displayed together with RSI on the same 0–100 scale. This allows both signals to be compared directly and interpreted more intuitively.
In this structure, RSI’s 50 midline effectively functions like MACD’s zero line, helping traders quickly identify momentum shifts without needing to view separate panels or raw MACD values. The result is a clean, unified momentum indicator that simplifies trend direction, overbought/oversold conditions, and MACD-style crossovers within one combined visual tool.

White Crow**White Crow — cluster reversal signals + market structure**
> Indicator that helps you read market structure (pivots, trend, last extremes) and spot potential reversals through CCI/RSI signal clusters. This is *not* a standalone trading system and does not guarantee any result — it is a tool for filtering and confirming your own market ideas.
---
## 1. Concept
White Crow combines three core blocks:
1. **Pivots & market structure**
Automatically detects **local tops/bottoms** and derives a *Bullish / Bearish / Sideways* bias from them.
In the top-right corner you see a compact panel with current trend and **Last Bottom / Last Top** prices.
2. **Momentum & overbought/oversold zones**
Inside, the indicator uses:
* **CCI** with fixed levels `+100 / -100`;
* an optional **RSI filter** with overbought/oversold levels (`80 / 20`).
These generate basic *Buy / Close* signals.
3. **Cluster signals Buy X / CloseV**
The script tracks **clusters of signals inside a 4-bar window** and highlights rarer, “amplified” events:
* **Buy X** — cluster buy signal (multiple buy conditions in a row);
* **CloseV** — cluster signal for exit/reversal.
**Buy X and CloseV are the strongest and most reliable signals in this indicator** because they are based on repeated conditions rather than a single bar. They work **best on higher timeframes (1H–4H)**, where they reflect meaningful shifts in order flow instead of noise.
> ⚠️ Important: Buy X and CloseV are *only signals*. They must be used as **one of several confirmation factors** for your own view of market structure (support/resistance, trend, price action, volume, etc.), not as standalone reasons to enter or exit trades.
---
## 2. How it works
### 2.1. Pivots and trend detection
* The indicator builds a **zigzag-like structure**:
after a local high, once price retraces down by a given percentage (`pivotSigma`), a **Top** is marked;
after a local low, once price retraces up by the same percentage, a **Bottom** is marked.
* Using the sequence of recent tops and bottoms, the script determines the trend:
* *Bullish* — the last low is higher than the previous one (HL);
* *Bearish* — the last high is lower than the previous one (LH);
* otherwise — *Sideways*.
* The info table shows:
* **Market Trend** — Bullish / Bearish / Sideways;
* **Last Bottom / Last Top** with adaptive decimal precision (works for crypto, FX, stocks, etc.).
### 2.2. Base Buy / Close signals
* **Long condition (Buy):**
* `CCI < -100` (oversold),
* if RSI filter is enabled — `RSI < 20`.
* **Short/Exit condition (Close):**
* `CCI > +100` (overbought),
* if RSI filter is enabled — `RSI > 80`.
These conditions generate the regular **Buy** and **Close** labels on the chart.
### 2.3. Clusters: Buy X and CloseV
To reduce noise, the indicator evaluates not only the current bar, but also the **last 4 bars**:
* `buy_count` — how many times the long condition was true within the last 4 bars;
* `sell_count` — how many times the short condition was true within the last 4 bars.
Then:
* **Buy X** appears when:
* `buy_count ≥ 2` (conditions for Buy were met on at least 2 of the last 4 bars),
* the time filter between two Buy X signals is satisfied (`Min Bars Between Signals`).
* **CloseV** appears when:
* `sell_count ≥ 2`,
* the required number of bars has passed since the previous CloseV.
> ✅ This is why **Buy X / CloseV are stronger and more trustworthy than single Buy/Close signals**, especially on **1H–4H** timeframes: the market confirms the same overbought/oversold condition several times in a row.
### 2.4. Order Blocks
* When `Show Order Blocks` is enabled, the indicator highlights **impulsive candles** whose body exceeds a threshold based on ATR.
* Colored rectangles mark **potential order blocks** (areas where strong buying or selling previously occurred).
## 3. Inputs and customization
Inputs are grouped in TradingView-friendly categories.
### 3.1. Pivot Settings
* `Show Pivots` — enable/disable **Top / Bottom** markers.
* `Sigma (% retracement)` — pivot sensitivity (minimum retracement in % required to confirm a pivot).
* Colors for Top/Bottom — for visual tuning.
**Tip:**
On H1–H4 you can keep near-default values.
On lower timeframes, reduce `Sigma` if you want more detailed local structure.
### 3.2. CCI / RSI Settings
* `CCI Period` — CCI length (short by default for faster reaction).
* `Enable RSI Filter` / `RSI Period` — toggle and length for RSI filter.
* RSI levels are fixed at **20 / 80** to mark strong oversold/overbought zones.
**Usage:**
* For more conservative entries — keep the RSI filter enabled.
* For more frequent signals (e.g. scalping) — you can disable the RSI filter.
### 3.3. Order Blocks
* `Show Order Blocks` — display order block zones.
* `Block Threshold (ATR multiplier)` — how large a candle must be (vs ATR) to be considered significant.
### 3.4. Signals & Filters
* `Show Buy / Show Buy X / Show Close / Show CloseV` — choose which labels you want to see.
* `Enable Time Filter` — enable minimum spacing between amplified signals.
* `Min Bars Between Signals` — how many bars must pass between two Buy X or two CloseV signals.
**Tip:**
If you see too many amplified signals, increase `Min Bars Between Signals`.
If you want more activity, decrease it.
### 3.5. Alerts
* `Buy Alerts / Buy X Alerts / Close Alerts / CloseV Alerts` — choose which signal types should trigger alerts.
* `One Alert Per Bar` — when enabled, alerts are triggered only once per bar (recommended for H1–H4).
Alerts are generated via `alert()`, with messages that include signal type, ticker, timeframe and current price.
---
## 4. How to trade with White Crow
### 4.1. Recommended timeframes
* 📌 **Main focus: 1H–4H.**
On these timeframes:
* pivots and trend are more stable;
* CCI/RSI reflect meaningful swings;
* **Buy X / CloseV clusters** filter out a lot of intrabar noise.
You can still experiment on M1–M15, but expect more signals and more sensitivity to noise.
### 4.2. Reading the signals step by step
1. **Start with context**
* Look at **Market Trend / Last Bottom / Last Top** in the info panel.
* See where price is relative to these points: near resistance, near support, inside a range, etc.
2. **Identify zones of interest**
* Use pivots and order blocks as potential support/resistance areas.
* Wait for price to approach these zones.
3. **Watch the signals**
* **Buy** — early sign of local oversold conditions.
* **Buy X** — amplified cluster signal; more weight than a single Buy.
* **Close** — early warning of potential exhaustion in the current move.
* **CloseV** — amplified cluster exit/reversal signal.
4. **Practical approach**
* In a *Bullish* trend:
* focus on **Buy / Buy X** near bottoms and demand blocks;
* use **Close / CloseV** for partial profit-taking or tightening stops.
* In a *Bearish* trend:
* focus on **Close / CloseV** near tops and supply blocks;
* use **Buy / Buy X** mainly for countertrend scalps with strict risk control.
---
## 5. Important notes and disclaimer
1. **Buy X / CloseV are stronger — but not “magic” signals.**
They are statistically more meaningful than single Buy/Close signals because:
* they require multiple confirmations within a cluster;
* they are time-filtered.
However, **false signals are still possible**, especially in news spikes and low-liquidity conditions.
2. **Best performance on higher timeframes (1H–4H).**
Here, Buy X and CloseV usually reflect genuine shifts in supply/demand rather than micro noise.
3. **This is a confirmation tool, not a complete system.**
Pro Trading White Crow:
* does not manage risk;
* does not define position size or stop-loss;
* does not replace your own analysis.
Always use its signals as **one of several confluence factors** together with structure, trend, price action, volume, and your trading plan.
4. **Educational purpose only.**
This script and description are for educational and analytical purposes only.
They **do not constitute investment advice or a guarantee of profit**.
You are fully responsible for all trading decisions and risk management.
---
---
## White Crow — кластерные сигналы разворота + структура рынка
> Индикатор помогает читать рыночную структуру (пивоты, тренд, последние экстремумы) и находить потенциальные развороты через кластеры сигналов CCI/RSI. Это *не* готовая торговая система и *не* гарантия результата — а инструмент для фильтрации и подтверждения ваших собственных идей по рынку.
---
## 1. Концепция
White Crow объединяет три ключевых блока:
1. **Пивоты и структура рынка**
Автоматически находит **локальные вершины и впадины** и на их основе формирует трендовое смещение: *Bullish / Bearish / Sideways*.
В правом верхнем углу — компактная панель с текущим трендом и ценами **Last Bottom / Last Top**.
2. **Моментум и зоны перегрева**
Внутри используются:
* **CCI** с фиксированными уровнями `+100 / -100`;
* опциональный **фильтр RSI** с уровнями перепроданности/перекупленности (`20 / 80`).
По ним строятся базовые сигналы *Buy / Close*.
3. **Кластерные сигналы Buy X / CloseV**
Скрипт отслеживает **кластеры сигналов внутри окна в 4 бара** и выделяет более редкие, «усиленные» события:
* **Buy X** — кластерный сигнал покупки (несколько buy-условий подряд);
* **CloseV** — кластерный сигнал выхода/разворота.
Именно **Buy X и CloseV являются наиболее сильными и достоверными сигналами индикатора**, так как возникают при повторяющемся выполнении условий, а не на одном баре. Лучше всего они работают **на старших таймфреймах (1–4 часа)**, где отражают реальное смещение баланса спроса/предложения, а не рыночный шум.
> ⚠️ Важно: Buy X и CloseV — *это всего лишь сигналы*. Они должны использоваться **как один из факторов подтверждения** вашего видения структуры рынка (уровни, тренд, price action, объём и т.д.), а не как единственная причина для входа или выхода.
---
## 2. Как это работает
### 2.1. Пивоты и определение тренда
* Индикатор строит **структуру в стиле зигзага**:
после локального максимума, когда цена откатывает вниз на заданный процент (`pivotSigma`), отмечается **Top**;
после локального минимума, когда цена откатывает вверх на тот же процент, отмечается **Bottom**.
* По последовательности последних вершин и впадин определяется тренд:
* *Bullish* — последний минимум выше предыдущего (HL);
* *Bearish* — последний максимум ниже предыдущего (LH);
* иначе — *Sideways*.
* В информационной таблице отображаются:
* **Market Trend** — Bullish / Bearish / Sideways;
* **Last Bottom / Last Top** с адаптивным количеством знаков (подходит под крипту, форекс, акции и т.д.).
### 2.2. Базовые сигналы Buy / Close
* **Условие для Buy (лонг):**
* `CCI < -100` (зона перепроданности),
* при включённом фильтре — `RSI < 20`.
* **Условие для Close (шорт/выход):**
* `CCI > +100` (зона перекупленности),
* при включённом фильтре — `RSI > 80`.
По этим условиям индикатор рисует обычные метки **Buy** и **Close**.
### 2.3. Кластеры: Buy X и CloseV
Чтобы отсеять лишний шум, индикатор оценивает не только текущий бар, но и **4 последних бара**:
* `buy_count` — сколько раз условие на покупку выполнялось за последние 4 бара;
* `sell_count` — сколько раз условие на продажу/выход выполнялось за последние 4 бара.
Далее:
* **Buy X** появляется, когда:
* `buy_count ≥ 2` (минимум на 2 из 4 баров были условия для покупки),
* соблюдён фильтр по времени между усиленными сигналами (`Min Bars Between Signals`).
* **CloseV** появляется, когда:
* `sell_count ≥ 2`,
* прошло достаточно баров с момента предыдущего CloseV.
> ✅ Поэтому **Buy X и CloseV заметно сильнее и надёжнее одиночных Buy/Close**, особенно на **таймфреймах 1–4 часа**: рынок несколько раз подряд подтверждает один и тот же перегрев/разрядку момента.
### 2.4. Order Blocks
* При включённом `Show Order Blocks` индикатор выделяет **импульсные свечи**, чьё тело больше заданного множителя ATR.
* По таким свечам строятся цветные прямоугольники — **потенциальные блоки ордеров** (области поддержек/сопротивлений, где ранее проходил крупный объём).
---
## 3. Настройки и кастомизация
Настройки сгруппированы в привычные разделы TradingView.
### 3.1. Pivot Settings
* `Show Pivots` — включить/выключить метки **Top / Bottom**.
* `Sigma (% retracement)` — чувствительность к пивотам (минимальная глубина отката в процентах).
* Цвета Top/Bottom — визуальная настройка.
**Совет:**
На H1–H4 можно оставить значения близкие к стандартным.
На младших ТФ уменьшайте `Sigma`, если нужна более детальная структура.
### 3.2. CCI / RSI Settings
* `CCI Period` — период CCI (по умолчанию короткий, для более быстрой реакции).
* `Enable RSI Filter` / `RSI Period` — включение и длина RSI-фильтра.
* Уровни RSI фиксированы: **20 / 80**, выделяя сильную перепроданность/перекупленность.
**Использование:**
* Для более консервативной торговли — держите фильтр RSI включённым.
* Для более частых сигналов (скальпинг и т.п.) — можно фильтр отключить.
### 3.3. Order Blocks
* `Show Order Blocks` — отображение блоков ордеров.
* `Block Threshold (ATR multiplier)` — насколько большой должна быть свеча относительно ATR, чтобы считаться значимой.
### 3.4. Signals & Filters
* `Show Buy / Show Buy X / Show Close / Show CloseV` — выбор типов отображаемых меток.
* `Enable Time Filter` — включение минимального интервала между усиленными сигналами.
* `Min Bars Between Signals` — сколько баров должно пройти между двумя Buy X или двумя CloseV.
**Совет:**
Если усиленных сигналов слишком много — увеличьте `Min Bars Between Signals`.
Если хотите больше активности — уменьшите это значение.
### 3.5. Alerts
* `Buy Alerts / Buy X Alerts / Close Alerts / CloseV Alerts` — выбор типов сигналов для алертов.
* `One Alert Per Bar` — при включении алерты отправляются один раз на бар (рекомендуется для H1–H4).
Алерты формируются через `alert()` с сообщением, включающим тип сигнала, тикер, таймфрейм и текущую цену.
---
## 4. Как использовать White Crow в торговле
### 4.1. Рекомендуемые таймфреймы
* 📌 **Основной фокус: 1–4 часа.**
На этих ТФ:
* структура по пивотам и тренд более стабильны;
* CCI/RSI отражают существенные ценовые колебания;
* кластеры **Buy X / CloseV** лучше отсеивают шум.
На M1–M15 индикатор тоже можно применять, но нужно быть готовым к большему количеству сигналов и чувствительности к микродвижениям.
### 4.2. Пошаговое чтение сигналов
1. **Начните с контекста**
* Посмотрите на **Market Trend / Last Bottom / Last Top** в панели.
* Определите, где находитесь относительно этих уровней: у сопротивления, у поддержки, внутри диапазона и т.п.
2. **Найдите зоны интереса**
* Используйте пивоты и order blocks как потенциальные области спроса/предложения.
* Ждите подхода цены к этим зонам.
3. **Отслеживайте сигналы**
* **Buy** — ранний признак локальной перепроданности.
* **Buy X** — усиленный кластерный сигнал, более значимый, чем одиночный Buy.
* **Close** — ранний сигнал возможного ослабления текущего движения.
* **CloseV** — усиленный кластерный сигнал выхода/разворота.
4. **Практическое применение**
* В *бычьем* тренде:
* фокус на **Buy / Buy X** возле впадин и зон спроса;
* **Close / CloseV** использовать для частичной фиксации и подтягивания стопа.
* В *медвежьем* тренде:
* фокус на **Close / CloseV** возле вершин и зон предложения;
* **Buy / Buy X** — для аккуратных контртрендовых входов с жестким риском.
---
## 5. Важные замечания и дисклеймер
1. **Buy X / CloseV сильнее, но не «волшебные» сигналы.**
Они статистически более значимы, чем одиночные Buy/Close, потому что:
* требуют нескольких подтверждений в кластере;
* фильтруются по времени.
Однако **ложные срабатывания всё равно возможны**, особенно на новостях и в условиях низкой ликвидности.
2. **Оптимальная область применения — старшие ТФ (1–4 часа).**
Здесь Buy X и CloseV обычно отражают реальное изменение баланса спроса/предложения, а не шум.
3. **Это инструмент подтверждения, а не полноценная система.**
Pro Trading White Crow:
* не управляет рисками;
* не считает размер позиции и уровень стоп-лосса;
* не заменяет ваше собственное видение рынка.
Всегда используйте его сигналы **как один из факторов согласованности** вместе со структурой, трендом, price action, объёмом и персональным торговым планом.
4. **Образовательный характер.**
Скрипт и описание предназначены для обучения и анализа графиков.
Они **не являются инвестиционной рекомендацией и не гарантируют прибыль**.
Вы самостоятельно принимаете все торговые решения и несёте полную ответственность за риск.
---

Relative Strength Index w/ BandsStandard RSI but with the option to add a shaded zone around the Upper and Lower Bands, based on an offset value.
Value/level of shaded zones need to be modified separately in the Settings from the Upper and Lower Band values.

RSI Profile [Kodexius]RSI Profile is an advanced technical indicator that turns the classic RSI into a distribution profile instead of a single oscillating line. Rather than only showing where the RSI is at the current bar, it displays where the RSI has spent most of its time or most of its volume over a user defined lookback period.
The script builds a histogram of RSI values between 0 and 100, splits that range into configurable bins, and then projects the result to the right side of the chart. This gives you a clear visual representation of the RSI structure, including the Point of Control (POC), the Value Area High (VAH), and the Value Area Low (VAL). The POC marks the RSI level with the highest activity, while VAH and VAL bracket the percentage based value area around it.
By combining standard RSI, a distribution profile, and value area logic, this tool lets you study RSI behavior statistically instead of only bar by bar. You can immediately see whether the current RSI reading is located inside the dominant zone, extended above it, or depressed below it, and whether the recent regime has been biased toward overbought, oversold, or neutral territory. This is particularly useful for swing traders, mean reversion systems, and anyone who wants to integrate RSI context into a more profile oriented workflow.
🔹 Features
1. RSI-Based Distribution Profile
-Builds a histogram of RSI values between 0 and 100.
-The RSI range is divided into a user-defined number of bins (e.g., 30 bins).
-Each bin represents a band of RSI values, such as 0–3.33, 3.33–6.66, ..., 96.66–100.
-For each bar in the lookback period, the script:
-Finds which bin the RSI value belongs to
Adds either:
-1.0 → if using time/frequency
-volume → if using volume-weighted RSI distribution
This creates a clear profile of where RSI has been concentrated over the chosen lookback window.
2. Time / Volume Weighting Mode
Under Profile Settings, you can choose:
-Weight by Volume = false
→ Profile is built using time spent at each RSI level (frequency).
-Weight by Volume = true
→ Profile is built using volume traded at each RSI level.
This flexibility allows you to decide whether you want:
-A pure momentum structure (time spent at each RSI)
-Or a participation-weighted structure (where higher-volume zones are emphasized)
3. Configurable Lookback & Resolution
-Profile Lookback: number of historical bars to analyze.
-Number of Bins: controls the resolution of the histogram:
Fewer bins → smoother, fewer gaps
More bins → more detail, but potentially more visual sparsity
-Profile Width (Bars): defines how wide the histogram extends into the future (visually), converted into time using average bar duration.
This provides a balance between performance, clarity, and visual density.
4. Value Area, POC, VAH, VAL
The script computes:
-POC (Point of Control)
→ The RSI bin with the highest total value (time or volume).
-Value Area (VA)
→ The range of RSI bins that contain a user-specified percentage of total activity (e.g., 70%).
-VAH & VAL
→ Upper and lower RSI boundaries of this Value Area.
These are then drawn as horizontal lines and labeled:
-POC line and label
-VAH line and label
-VAL line and label
This gives you a profile-style view similar to classical volume profile, but entirely on the RSI axis.
5. Color Coding & Visual Design
The histogram bars (boxes) are colored using a smart scheme:
-Below 30 RSI → Oversold zone, uses the Oversold Color (default: green).
-Above 70 RSI → Overbought zone, uses the Overbought Color (default: red).
-Between 30 and 70 RSI → Neutral zone, uses a gradient between:
A soft blue at lower mid levels
A soft orange at higher mid levels
Additional styling:
-POC bin is highlighted in bright yellow.
-Bins inside the Value Area → lower transparency (more solid).
-Bins outside the Value Area → higher transparency (faded).
This makes it easy to visually distinguish:
-Core RSI activity (VA)
-Extremes (oversold/overbought)
-The single dominant zone (POC)
🔹 Calculations
This section summarizes the core logic behind the script and highlights the main building blocks that power the profile.
1. Profile Structure and Bin Initialization
A custom Profile type groups together configuration, bins and drawing objects. During initialization, the script splits the 0 to 100 RSI range into evenly spaced bins, each represented by a Bin record:
method initBins(Profile p) =>
p.bins := array.new()
float step = 100.0 / p.binCount
for i = 0 to p.binCount - 1
float low = i * step
float high = (i + 1) * step
p.bins.push(Bin.new(low, high, 0.0, box(na)))
2. Filling the Profile Over the Lookback Window
On the last bar, the script clears previous drawings and walks backward through the selected lookback window. For each historical bar, it reads the RSI and volume series and feeds them into the profile:
if barstate.islast
myProfile.reset()
int start = math.max(0, bar_index - lookback)
int end = bar_index
for i = 0 to (end - start)
float r = rsi
float v = volume
if not na(r)
myProfile.add(r, v)
The add method converts each RSI value into a bin index and accumulates either a frequency count or the bar volume, depending on the chosen mode:
method add(Profile p, float rsiValue, float volumeValue) =>
int idx = int(rsiValue / (100.0 / p.binCount))
if idx >= p.binCount
idx := p.binCount - 1
if idx < 0
idx := 0
Bin targetBin = p.bins.get(idx)
float addedValue = p.useVolume ? volumeValue : 1.0
targetBin.value += addedValue
3. Finding POC and Building the Value Area
Inside the draw method, the script first scans all bins to determine the maximum value and the total sum. The bin with the highest value becomes the POC. The value area is then constructed by expanding from that center bin until the desired percentage of total activity is covered:
for in p.bins
totalVal += b.value
if b.value > maxVal
maxVal := b.value
pocIdx := i
float vaTarget = totalVal * (p.vaPercent / 100.0)
float currentVaVol = maxVal
int upIdx = pocIdx
int downIdx = pocIdx
while currentVaVol < vaTarget
float upVol = (upIdx < p.binCount - 1) ? p.bins.get(upIdx + 1).value : 0.0
float downVol = (downIdx > 0) ? p.bins.get(downIdx - 1).value : 0.0
if upVol == 0 and downVol == 0
break
if upVol >= downVol
upIdx += 1
currentVaVol += upVol
else
downIdx -= 1
currentVaVol += downVol

QFT MTF Range DetectorQFT MTF Range Detector — QuantumFlowTrader
Description:
The QFT MTF Range Detector is a multi-timeframe (MTF) tool designed to identify consolidation zones or ranging conditions across multiple intraday timeframes — from 1 minute up to 4 hours. This indicator is optimized for high-frequency trading environments such as scalping and day trading.
How it works:
For each selected timeframe, the indicator evaluates five key technical conditions:
- Low ADX (less than 17) – suggesting weak trend strength.
- Range width within a specific normalized threshold.
- Normalized ATR (volatility filter) in a defined range.
- RSI near the neutral zone (40–60) with low volatility.
- Price proximity to the mid-range (consolidation center).
Each condition contributes a score. If at least 3 out of 5 conditions are met, that timeframe is considered to be in a range (consolidation).
Visual output:
A compact table is displayed on the chart showing all selected timeframes:
Black box = Timeframe is in a range (consolidation).
Purple box = Not in a range (likely trending or volatile).
Timeframes are labeled (e.g., "4H", "15M") for clarity.
Customization:
Choose display corner (top/bottom, left/right).
Enable or disable table borders.
Set custom colors for range and non-range signals.
Use case:
Traders can quickly assess which timeframes are in a range, helping them:
Avoid choppy markets,
Time entries and exits better,
Confirm multi-timeframe alignment.
Note: This is not a buy/sell signal indicator. It is a market condition filter to enhance decision-making.

Valdex RSI con Filtro MA (Simplificado)🇺🇸 VALDEX H-MA: Indicator Description
VALDEX H-MA: Centered RSI with Exponential Filter
This script, VALDEX H-MA, offers a highly streamlined, zero-centered Relative Strength Index (RSI) for impulse and cycle analysis, complemented by a fast Exponential Moving Average (EMA) filter.
It simplifies the classic RSI by centering it at zero, making it easier to read momentum shifts and overbought/oversold conditions relative to the central equilibrium.
Key Features and Customization
Zero-Centered RSI: The RSI is normalized to oscillate between approximately -50 and +50 (instead of 0 to 100), with the key neutral point located exactly at 0. This immediate visual clarity aids in assessing momentum balance.
RSI Length Flexibility: The primary RSI line (RSI Base) can be customized for different trading styles:
Set the Length RSI to 7 for a smoother, faster RSI suitable for scalping and capturing short-term reversals.
Set the Length RSI to 14 for a more standard yet still highly smoothed output, providing a reliable measure of trend momentum (note: this centered version remains smoother than the original 0-100 RSI).
MA Filter (Exponential Moving Average): An adjustable EMA is included as a powerful filter. This MA can be used in two primary ways:
Entry/Exit Signals: Generate trading signals when the RSI Base crosses above or below the MA Filter.
Cycle Smoothing: Use the MA to smooth the short-term cycles of the RSI Base, providing a clearer indication of the underlying momentum direction.
⚙️ Technical Description
The core of the VALDEX H-MA indicator relies on the following technical calculations:
RSI Centralization: The RSI Base line is derived from the standard Relative Strength Index (RSI) but is mathematically shifted to be zero-centered:
RSICentered=RSI(0−100)−50
This transformation ensures that the equilibrium point is clearly visible at the zero line.
MA Filter Calculation: The MA Filter is an Exponential Moving Average (EMA) applied directly to the RSICentered output:
MAFilter=EMA(RSICentered,Length MA)
The EMA is used for its responsiveness and low lag, making it an effective tool for filtering noise and confirming short-term momentum shifts.
Reference Lines: The indicator includes fixed reference lines at 30 (Overbought), 0 (Equilibrium), and -30 (Oversold) to quickly judge extreme conditions within the centered scale.

Multi-Filter & RSI Overheat Analyzer (Invite Only)🚀 Multi-Filter & RSI Overheat Analyzer (Invite Only)
The Trend-RSI Pro is an advanced, multi-layered analysis tool designed for invite-only subscribers. Its primary function is to provide an instant, high-conviction visual filter of current market conditions by combining three essential technical analyses: EMA trend direction, ADX trend strength, and RSI overbought/oversold momentum.
💡 Key Features and Analysis Logic
This indicator simplifies complex market structure analysis by using a dynamic Background Color filter. The color instantly tells the user the dominant market state, eliminating the need to manually check multiple windows.
The background turns Teal when the Exponential Moving Averages (EMA) are in a strong Bullish Alignment (Short > Medium > Long) and the ADX value exceeds the user-defined Strength Threshold (default 25.0), confirming a Strong Uptrend. Conversely, the background turns Red when the EMAs are in a strong Bearish Alignment (Short < Medium < Long) and the ADX confirms a Strong Downtrend. Any other combination of EMA alignment or a weak ADX reading results in a Gray background, which alerts the user to a Ranging, Weak, or Transitional Market where caution is advised.
To complement the trend analysis, the indicator features RSI Overheat Alert Icons to preemptively analyze potential trend exhaustion. When the Relative Strength Index (RSI) enters the Overbought zone (default >= 70.0), a Red Triangle Down appears above the price bar, warning of potential selling pressure. Conversely, when the RSI enters the Oversold zone (default <= 30.0), a Green Triangle Up appears below the price bar, suggesting potential buying interest.
For users who wish to confirm the underlying components, the indicator also plots the three EMA Lines (Short, Medium, Long) directly on the chart, and the raw ADX Value is plotted in a separate pane, allowing for detailed tracking of strength changes over time. All key parameters, including EMA periods, ADX thresholds, and RSI limits, are fully customizable in the settings.
⚠️ Disclaimer and Usage Guideline
This tool is strictly an analytical aid and not a trading signal or financial advice. Users should utilize the Background Color as their primary context filter, only seeking trades aligned with the indicated strong trend color. The RSI alerts serve as timely warnings for potential short-term reversals within a larger trend. Trading carries substantial risk, and this indicator must always be combined with the user's independent analysis and robust risk management strategies.

UpDown RSI+Divergence [DivineTrade]Описание (RU)
English version below
Этот индикатор собирает ключевую информацию по RSI и дивергенциям сразу на нескольких таймфреймах и выводит её в компактную таблицу прямо на графике. Он рассчитывает RSI и дивергенции внутри каждого таймфрейма отдельно, поэтому данные остаются точными и одинаковыми вне зависимости от того, какой ТФ у вас открыт.
Индикатор показывает систему из семи таймфреймов: 1m, 5m, 15m, 1h, 4h, 1d, 1w.
Для каждого отображается:
• RSI значение с цветовой маркировкой зон
красный — перегрев выше 83
желтый — активный рост от 70 до 83
серый — нейтральная зона 30–70
зелёный — перепроданность ниже 30
• Наличие дивергенции RSI:
LONG — бычья дивергенция
SHORT — медвежья дивергенция
NaN — дивергенции нет
Дивергенции используются подтверждённые, на основе пивотов цены и RSI. Это позволяет исключать случайный шум и делать сигналы более надёжными.
Индикатор подходит для тех, кто использует анализ RSI, торгует по откатам, разворотам или комбинирует младшие ТФ с более старшими. Таблица обновляется в реальном времени и позволяет быстро понять общую картину по рынку и увидеть, где формируется слабость или сила тренда.
_____________________________________________________________________
Description (EN)
This indicator collects key RSI and divergence data across multiple timeframes and displays it in a compact on-chart panel. RSI and divergence calculations are performed within each timeframe independently, ensuring accurate and consistent results regardless of which timeframe you have open on the chart.
The indicator monitors seven timeframes: 1m, 5m, 15m, 1h, 4h, 1d, 1w.
For each timeframe it displays:
• RSI value with color-coded zones:
red — overbought above 83
yellow — rising momentum between 70 and 83
gray — neutral range 30–70
green — oversold below 30
• RSI divergence signal:
LONG — bullish divergence
SHORT — bearish divergence
NaN — no divergence detected
Divergences are based on confirmed price and RSI pivots, which helps remove noise and makes the signals more reliable.
This tool is useful for traders who rely on RSI analysis, trade reversals or pullbacks, or want to monitor momentum alignment across different timeframes. The panel updates in real time and provides a quick view of market strength, weakness, and emerging divergence opportunities across all major time horizons.
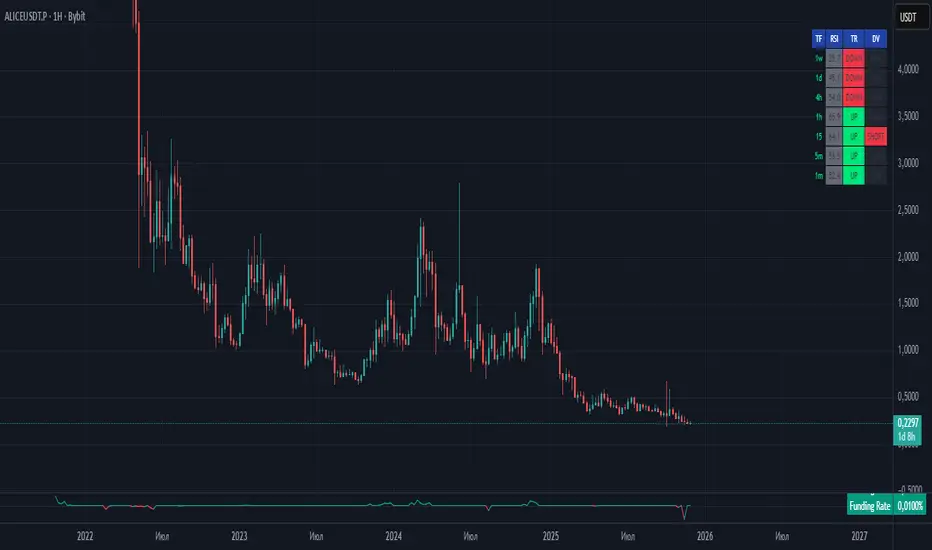
FTPM - Institutional Trend Pressure Suite @darshaksscThis indicator provides an informational view of market trend pressure using fractal-based momentum events, smoothed pressure calculations, higher timeframe confirmation, and divergence analysis. It does not produce buy or sell signals. Instead, it presents market context to help traders interpret trend conditions in a structured and data-driven way.
The indicator includes the following components:
1). Non-repainting Trend Pressure Engine
The pressure line is derived from confirmed fractal events, body-to-range ratios, displacement strength, and a controlled decay factor. The value is normalized to a 0 to 100 scale. A rising pressure value suggests increasing trend strength, while a declining value indicates weakening strength. This is informational only.
2). Pressure Shifts
The tool highlights transitions where pressure crosses above or below key thresholds. These labels do not represent entries or exits, but simply indicate contextual changes in momentum.
3). Higher Timeframe Pressure Confirmation
Users can compare current timeframe pressure to a selected higher timeframe. When both pressures align in similar regions, it may indicate agreement in broader market structure. This feature is informational only and does not generate trading signals.
4). Divergence Detection
Identifies confirmed bullish or bearish divergences between price pivots and pressure pivots. Divergences are simply analytical tools and should not be interpreted as actionable trading signals.
5). Institutional Dashboard
A multi-line dashboard summarizes current pressure, regime classification, higher timeframe regime, pressure direction, divergence status, and alignment conditions. The dashboard is informational only. No part of the dashboard should be interpreted as a trade instruction.
6). Dashboard Size Selector
Users may switch between Full, Medium, or Thin dashboard layouts to match their screen preferences. This affects only display, not indicator logic.
Important Notes
This indicator does not forecast future price movement.
It does not generate buy, sell, long, or short signals.
It does not guarantee profitable outcomes.
It is intended purely for visual analysis and market context.
All information is derived from confirmed historical data.
No part of this script is designed to automate trading decisions.
This tool is suitable for traders who want a clear, non-repainting visualization of pressure conditions and structural behavior without violating TradingView House Rules.
======================================================================
HOW TO USE
The indicator helps traders observe whether pressure is increasing or decreasing, whether higher timeframe conditions agree with the current chart, and whether divergences are present. All outputs are informational and should be combined with the user's preferred strategy or manual analysis. The indicator is not intended to signal trades or provide recommendations.
======================================================================
DISCLAIMERS
This indicator is for educational and informational purposes only.
It does not constitute financial advice.
It does not provide buy, sell, long, or short signals.
It does not predict future price movement.
Past performance does not guarantee future results.
======================================================================

Ultimate RSI [captainua]Ultimate RSI
Overview
This indicator combines multiple RSI calculations with volume analysis, divergence detection, and trend filtering to provide a comprehensive RSI-based trading system. The script calculates RSI using three different periods (6, 14, 24) and applies various smoothing methods to reduce noise while maintaining responsiveness. The combination of these features creates a multi-layered confirmation system that reduces false signals by requiring alignment across multiple indicators and timeframes.
The script includes optimized configuration presets for instant setup: Scalping, Day Trading, Swing Trading, and Position Trading. Simply select a preset to instantly configure all settings for your trading style, or use Custom mode for full manual control. All settings include automatic input validation to prevent configuration errors and ensure optimal performance.
Configuration Presets
The script includes preset configurations optimized for different trading styles, allowing you to instantly configure the indicator for your preferred trading approach. Simply select a preset from the "Configuration Preset" dropdown menu:
- Scalping: Optimized for fast-paced trading with shorter RSI periods (4, 7, 9) and minimal smoothing. Noise reduction is automatically disabled, and momentum confirmation is disabled to allow faster signal generation. Designed for quick entries and exits in volatile markets.
- Day Trading: Balanced configuration for intraday trading with moderate RSI periods (6, 9, 14) and light smoothing. Momentum confirmation is enabled for better signal quality. Ideal for day trading strategies requiring timely but accurate signals.
- Swing Trading: Configured for medium-term positions with standard RSI periods (14, 14, 21) and moderate smoothing. Provides smoother signals suitable for swing trading timeframes. All noise reduction features remain active.
- Position Trading: Optimized for longer-term trades with extended RSI periods (24, 21, 28) and heavier smoothing. Filters are configured for highest-quality signals. Best for position traders holding trades over multiple days or weeks.
- Custom: Full manual control over all settings. All input parameters are available for complete customization. This is the default mode and maintains full backward compatibility with previous versions.
When a preset is selected, it automatically adjusts RSI periods, smoothing lengths, and filter settings to match the trading style. The preset configurations ensure optimal settings are applied instantly, eliminating the need for manual configuration. All settings can still be manually overridden if needed, providing flexibility while maintaining ease of use.
Input Validation and Error Prevention
The script includes comprehensive input validation to prevent configuration errors:
- Cross-Input Validation: Smoothing lengths are automatically validated to ensure they are always less than their corresponding RSI period length. If you set a smoothing length greater than or equal to the RSI length, the script automatically adjusts it to (RSI Length - 1). This prevents logical errors and ensures valid configurations.
- Input Range Validation: All numeric inputs have minimum and maximum value constraints enforced by TradingView's input system, preventing invalid parameter values.
- Smart Defaults: Preset configurations use validated default values that are tested and optimized for each trading style. When switching between presets, all related settings are automatically updated to maintain consistency.
Core Calculations
Multi-Period RSI:
The script calculates RSI using the standard Wilder's RSI formula: RSI = 100 - (100 / (1 + RS)), where RS = Average Gain / Average Loss over the specified period. Three separate RSI calculations run simultaneously:
- RSI(6): Uses 6-period lookback for high sensitivity to recent price changes, useful for scalping and early signal detection
- RSI(14): Standard 14-period RSI for balanced analysis, the most commonly used RSI period
- RSI(24): Longer 24-period RSI for trend confirmation, provides smoother signals with less noise
Each RSI can be smoothed using EMA, SMA, RMA (Wilder's smoothing), WMA, or Zero-Lag smoothing. Zero-Lag smoothing uses the formula: ZL-RSI = RSI + (RSI - RSI ) to reduce lag while maintaining signal quality. You can apply individual smoothing lengths to each RSI period, or use global smoothing where all three RSIs share the same smoothing length.
Dynamic Overbought/Oversold Thresholds:
Static thresholds (default 70/30) are adjusted based on market volatility using ATR. The formula: Dynamic OB = Base OB + (ATR × Volatility Multiplier × Base Percentage / 100), Dynamic OS = Base OS - (ATR × Volatility Multiplier × Base Percentage / 100). This adapts to volatile markets where traditional 70/30 levels may be too restrictive. During high volatility, the dynamic thresholds widen, and during low volatility, they narrow. The thresholds are clamped between 0-100 to remain within RSI bounds. The ATR is cached for performance optimization, updating on confirmed bars and real-time bars.
Adaptive RSI Calculation:
An adaptive RSI adjusts the standard RSI(14) based on current volatility relative to average volatility. The calculation: Adaptive Factor = (Current ATR / SMA of ATR over 20 periods) × Volatility Multiplier. If SMA of ATR is zero (edge case), the adaptive factor defaults to 0. The adaptive RSI = Base RSI × (1 + Adaptive Factor), clamped to 0-100. This makes the indicator more responsive during high volatility periods when traditional RSI may lag. The adaptive RSI is used for signal generation (buy/sell signals) but is not plotted on the chart.
Overbought/Oversold Fill Zones:
The script provides visual fill zones between the RSI line and the threshold lines when RSI is in overbought or oversold territory. The fill logic uses inclusive conditions: fills are shown when RSI is currently in the zone OR was in the zone on the previous bar. This ensures complete coverage of entry and exit boundaries. A minimum gap of 0.1 RSI points is maintained between the RSI plot and threshold line to ensure reliable polygon rendering in TradingView. The fill uses invisible plots at the threshold levels and the RSI value, with the fill color applied between them. You can select which RSI (6, 14, or 24) to use for the fill zones.
Divergence Detection
Regular Divergence:
Bullish divergence: Price makes a lower low (current low < lowest low from previous lookback period) while RSI makes a higher low (current RSI > lowest RSI from previous lookback period). Bearish divergence: Price makes a higher high (current high > highest high from previous lookback period) while RSI makes a lower high (current RSI < highest RSI from previous lookback period). The script compares current price/RSI values to the lowest/highest values from the previous lookback period using ta.lowest() and ta.highest() functions with index to reference the previous period's extreme.
Pivot-Based Divergence:
An enhanced divergence detection method that uses actual pivot points instead of simple lowest/highest comparisons. This provides more accurate divergence detection by identifying significant pivot lows/highs in both price and RSI. The pivot-based method uses a tolerance-based approach with configurable constants: 1% tolerance for price comparisons (priceTolerancePercent = 0.01) and 1.0 RSI point absolute tolerance for RSI comparisons (pivotTolerance = 1.0). Minimum divergence threshold is 1.0 RSI point (minDivergenceThreshold = 1.0). It looks for two recent pivot points and compares them: for bullish divergence, price makes a lower low (at least 1% lower) while RSI makes a higher low (at least 1.0 point higher). This method reduces false divergences by requiring actual pivot points rather than just any low/high within a period. When enabled, pivot-based divergence replaces the traditional method for more accurate signal generation.
Strong Divergence:
Regular divergence is confirmed by an engulfing candle pattern. Bullish engulfing requires: (1) Previous candle is bearish (close < open ), (2) Current candle is bullish (close > open), (3) Current close > previous open, (4) Current open < previous close. Bearish engulfing is the inverse: previous bullish, current bearish, current close < previous open, current open > previous close. Strong divergence signals are marked with visual indicators (🐂 for bullish, 🐻 for bearish) and have separate alert conditions.
Hidden Divergence:
Continuation patterns that signal trend continuation rather than reversal. Bullish hidden divergence: Price makes a higher low (current low > lowest low from previous period) but RSI makes a lower low (current RSI < lowest RSI from previous period). Bearish hidden divergence: Price makes a lower high (current high < highest high from previous period) but RSI makes a higher high (current RSI > highest RSI from previous period). These patterns indicate the trend is likely to continue in the current direction.
Volume Confirmation System
Volume threshold filtering requires current volume to exceed the volume SMA multiplied by the threshold factor. The formula: Volume Confirmed = Volume > (Volume SMA × Threshold). If the threshold is set to 0.1 or lower, volume confirmation is effectively disabled (always returns true). This allows you to use the indicator without volume filtering if desired.
Volume Climax is detected when volume exceeds: Volume SMA + (Volume StdDev × Multiplier). This indicates potential capitulation moments where extreme volume accompanies price movements. Volume Dry-Up is detected when volume falls below: Volume SMA - (Volume StdDev × Multiplier), indicating low participation periods that may produce unreliable signals. The volume SMA is cached for performance, updating on confirmed and real-time bars.
Multi-RSI Synergy
The script generates signals when multiple RSI periods align in overbought or oversold zones. This creates a confirmation system that reduces false signals. In "ALL" mode, all three RSIs (6, 14, 24) must be simultaneously above the overbought threshold OR all three must be below the oversold threshold. In "2-of-3" mode, any two of the three RSIs must align in the same direction. The script counts how many RSIs are in each zone: twoOfThreeOB = ((rsi6OB ? 1 : 0) + (rsi14OB ? 1 : 0) + (rsi24OB ? 1 : 0)) >= 2.
Synergy signals require: (1) Multi-RSI alignment (ALL or 2-of-3), (2) Volume confirmation, (3) Reset condition satisfied (enough bars since last synergy signal), (4) Additional filters passed (RSI50, Trend, ADX, Volume Dry-Up avoidance). Separate reset conditions track buy and sell signals independently. The reset condition uses ta.barssince() to count bars since the last trigger, returning true if the condition never occurred (allowing first signal) or if enough bars have passed.
Regression Forecasting
The script uses historical RSI values to forecast future RSI direction using four methods. The forecast horizon is configurable (1-50 bars ahead). Historical data is collected into an array, and regression coefficients are calculated based on the selected method.
Linear Regression: Calculates the least-squares fit line (y = mx + b) through the last N RSI values. The calculation: meanX = sumX / horizon, meanY = sumY / horizon, denominator = sumX² - horizon × meanX², m = (sumXY - horizon × meanX × meanY) / denominator, b = meanY - m × meanX. The forecast projects this line forward: forecast = b + m × i for i = 1 to horizon.
Polynomial Regression: Fits a quadratic curve (y = ax² + bx + c) to capture non-linear trends. The system of equations is solved using Cramer's rule with a 3×3 determinant. If the determinant is too small (< 0.0001), the system falls back to linear regression. Coefficients are calculated by solving: n×c + sumX×b + sumX²×a = sumY, sumX×c + sumX²×b + sumX³×a = sumXY, sumX²×c + sumX³×b + sumX⁴×a = sumX²Y. Note: Due to the O(n³) computational complexity of polynomial regression, the forecast horizon is automatically limited to a maximum of 20 bars when using polynomial regression to maintain optimal performance. If you set a horizon greater than 20 bars with polynomial regression, it will be automatically capped at 20 bars.
Exponential Smoothing: Applies exponential smoothing with adaptive alpha = 2/(horizon+1). The smoothing iterates from oldest to newest value: smoothed = alpha × series + (1 - alpha) × smoothed. Trend is calculated by comparing current smoothed value to an earlier smoothed value (at 60% of horizon): trend = (smoothed - earlierSmoothed) / (horizon - earlierIdx). Forecast: forecast = base + trend × i.
Moving Average: Uses the difference between short MA (horizon/2) and long MA (horizon) to estimate trend direction. Trend = (maShort - maLong) / (longLen - shortLen). Forecast: forecast = maShort + trend × i.
Confidence bands are calculated using RMSE (Root Mean Squared Error) of historical forecast accuracy. The error calculation compares historical values with forecast values: RMSE = sqrt(sumSquaredError / count). If insufficient data exists, it falls back to calculating standard deviation of recent RSI values. Confidence bands = forecast ± (RMSE × confidenceLevel). All forecast values and confidence bands are clamped to 0-100 to remain within RSI bounds. The regression functions include comprehensive safety checks: horizon validation (must not exceed array size), empty array handling, edge case handling for horizon=1 scenarios, division-by-zero protection, and bounds checking for all array access operations to prevent runtime errors.
Strong Top/Bottom Detection
Strong buy signals require three conditions: (1) RSI is at its lowest point within the bottom period: rsiVal <= ta.lowest(rsiVal, bottomPeriod), (2) RSI is below the oversold threshold minus a buffer: rsiVal < (oversoldThreshold - rsiTopBottomBuffer), where rsiTopBottomBuffer = 2.0 RSI points, (3) The absolute difference between current RSI and the lowest RSI exceeds the threshold value: abs(rsiVal - ta.lowest(rsiVal, bottomPeriod)) > threshold. This indicates a bounce from extreme levels with sufficient distance from the absolute low.
Strong sell signals use the inverse logic: RSI at highest point, above overbought threshold + rsiTopBottomBuffer (2.0 RSI points), and difference from highest exceeds threshold. Both signals also require: volume confirmation, reset condition satisfied (separate reset for buy vs sell), and all additional filters passed (RSI50, Trend, ADX, Volume Dry-Up avoidance).
The reset condition uses separate logic for buy and sell: resetCondBuy checks bars since isRSIAtBottom, resetCondSell checks bars since isRSIAtTop. This ensures buy signals reset based on bottom conditions and sell signals reset based on top conditions, preventing incorrect signal blocking.
Filtering System
RSI(50) Filter: Only allows buy signals when RSI(14) > 50 (bullish momentum) and sell signals when RSI(14) < 50 (bearish momentum). This filter ensures you're buying in uptrends and selling in downtrends from a momentum perspective. The filter is optional and can be disabled. Recommended to enable for noise reduction.
Trend Filter: Uses a long-term EMA (default 200) to determine trend direction. Buy signals require price above EMA, sell signals require price below EMA. The EMA slope is calculated as: emaSlope = ema - ema . Optional EMA slope filter additionally requires the EMA to be rising (slope > 0) for buy signals or falling (slope < 0) for sell signals. This provides stronger trend confirmation by requiring both price position and EMA direction.
ADX Filter: Uses the Directional Movement Index (calculated via ta.dmi()) to measure trend strength. Signals only fire when ADX exceeds the threshold (default 20), indicating a strong trend rather than choppy markets. The ADX calculation uses separate length and smoothing parameters. This filter helps avoid signals during sideways/consolidation periods.
Volume Dry-Up Avoidance: Prevents signals during periods of extremely low volume relative to average. If volume dry-up is detected and the filter is enabled, signals are blocked. This helps avoid unreliable signals that occur during low participation periods.
RSI Momentum Confirmation: Requires RSI to be accelerating in the signal direction before confirming signals. For buy signals, RSI must be consistently rising (recovering from oversold) over the lookback period. For sell signals, RSI must be consistently falling (declining from overbought) over the lookback period. The momentum check verifies that all consecutive changes are in the correct direction AND the cumulative change is significant. This filter ensures signals only fire when RSI momentum aligns with the signal direction, reducing false signals from weak momentum.
Multi-Timeframe Confirmation: Requires higher timeframe RSI to align with the signal direction. For buy signals, current RSI must be below the higher timeframe RSI by at least the confirmation threshold. For sell signals, current RSI must be above the higher timeframe RSI by at least the confirmation threshold. This ensures signals align with the larger trend context, reducing counter-trend trades. The higher timeframe RSI is fetched using request.security() from the selected timeframe.
All filters use the pattern: filterResult = not filterEnabled OR conditionMet. This means if a filter is disabled, it always passes (returns true). Filters can be combined, and all must pass for a signal to fire.
RSI Centerline and Period Crossovers
RSI(50) Centerline Crossovers: Detects when the selected RSI source crosses above or below the 50 centerline. Bullish crossover: ta.crossover(rsiSource, 50), bearish crossover: ta.crossunder(rsiSource, 50). You can select which RSI (6, 14, or 24) to use for these crossovers. These signals indicate momentum shifts from bearish to bullish (above 50) or bullish to bearish (below 50).
RSI Period Crossovers: Detects when different RSI periods cross each other. Available pairs: RSI(6) × RSI(14), RSI(14) × RSI(24), or RSI(6) × RSI(24). Bullish crossover: fast RSI crosses above slow RSI (ta.crossover(rsiFast, rsiSlow)), indicating momentum acceleration. Bearish crossover: fast RSI crosses below slow RSI (ta.crossunder(rsiFast, rsiSlow)), indicating momentum deceleration. These crossovers can signal shifts in momentum before price moves.
StochRSI Calculation
Stochastic RSI applies the Stochastic oscillator formula to RSI values instead of price. The calculation: %K = ((RSI - Lowest RSI) / (Highest RSI - Lowest RSI)) × 100, where the lookback is the StochRSI length. If the range is zero, %K defaults to 50.0. %K is then smoothed using SMA with the %K smoothing length. %D is calculated as SMA of smoothed %K with the %D smoothing length. All values are clamped to 0-100. You can select which RSI (6, 14, or 24) to use as the source for StochRSI calculation.
RSI Bollinger Bands
Bollinger Bands are applied to RSI(14) instead of price. The calculation: Basis = SMA(RSI(14), BB Period), StdDev = stdev(RSI(14), BB Period), Upper = Basis + (StdDev × Deviation Multiplier), Lower = Basis - (StdDev × Deviation Multiplier). This creates dynamic zones around RSI that adapt to RSI volatility. When RSI touches or exceeds the bands, it indicates extreme conditions relative to recent RSI behavior.
Noise Reduction System
The script includes a comprehensive noise reduction system to filter false signals and improve accuracy. When enabled, signals must pass multiple quality checks:
Signal Strength Requirement: RSI must be at least X points away from the centerline (50). For buy signals, RSI must be at least X points below 50. For sell signals, RSI must be at least X points above 50. This ensures signals only trigger when RSI is significantly in oversold/overbought territory, not just near neutral.
Extreme Zone Requirement: RSI must be deep in the OB/OS zone. For buy signals, RSI must be at least X points below the oversold threshold. For sell signals, RSI must be at least X points above the overbought threshold. This ensures signals only fire in extreme conditions where reversals are more likely.
Consecutive Bar Confirmation: The signal condition must persist for N consecutive bars before triggering. This reduces false signals from single-bar spikes or noise. The confirmation checks that the signal condition was true for all bars in the lookback period.
Zone Persistence (Optional): Requires RSI to remain in the OB/OS zone for N consecutive bars, not just touch it. This ensures RSI is truly in an extreme state rather than just briefly touching the threshold. When enabled, this provides stricter filtering for higher-quality signals.
RSI Slope Confirmation (Optional): Requires RSI to be moving in the expected signal direction. For buy signals, RSI should be rising (recovering from oversold). For sell signals, RSI should be falling (declining from overbought). This ensures momentum is aligned with the signal direction. The slope is calculated by comparing current RSI to RSI N bars ago.
All noise reduction filters can be enabled/disabled independently, allowing you to customize the balance between signal frequency and accuracy. The default settings provide a good balance, but you can adjust them based on your trading style and market conditions.
Alert System
The script includes separate alert conditions for each signal type: buy/sell (adaptive RSI crossovers), divergence (regular, strong, hidden), crossovers (RSI50 centerline, RSI period crossovers), synergy signals, and trend breaks. Each alert type has its own alertcondition() declaration with a unique title and message.
An optional cooldown system prevents alert spam by requiring a minimum number of bars between alerts of the same type. The cooldown check: canAlert = na(lastAlertBar) OR (bar_index - lastAlertBar >= cooldownBars). If the last alert bar is na (first alert), it always allows the alert. Each alert type maintains its own lastAlertBar variable, so cooldowns are independent per signal type. The default cooldown is 10 bars, which is recommended for noise reduction.
Higher Timeframe RSI
The script can display RSI from a higher timeframe using request.security(). This allows you to see the RSI context from a larger timeframe (e.g., daily RSI on an hourly chart). The higher timeframe RSI uses RSI(14) calculation from the selected timeframe. This provides context for the current timeframe's RSI position relative to the larger trend.
RSI Pivot Trendlines
The script can draw trendlines connecting pivot highs and lows on RSI(6). This feature helps visualize RSI trends and identify potential trend breaks.
Pivot Detection: Pivots are detected using a configurable period. The script can require pivots to have minimum strength (RSI points difference from surrounding bars) to filter out weak pivots. Lower minPivotStrength values detect more pivots (more trendlines), while higher values detect only stronger pivots (fewer but more significant trendlines). Pivot confirmation is optional: when enabled, the script waits N bars to confirm the pivot remains the extreme, reducing repainting. Pivot confirmation functions (f_confirmPivotLow and f_confirmPivotHigh) are always called on every bar for consistency, as recommended by TradingView. When pivot bars are not available (na), safe default values are used, and the results are then used conditionally based on confirmation settings. This ensures consistent calculations and prevents calculation inconsistencies.
Trendline Drawing: Uptrend lines connect confirmed pivot lows (green), and downtrend lines connect confirmed pivot highs (red). By default, only the most recent trendline is shown (old trendlines are deleted when new pivots are confirmed). This keeps the chart clean and uncluttered. If "Keep Historical Trendlines" is enabled, the script preserves up to N historical trendlines (configurable via "Max Trendlines to Keep", default 5). When historical trendlines are enabled, old trendlines are saved to arrays instead of being deleted, allowing you to see multiple trendlines simultaneously for better trend analysis. The arrays are automatically limited to prevent memory accumulation.
Trend Break Detection: Signals are generated when RSI breaks above or below trendlines. Uptrend breaks (RSI crosses below uptrend line) generate buy signals. Downtrend breaks (RSI crosses above downtrend line) generate sell signals. Optional trend break confirmation requires the break to persist for N bars and optionally include volume confirmation. Trendline angle filtering can exclude flat/weak trendlines from generating signals (minTrendlineAngle > 0 filters out weak/flat trendlines).
How Components Work Together
The combination of multiple RSI periods provides confirmation across different timeframes, reducing false signals. RSI(6) catches early moves, RSI(14) provides balanced signals, and RSI(24) confirms longer-term trends. When all three align (synergy), it indicates strong consensus across timeframes.
Volume confirmation ensures signals occur with sufficient market participation, filtering out low-volume false breakouts. Volume climax detection identifies potential reversal points, while volume dry-up avoidance prevents signals during unreliable low-volume periods.
Trend filters align signals with the overall market direction. The EMA filter ensures you're trading with the trend, and the EMA slope filter adds an additional layer by requiring the trend to be strengthening (rising EMA for buys, falling EMA for sells).
ADX filter ensures signals only fire during strong trends, avoiding choppy/consolidation periods. RSI(50) filter ensures momentum alignment with the trade direction.
Momentum confirmation requires RSI to be accelerating in the signal direction, ensuring signals only fire when momentum is aligned. Multi-timeframe confirmation ensures signals align with higher timeframe trends, reducing counter-trend trades.
Divergence detection identifies potential reversals before they occur, providing early warning signals. Pivot-based divergence provides more accurate detection by using actual pivot points. Hidden divergence identifies continuation patterns, useful for trend-following strategies.
The noise reduction system combines multiple filters (signal strength, extreme zone, consecutive bars, zone persistence, RSI slope) to significantly reduce false signals. These filters work together to ensure only high-quality signals are generated.
The synergy system requires alignment across all RSI periods for highest-quality signals, significantly reducing false positives. Regression forecasting provides forward-looking context, helping anticipate potential RSI direction changes.
Pivot trendlines provide visual trend analysis and can generate signals when RSI breaks trendlines, indicating potential reversals or continuations.
Reset conditions prevent signal spam by requiring a minimum number of bars between signals. Separate reset conditions for buy and sell signals ensure proper signal management.
Usage Instructions
Configuration Presets (Recommended): The script includes optimized preset configurations for instant setup. Simply select your trading style from the "Configuration Preset" dropdown:
- Scalping Preset: RSI(4, 7, 9) with minimal smoothing. Noise reduction disabled, momentum confirmation disabled for fastest signals.
- Day Trading Preset: RSI(6, 9, 14) with light smoothing. Momentum confirmation enabled for better signal quality.
- Swing Trading Preset: RSI(14, 14, 21) with moderate smoothing. Balanced configuration for medium-term trades.
- Position Trading Preset: RSI(24, 21, 28) with heavier smoothing. Optimized for longer-term positions with all filters active.
- Custom Mode: Full manual control over all settings. Default behavior matches previous script versions.
Presets automatically configure RSI periods, smoothing lengths, and filter settings. You can still manually adjust any setting after selecting a preset if needed.
Getting Started: The easiest way to get started is to select a configuration preset matching your trading style (Scalping, Day Trading, Swing Trading, or Position Trading) from the "Configuration Preset" dropdown. This instantly configures all settings for optimal performance. Alternatively, use "Custom" mode for full manual control. The default configuration (Custom mode) shows RSI(6), RSI(14), and RSI(24) with their default smoothing. Overbought/oversold fill zones are enabled by default.
Customizing RSI Periods: Adjust the RSI lengths (6, 14, 24) based on your trading timeframe. Shorter periods (6) for scalping, standard (14) for day trading, longer (24) for swing trading. You can disable any RSI period you don't need.
Smoothing Selection: Choose smoothing method based on your needs. EMA provides balanced smoothing, RMA (Wilder's) is traditional, Zero-Lag reduces lag but may increase noise. Adjust smoothing lengths individually or use global smoothing for consistency. Note: Smoothing lengths are automatically validated to ensure they are always less than the corresponding RSI period length. If you set smoothing >= RSI length, it will be auto-adjusted to prevent invalid configurations.
Dynamic OB/OS: The dynamic thresholds automatically adapt to volatility. Adjust the volatility multiplier and base percentage to fine-tune sensitivity. Higher values create wider thresholds in volatile markets.
Volume Confirmation: Set volume threshold to 1.2 (default) for standard confirmation, higher for stricter filtering, or 0.1 to disable volume filtering entirely.
Multi-RSI Synergy: Use "ALL" mode for highest-quality signals (all 3 RSIs must align), or "2-of-3" mode for more frequent signals. Adjust the reset period to control signal frequency.
Filters: Enable filters gradually to find your preferred balance. Start with volume confirmation, then add trend filter, then ADX for strongest confirmation. RSI(50) filter is useful for momentum-based strategies and is recommended for noise reduction. Momentum confirmation and multi-timeframe confirmation add additional layers of accuracy but may reduce signal frequency.
Noise Reduction: The noise reduction system is enabled by default with balanced settings. Adjust minSignalStrength (default 3.0) to control how far RSI must be from centerline. Increase requireConsecutiveBars (default 1) to require signals to persist longer. Enable requireZonePersistence and requireRsiSlope for stricter filtering (higher quality but fewer signals). Start with defaults and adjust based on your needs.
Divergence: Enable divergence detection and adjust lookback periods. Strong divergence (with engulfing confirmation) provides higher-quality signals. Hidden divergence is useful for trend-following strategies. Enable pivot-based divergence for more accurate detection using actual pivot points instead of simple lowest/highest comparisons. Pivot-based divergence uses tolerance-based matching (1% for price, 1.0 RSI point for RSI) for better accuracy.
Forecasting: Enable regression forecasting to see potential RSI direction. Linear regression is simplest, polynomial captures curves, exponential smoothing adapts to trends. Adjust horizon based on your trading timeframe. Confidence bands show forecast uncertainty - wider bands indicate less reliable forecasts.
Pivot Trendlines: Enable pivot trendlines to visualize RSI trends and identify trend breaks. Adjust pivot detection period (default 5) - higher values detect fewer but stronger pivots. Enable pivot confirmation (default ON) to reduce repainting. Set minPivotStrength (default 1.0) to filter weak pivots - lower values detect more pivots (more trendlines), higher values detect only stronger pivots (fewer trendlines). Enable "Keep Historical Trendlines" to preserve multiple trendlines instead of just the most recent one. Set "Max Trendlines to Keep" (default 5) to control how many historical trendlines are preserved. Enable trend break confirmation for more reliable break signals. Adjust minTrendlineAngle (default 0.0) to filter flat trendlines - set to 0.1-0.5 to exclude weak trendlines.
Alerts: Set up alerts for your preferred signal types. Enable cooldown to prevent alert spam. Each signal type has its own alert condition, so you can be selective about which signals trigger alerts.
Visual Elements and Signal Markers
The script uses various visual markers to indicate signals and conditions:
- "sBottom" label (green): Strong bottom signal - RSI at extreme low with strong buy conditions
- "sTop" label (red): Strong top signal - RSI at extreme high with strong sell conditions
- "SyBuy" label (lime): Multi-RSI synergy buy signal - all RSIs aligned oversold
- "SySell" label (red): Multi-RSI synergy sell signal - all RSIs aligned overbought
- 🐂 emoji (green): Strong bullish divergence detected
- 🐻 emoji (red): Strong bearish divergence detected
- 🔆 emoji: Weak divergence signals (if enabled)
- "H-Bull" label: Hidden bullish divergence
- "H-Bear" label: Hidden bearish divergence
- ⚡ marker (top of pane): Volume climax detected (extreme volume) - positioned at top for visibility
- 💧 marker (top of pane): Volume dry-up detected (very low volume) - positioned at top for visibility
- ↑ triangle (lime): Uptrend break signal - RSI breaks below uptrend line
- ↓ triangle (red): Downtrend break signal - RSI breaks above downtrend line
- Triangle up (lime): RSI(50) bullish crossover
- Triangle down (red): RSI(50) bearish crossover
- Circle markers: RSI period crossovers
All markers are positioned at the RSI value where the signal occurs, using location.absolute for precise placement.
Signal Priority and Interpretation
Signals are generated independently and can occur simultaneously. Higher-priority signals generally indicate stronger setups:
1. Multi-RSI Synergy signals (SyBuy/SySell) - Highest priority: Requires alignment across all RSI periods plus volume and filter confirmation. These are the most reliable signals.
2. Strong Top/Bottom signals (sTop/sBottom) - High priority: Indicates extreme RSI levels with strong bounce conditions. Requires volume confirmation and all filters.
3. Divergence signals - Medium-High priority: Strong divergence (with engulfing) is more reliable than regular divergence. Hidden divergence indicates continuation rather than reversal.
4. Adaptive RSI crossovers - Medium priority: Buy when adaptive RSI crosses below dynamic oversold, sell when it crosses above dynamic overbought. These use volatility-adjusted RSI for more accurate signals.
5. RSI(50) centerline crossovers - Medium priority: Momentum shift signals. Less reliable alone but useful when combined with other confirmations.
6. RSI period crossovers - Lower priority: Early momentum shift indicators. Can provide early warning but may produce false signals in choppy markets.
Best practice: Wait for multiple confirmations. For example, a synergy signal combined with divergence and volume climax provides the strongest setup.
Chart Requirements
For proper script functionality and compliance with TradingView requirements, ensure your chart displays:
- Symbol name: The trading pair or instrument name should be visible
- Timeframe: The chart timeframe should be clearly displayed
- Script name: "Ultimate RSI " should be visible in the indicator title
These elements help traders understand what they're viewing and ensure proper script identification. The script automatically includes this information in the indicator title and chart labels.
Performance Considerations
The script is optimized for performance:
- ATR and Volume SMA are cached using var variables, updating only on confirmed and real-time bars to reduce redundant calculations
- Forecast line arrays are dynamically managed: lines are reused when possible, and unused lines are deleted to prevent memory accumulation
- Calculations use efficient Pine Script functions (ta.rsi, ta.ema, etc.) which are optimized by TradingView
- Array operations are minimized where possible, with direct calculations preferred
- Polynomial regression automatically caps the forecast horizon at 20 bars (POLYNOMIAL_MAX_HORIZON constant) to prevent performance degradation, as polynomial regression has O(n³) complexity. This safeguard ensures optimal performance even with large horizon settings
- Pivot detection includes edge case handling to ensure reliable calculations even on early bars with limited historical data. Regression forecasting functions include comprehensive safety checks: horizon validation (must not exceed array size), empty array handling, edge case handling for horizon=1 scenarios, and division-by-zero protection in all mathematical operations
The script should perform well on all timeframes. On very long historical data, forecast lines may accumulate if the horizon is large; consider reducing the forecast horizon if you experience performance issues. The polynomial regression performance safeguard automatically prevents performance issues for that specific regression type.
Known Limitations and Considerations
- Forecast lines are forward-looking projections and should not be used as definitive predictions. They provide context but are not guaranteed to be accurate.
- Dynamic OB/OS thresholds can exceed 100 or go below 0 in extreme volatility scenarios, but are clamped to 0-100 range. This means in very volatile markets, the dynamic thresholds may not widen as much as the raw calculation suggests.
- Volume confirmation requires sufficient historical volume data. On new instruments or very short timeframes, volume calculations may be less reliable.
- Higher timeframe RSI uses request.security() which may have slight delays on some data feeds.
- Regression forecasting requires at least N bars of history (where N = forecast horizon) before it can generate forecasts. Early bars will not show forecast lines.
- StochRSI calculation requires the selected RSI source to have sufficient history. Very short RSI periods on new charts may produce less reliable StochRSI values initially.
Practical Use Cases
The indicator can be configured for different trading styles and timeframes:
Swing Trading: Select the "Swing Trading" preset for instant optimal configuration. This preset uses RSI periods (14, 14, 21) with moderate smoothing. Alternatively, manually configure: Use RSI(24) with Multi-RSI Synergy in "ALL" mode, combined with trend filter (EMA 200) and ADX filter. This configuration provides high-probability setups with strong confirmation across multiple RSI periods.
Day Trading: Select the "Day Trading" preset for instant optimal configuration. This preset uses RSI periods (6, 9, 14) with light smoothing and momentum confirmation enabled. Alternatively, manually configure: Use RSI(6) with Zero-Lag smoothing for fast signal detection. Enable volume confirmation with threshold 1.2-1.5 for reliable entries. Combine with RSI(50) filter to ensure momentum alignment. Strong top/bottom signals work well for day trading reversals.
Trend Following: Enable trend filter (EMA) and EMA slope filter for strong trend confirmation. Use RSI(14) or RSI(24) with ADX filter to avoid choppy markets. Hidden divergence signals are useful for trend continuation entries.
Reversal Trading: Focus on divergence detection (regular and strong) combined with strong top/bottom signals. Enable volume climax detection to identify capitulation moments. Use RSI(6) for early reversal signals, confirmed by RSI(14) and RSI(24).
Forecasting and Planning: Enable regression forecasting with polynomial or exponential smoothing methods. Use forecast horizon of 10-20 bars for swing trading, 5-10 bars for day trading. Confidence bands help assess forecast reliability.
Multi-Timeframe Analysis: Enable higher timeframe RSI to see context from larger timeframes. For example, use daily RSI on hourly charts to understand the larger trend context. This helps avoid counter-trend trades.
Scalping: Select the "Scalping" preset for instant optimal configuration. This preset uses RSI periods (4, 7, 9) with minimal smoothing, disables noise reduction, and disables momentum confirmation for faster signals. Alternatively, manually configure: Use RSI(6) with minimal smoothing (or Zero-Lag) for ultra-fast signals. Disable most filters except volume confirmation. Use RSI period crossovers (RSI(6) × RSI(14)) for early momentum shifts. Set volume threshold to 1.0-1.2 for less restrictive filtering.
Position Trading: Select the "Position Trading" preset for instant optimal configuration. This preset uses extended RSI periods (24, 21, 28) with heavier smoothing, optimized for longer-term trades. Alternatively, manually configure: Use RSI(24) with all filters enabled (Trend, ADX, RSI(50), Volume Dry-Up avoidance). Multi-RSI Synergy in "ALL" mode provides highest-quality signals.
Practical Tips and Best Practices
Getting Started: The fastest way to get started is to select a configuration preset that matches your trading style. Simply choose "Scalping", "Day Trading", "Swing Trading", or "Position Trading" from the "Configuration Preset" dropdown to instantly configure all settings optimally. For advanced users, use "Custom" mode for full manual control. The default configuration (Custom mode) is balanced and works well across different markets. After observing behavior, customize settings to match your trading style.
Reducing Repainting: All signals are based on confirmed bars, minimizing repainting. The script uses confirmed bar data for all calculations to ensure backtesting accuracy.
Signal Quality: Multi-RSI Synergy signals in "ALL" mode provide the highest-quality signals because they require alignment across all three RSI periods. These signals have lower frequency but higher reliability. For more frequent signals, use "2-of-3" mode. The noise reduction system further improves signal quality by requiring multiple confirmations (signal strength, extreme zone, consecutive bars, optional zone persistence and RSI slope). Adjust noise reduction settings to balance signal frequency vs. accuracy.
Filter Combinations: Start with volume confirmation, then add trend filter for trend alignment, then ADX filter for trend strength. Combining all three filters significantly reduces false signals but also reduces signal frequency. Find your balance based on your risk tolerance.
Volume Filtering: Set volume threshold to 0.1 or lower to effectively disable volume filtering if you trade instruments with unreliable volume data or want to test without volume confirmation. Standard confirmation uses 1.2-1.5 threshold.
RSI Period Selection: RSI(6) is most sensitive and best for scalping or early signal detection. RSI(14) provides balanced signals suitable for day trading. RSI(24) is smoother and better for swing trading and trend confirmation. You can disable any RSI period you don't need to reduce visual clutter.
Smoothing Methods: EMA provides balanced smoothing with moderate lag. RMA (Wilder's smoothing) is traditional and works well for RSI. Zero-Lag reduces lag but may increase noise. WMA gives more weight to recent values. Choose based on your preference for responsiveness vs. smoothness.
Forecasting: Linear regression is simplest and works well for trending markets. Polynomial regression captures curves and works better in ranging markets. Exponential smoothing adapts to trends. Moving average method is most conservative. Use confidence bands to assess forecast reliability.
Divergence: Strong divergence (with engulfing confirmation) is more reliable than regular divergence. Hidden divergence indicates continuation rather than reversal, useful for trend-following strategies. Pivot-based divergence provides more accurate detection by using actual pivot points instead of simple lowest/highest comparisons. Adjust lookback periods based on your timeframe: shorter for day trading, longer for swing trading. Pivot divergence period (default 5) controls the sensitivity of pivot detection.
Dynamic Thresholds: Dynamic OB/OS thresholds automatically adapt to volatility. In volatile markets, thresholds widen; in calm markets, they narrow. Adjust the volatility multiplier and base percentage to fine-tune sensitivity. Higher values create wider thresholds in volatile markets.
Alert Management: Enable alert cooldown (default 10 bars, recommended) to prevent alert spam. Each alert type has its own cooldown, so you can set different cooldowns for different signal types. For example, use shorter cooldown for synergy signals (high quality) and longer cooldown for crossovers (more frequent). The cooldown system works independently for each signal type, preventing spam while allowing different signal types to fire when appropriate.
Technical Specifications
- Pine Script Version: v6
- Indicator Type: Non-overlay (displays in separate panel below price chart)
- Repainting Behavior: Minimal - all signals are based on confirmed bars, ensuring accurate backtesting results
- Performance: Optimized with caching for ATR and volume calculations. Forecast arrays are dynamically managed to prevent memory accumulation.
- Compatibility: Works on all timeframes (1 minute to 1 month) and all instruments (stocks, forex, crypto, futures, etc.)
- Edge Case Handling: All calculations include safety checks for division by zero, NA values, and boundary conditions. Reset conditions and alert cooldowns handle edge cases where conditions never occurred or values are NA.
- Reset Logic: Separate reset conditions for buy signals (based on bottom conditions) and sell signals (based on top conditions) ensure logical correctness.
- Input Parameters: 60+ customizable parameters organized into logical groups for easy configuration. Configuration presets available for instant setup (Scalping, Day Trading, Swing Trading, Position Trading, Custom).
- Noise Reduction: Comprehensive noise reduction system with multiple filters (signal strength, extreme zone, consecutive bars, zone persistence, RSI slope) to reduce false signals.
- Pivot-Based Divergence: Enhanced divergence detection using actual pivot points for improved accuracy.
- Momentum Confirmation: RSI momentum filter ensures signals only fire when RSI is accelerating in the signal direction.
- Multi-Timeframe Confirmation: Optional higher timeframe RSI alignment for trend confirmation.
- Enhanced Pivot Trendlines: Trendline drawing with strength requirements, confirmation, and trend break detection.
Technical Notes
- All RSI values are clamped to 0-100 range to ensure valid oscillator values
- ATR and Volume SMA are cached for performance, updating on confirmed and real-time bars
- Reset conditions handle edge cases: if a condition never occurred, reset returns true (allows first signal)
- Alert cooldown handles na values: if no previous alert, cooldown allows the alert
- Forecast arrays are dynamically sized based on horizon, with unused lines cleaned up
- Fill logic uses a minimum gap (0.1) to ensure reliable polygon rendering in TradingView
- All calculations include safety checks for division by zero and boundary conditions. Regression functions validate that horizon doesn't exceed array size, and all array access operations include bounds checking to prevent out-of-bounds errors
- The script uses separate reset conditions for buy signals (based on bottom conditions) and sell signals (based on top conditions) for logical correctness
- Background coloring uses a fallback system: dynamic color takes priority, then RSI(6) heatmap, then monotone if both are disabled
- Noise reduction filters are applied after accuracy filters, providing multiple layers of signal quality control
- Pivot trendlines use strength requirements to filter weak pivots, reducing noise in trendline drawing. Historical trendlines are stored in arrays and automatically limited to prevent memory accumulation when "Keep Historical Trendlines" is enabled
- Volume climax and dry-up markers are positioned at the top of the pane for better visibility
- All calculations are optimized with conditional execution - features only calculate when enabled (performance optimization)
- Input Validation: Automatic cross-input validation ensures smoothing lengths are always less than RSI period lengths, preventing configuration errors
- Configuration Presets: Four optimized preset configurations (Scalping, Day Trading, Swing Trading, Position Trading) for instant setup, plus Custom mode for full manual control
- Constants Management: Magic numbers extracted to documented constants for improved maintainability and easier tuning (pivot tolerance, divergence thresholds, fill gap, etc.)
- TradingView Function Consistency: All TradingView functions (ta.crossover, ta.crossunder, ta.atr, ta.lowest, ta.highest, ta.lowestbars, ta.highestbars, etc.) and custom functions that depend on historical results (f_consecutiveBarConfirmation, f_rsiSlopeConfirmation, f_rsiZonePersistence, f_applyAllFilters, f_rsiMomentum, f_forecast, f_confirmPivotLow, f_confirmPivotHigh) are called on every bar for consistency, as recommended by TradingView. Results are then used conditionally when needed. This ensures consistent calculations and prevents calculation inconsistencies.

Hybrid -WinCAlgo/// 🇬🇧
Hybrid - WinCAlgo is a weighted composite oscillator designed to provide a more robust and reliable signal than the standard Relative Strength Index (RSI). It integrates four different momentum and volume metrics—RSI, Money Flow Index (MFI), Scaled CCI, and VWAP-RSI—into a single 0-100 oscillator.
This powerful tool aims to filter market noise and enhance the detection of trend reversals by confirming momentum with trading volume and volume-weighted average price action.
⚪ What is this Indicator?
The Hybrid Oscillator combines:
* RSI (40% Weight): Measures fundamental price momentum.
* VWAP-RSI (40% Weight): Measures the momentum of the Volume Weighted Average Price (VWAP), providing strong volume confirmation for trend strength.
* MFI (10% Weight): Measures money flow volume, confirming momentum with liquidity.
* Scaled CCI (10% Weight): Tracks market extremes and potential trend shifts, scaled to fit the 0-100 range.
⚪ Key Features
* Composite Strength: Blends four different market factors for a multi-dimensional view of momentum.
* Volume Integration: High weights on VWAP-RSI and MFI ensure that momentum signals are backed by trading volume.
* Advanced Divergence: The robust formula significantly enhances the detection of Bullish and Bearish Divergences, often providing an earlier signal than traditional oscillators.
* Customizable: Adjustable Lookback Length (N) and Individual Component Weights allow users to fine-tune the oscillator for specific assets or timeframes.
* Visual Clarity: Uses 40/60 bands for earlier Overbought/Oversold indications, with a gradient-styled background for intuitive visual interpretation.
⚪ Usage
Use Hybrid – WinCAlgo as your primary momentum confirmation tool:
* Divergence Signals: Trust the indicator when it fails to confirm new price highs/lows; this signals imminent trend exhaustion and reversal.
* Accumulation/Distribution: Look for the oscillator to rise/fall while the price is ranging at a bottom/top; this confirms hidden buying or selling (accumulation).
* Overbought/Oversold: Use the 60 band as the trigger for potential selling/shorting signals, and the 40 band for potential buying/longing signals.
* Noise Filter: Combine with a higher timeframe chart (e.g., 4H or Daily) to filter out gürültü (noise) and focus only on significant momentum shifts.
---
