RSI+Stoch Band Oscillator📈 RSI + Stochastic Band Oscillator
Overview:
The RSI + Stochastic Band Oscillator is a technical indicator that combines the strengths of both the Relative Strength Index (RSI) and the Stochastic Oscillator. Instead of using static thresholds, this indicator dynamically constructs upper and lower bands based on the RSI and Stochastic overbought/oversold zones. It then measures the relative position of the current price within this adaptive range, effectively producing a normalized oscillator.
Key Components:
RSI-Based Dynamic Bands:
Using RSI values and exponential moving averages of price changes, upper and lower dynamic bands are constructed.
These bands adjust based on overbought and oversold levels, offering a more responsive framework than fixed RSI thresholds.
Stochastic-Based Dynamic Bands:
Similarly, Stochastic %K and %D values are used to construct dynamic bands.
These adapt to overbought and oversold levels by recalculating potential high/low values within the lookback window.
Oscillator Calculation:
The oscillator (osc) is computed as the relative position of the current close within the combined upper and lower bands of both RSI and Stochastic.
This value is normalized between 0 and 100, allowing clear identification of extreme conditions.
Visual Features:
The oscillator is plotted as a line between 0 and 100.
Color-filled areas highlight when the oscillator enters extreme zones:
Above 100 with falling momentum: Red zone (potential reversal).
Below 0 with rising momentum: Green zone (potential reversal).
Additional trend conditions (falling/rising RSI, %K, and %D) are used to strengthen reversal signals by confirming momentum shifts.
Relative Strength Index (RSI)

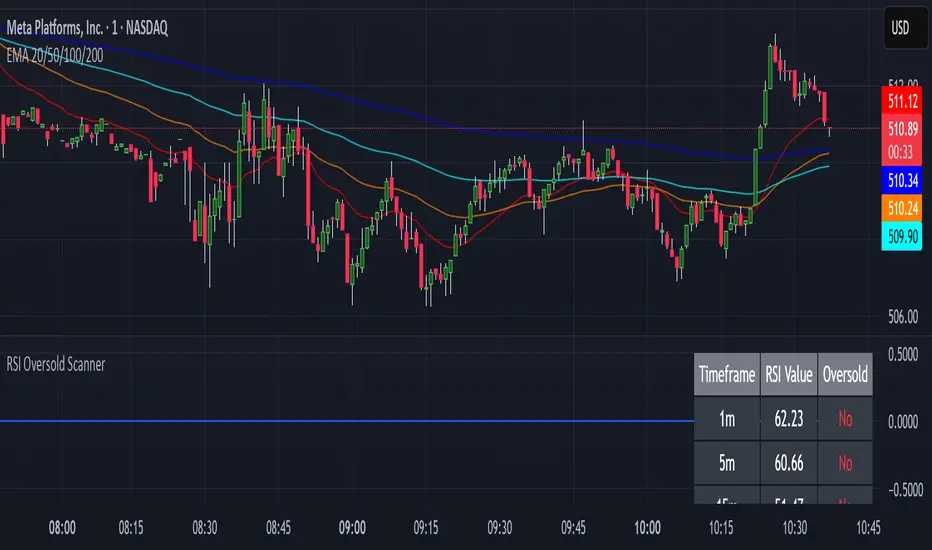
RSI Oversold ScannerPine Script Description for TradingView Publication
Title: RSI Oversold Scanner (1m, 5m, 15m)
Description:
The RSI Oversold Scanner is a powerful tool designed to identify stocks that are simultaneously oversold on the 1-minute, 5-minute, and 15-minute timeframes, based on the Relative Strength Index (RSI). This script is ideal for traders seeking short-term reversal or momentum opportunities across multiple intraday timeframes.
Key Features:
Multi-Timeframe RSI Analysis: Calculates RSI (default length: 14) on the 1m, 5m, and 15m timeframes and checks if all are below the oversold threshold (default: 30).
Visual Output: Displays a table in the top-right corner showing RSI values and oversold status ("Yes" or "No") for each timeframe, making it easy to verify conditions.
Scan Result: Plots a value of 1 when all three timeframes are oversold, or 0 otherwise, enabling quick identification of matching stocks.
Alert Support: Includes an alert condition that triggers when a stock is oversold on all timeframes, with a customizable message for real-time notifications.
User-Friendly: Built with Pine Script v6 for compatibility and reliability, with clear visual feedback for traders of all levels.
How It Works:
The script uses ta.rsi to compute RSI on the current chart’s timeframe (1m) and request.security to fetch RSI data for the 5m and 15m timeframes.
It checks if RSI is below the oversold level (default: 30) on all three timeframes.
A table displays the RSI values and oversold status for easy debugging.
The Scan Result plot (1 or 0) indicates whether the stock meets the oversold criteria, which can be used for manual scanning or alerts.
Usage Instructions:
Add the script to your chart via Pine Editor.
Use a watchlist to switch between stocks and check the table or Scan Result for oversold conditions.
Set alerts by selecting the script’s Scan Result condition (value = 1) to get notified when a stock is oversold on all timeframes.
Customize the RSI length or oversold level in the script’s code if needed (e.g., change rsiLength or oversoldLevel).
Notes:
Best used on intraday charts (e.g., 1m or higher) with a watchlist for manual scanning, as TradingView’s Stock Screener does not directly support custom Pine Scripts.
Real-time alerts and intraday data may require a TradingView paid plan.
The script uses only two request.security calls, staying well within Pine Script’s limits.
Ideal For:
Day traders and swing traders looking for oversold stocks across multiple intraday timeframes.
Users who want to combine technical analysis with visual and alert-based confirmation.
RSI Forecast [Titans_Invest]RSI Forecast
Introducing one of the most impressive RSI indicators ever created – arguably the best on TradingView, and potentially the best in the world.
RSI Forecast is a visionary evolution of the classic RSI, merging powerful customization with groundbreaking predictive capabilities. While preserving the core principles of traditional RSI, it takes analysis to the next level by allowing users to anticipate potential future RSI movements.
Real-Time RSI Forecasting:
For the first time ever, an RSI indicator integrates linear regression using the least squares method to accurately forecast the future behavior of the RSI. This innovation empowers traders to stay one step ahead of the market with forward-looking insight.
Highly Customizable:
Easily adapt the indicator to your personal trading style. Fine-tune a variety of parameters to generate signals perfectly aligned with your strategy.
Innovative, Unique, and Powerful:
This is the world’s first RSI Forecast to apply this predictive approach using least squares linear regression. A truly elite-level tool designed for traders who want a real edge in the market.
⯁ SCIENTIFIC BASIS LINEAR REGRESSION
Linear Regression is a fundamental method of statistics and machine learning, used to model the relationship between a dependent variable y and one or more independent variables 𝑥.
The general formula for a simple linear regression is given by:
y = β₀ + β₁x + ε
Where:
y = is the predicted variable (e.g. future value of RSI)
x = is the explanatory variable (e.g. time or bar index)
β0 = is the intercept (value of 𝑦 when 𝑥 = 0)
𝛽1 = is the slope of the line (rate of change)
ε = is the random error term
The goal is to estimate the coefficients 𝛽0 and 𝛽1 so as to minimize the sum of the squared errors — the so-called Random Error Method Least Squares.
⯁ LEAST SQUARES ESTIMATION
To minimize the error between predicted and observed values, we use the following formulas:
β₁ = /
β₀ = ȳ - β₁x̄
Where:
∑ = sum
x̄ = mean of x
ȳ = mean of y
x_i, y_i = individual values of the variables.
Where:
x_i and y_i are the means of the independent and dependent variables, respectively.
i ranges from 1 to n, the number of observations.
These equations guarantee the best linear unbiased estimator, according to the Gauss-Markov theorem, assuming homoscedasticity and linearity.
⯁ LINEAR REGRESSION IN MACHINE LEARNING
Linear regression is one of the cornerstones of supervised learning. Its simplicity and ability to generate accurate quantitative predictions make it essential in AI systems, predictive algorithms, time series analysis, and automated trading strategies.
By applying this model to the RSI, you are literally putting artificial intelligence at the heart of a classic indicator, bringing a new dimension to technical analysis.
⯁ VISUAL INTERPRETATION
Imagine an RSI time series like this:
Time →
RSI →
The regression line will smooth these values and extend them n periods into the future, creating a predicted trajectory based on the historical moment. This line becomes the predicted RSI, which can be crossed with the actual RSI to generate more intelligent signals.
⯁ SUMMARY OF SCIENTIFIC CONCEPTS USED
Linear Regression Models the relationship between variables using a straight line.
Least Squares Minimizes the sum of squared errors between prediction and reality.
Time Series Forecasting Estimates future values based on historical data.
Supervised Learning Trains models to predict outputs from known inputs.
Statistical Smoothing Reduces noise and reveals underlying trends.
⯁ WHY THIS INDICATOR IS REVOLUTIONARY
Scientifically-based: Based on statistical theory and mathematical inference.
Unprecedented: First public RSI with least squares predictive modeling.
Intelligent: Built with machine learning logic.
Practical: Generates forward-thinking signals.
Customizable: Flexible for any trading strategy.
⯁ CONCLUSION
By combining RSI with linear regression, this indicator allows a trader to predict market momentum, not just follow it.
RSI Forecast is not just an indicator — it is a scientific breakthrough in technical analysis technology.
⯁ Example of simple linear regression, which has one independent variable:
⯁ In linear regression, observations ( red ) are considered to be the result of random deviations ( green ) from an underlying relationship ( blue ) between a dependent variable ( y ) and an independent variable ( x ).
⯁ Visualizing heteroscedasticity in a scatterplot against 100 random fitted values using Matlab:
⯁ The data sets in the Anscombe's quartet are designed to have approximately the same linear regression line (as well as nearly identical means, standard deviations, and correlations) but are graphically very different. This illustrates the pitfalls of relying solely on a fitted model to understand the relationship between variables.
⯁ The result of fitting a set of data points with a quadratic function:
_______________________________________________________________________
🥇 This is the world’s first RSI indicator with: Linear Regression for Forecasting 🥇_______________________________________________________________________
_________________________________________________
🔮 Linear Regression: PineScript Technical Parameters 🔮
_________________________________________________
Forecast Types:
• Flat: Assumes prices will remain the same.
• Linreg: Makes a 'Linear Regression' forecast for n periods.
Technical Information:
ta.linreg (built-in function)
Linear regression curve. A line that best fits the specified prices over a user-defined time period. It is calculated using the least squares method. The result of this function is calculated using the formula: linreg = intercept + slope * (length - 1 - offset), where intercept and slope are the values calculated using the least squares method on the source series.
Syntax:
• Function: ta.linreg()
Parameters:
• source: Source price series.
• length: Number of bars (period).
• offset: Offset.
• return: Linear regression curve.
This function has been cleverly applied to the RSI, making it capable of projecting future values based on past statistical trends.
______________________________________________________
______________________________________________________
⯁ WHAT IS THE RSI❓
The Relative Strength Index (RSI) is a technical analysis indicator developed by J. Welles Wilder. It measures the magnitude of recent price movements to evaluate overbought or oversold conditions in a market. The RSI is an oscillator that ranges from 0 to 100 and is commonly used to identify potential reversal points, as well as the strength of a trend.
⯁ HOW TO USE THE RSI❓
The RSI is calculated based on average gains and losses over a specified period (usually 14 periods). It is plotted on a scale from 0 to 100 and includes three main zones:
• Overbought: When the RSI is above 70, indicating that the asset may be overbought.
• Oversold: When the RSI is below 30, indicating that the asset may be oversold.
• Neutral Zone: Between 30 and 70, where there is no clear signal of overbought or oversold conditions.
______________________________________________________
______________________________________________________
⯁ ENTRY CONDITIONS
The conditions below are fully flexible and allow for complete customization of the signal.
______________________________________________________
______________________________________________________
🔹 CONDITIONS TO BUY 📈
______________________________________________________
• Signal Validity: The signal will remain valid for X bars .
• Signal Sequence: Configurable as AND or OR .
📈 RSI Conditions:
🔹 RSI > Upper
🔹 RSI < Upper
🔹 RSI > Lower
🔹 RSI < Lower
🔹 RSI > Middle
🔹 RSI < Middle
🔹 RSI > MA
🔹 RSI < MA
📈 MA Conditions:
🔹 MA > Upper
🔹 MA < Upper
🔹 MA > Lower
🔹 MA < Lower
📈 Crossovers:
🔹 RSI (Crossover) Upper
🔹 RSI (Crossunder) Upper
🔹 RSI (Crossover) Lower
🔹 RSI (Crossunder) Lower
🔹 RSI (Crossover) Middle
🔹 RSI (Crossunder) Middle
🔹 RSI (Crossover) MA
🔹 RSI (Crossunder) MA
🔹 MA (Crossover) Upper
🔹 MA (Crossunder) Upper
🔹 MA (Crossover) Lower
🔹 MA (Crossunder) Lower
📈 RSI Divergences:
🔹 RSI Divergence Bull
🔹 RSI Divergence Bear
📈 RSI Forecast:
🔮 RSI (Crossover) MA Forecast
🔮 RSI (Crossunder) MA Forecast
______________________________________________________
______________________________________________________
🔸 CONDITIONS TO SELL 📉
______________________________________________________
• Signal Validity: The signal will remain valid for X bars .
• Signal Sequence: Configurable as AND or OR .
📉 RSI Conditions:
🔸 RSI > Upper
🔸 RSI < Upper
🔸 RSI > Lower
🔸 RSI < Lower
🔸 RSI > Middle
🔸 RSI < Middle
🔸 RSI > MA
🔸 RSI < MA
📉 MA Conditions:
🔸 MA > Upper
🔸 MA < Upper
🔸 MA > Lower
🔸 MA < Lower
📉 Crossovers:
🔸 RSI (Crossover) Upper
🔸 RSI (Crossunder) Upper
🔸 RSI (Crossover) Lower
🔸 RSI (Crossunder) Lower
🔸 RSI (Crossover) Middle
🔸 RSI (Crossunder) Middle
🔸 RSI (Crossover) MA
🔸 RSI (Crossunder) MA
🔸 MA (Crossover) Upper
🔸 MA (Crossunder) Upper
🔸 MA (Crossover) Lower
🔸 MA (Crossunder) Lower
📉 RSI Divergences:
🔸 RSI Divergence Bull
🔸 RSI Divergence Bear
📉 RSI Forecast:
🔮 RSI (Crossover) MA Forecast
🔮 RSI (Crossunder) MA Forecast
______________________________________________________
______________________________________________________
🤖 AUTOMATION 🤖
• You can automate the BUY and SELL signals of this indicator.
______________________________________________________
______________________________________________________
⯁ UNIQUE FEATURES
______________________________________________________
Linear Regression: (Forecast)
Signal Validity: The signal will remain valid for X bars
Signal Sequence: Configurable as AND/OR
Condition Table: BUY/SELL
Condition Labels: BUY/SELL
Plot Labels in the Graph Above: BUY/SELL
Automate and Monitor Signals/Alerts: BUY/SELL
Linear Regression (Forecast)
Signal Validity: The signal will remain valid for X bars
Signal Sequence: Configurable as AND/OR
Condition Table: BUY/SELL
Condition Labels: BUY/SELL
Plot Labels in the Graph Above: BUY/SELL
Automate and Monitor Signals/Alerts: BUY/SELL
______________________________________________________
📜 SCRIPT : RSI Forecast
🎴 Art by : @Titans_Invest & @DiFlip
👨💻 Dev by : @Titans_Invest & @DiFlip
🎑 Titans Invest — The Wizards Without Gloves 🧤
✨ Enjoy!
______________________________________________________
o Mission 🗺
• Inspire Traders to manifest Magic in the Market.
o Vision 𐓏
• To elevate collective Energy 𐓷𐓏

Altcoin Reversal or Correction DetectionINDICATOR OVERVIEW: Altcoin Reversal or Correction Detection
Altcoin Reversal or Correction Detection is a powerful crypto-specific indicator designed exclusively for altcoins by analyzing their RSI values across multiple timeframes alongside Bitcoin’s RSI. Since BTC's price movements have a strong influence on altcoins, this tool helps traders better understand whether a reversal or correction signal is truly reliable or just noise. Even if an altcoin appears oversold or overbought, it may continue trending with BTC—so this indicator gives you the full picture.
The indicator is optimized for CRYPTO MARKETS only. Not suitable for BTC itself—this is a precision tool built only for ALTCOINS only.
This indicator is not only for signals but also serves as a tool for observing all the information from different timeframes of BTC and altcoins collectively.
How the Calculation Works: Algorithm Overview
The Altcoin Reversal or Correction Detection indicator relies on an algorithm that compares the RSI values of the altcoin across multiple timeframes with Bitcoin's RSI values. This allows the indicator to identify key market moments where a reversal or correction might occur.
BTC-Altcoin RSI Correlation: The algorithm looks for the correlation between Bitcoin's price movements and the altcoin's price actions, as BTC often influences the direction of altcoins. When both Bitcoin and the altcoin show either overbought or oversold conditions in a significant number of timeframes, the indicator signals the potential for a reversal or correction.
Multi-Timeframe Confirmation: Unlike traditional indicators that may focus on a single timeframe, this tool checks multiple timeframes for both BTC and the altcoin. When the same overbought/oversold conditions are met across multiple timeframes, it confirms the likelihood of a trend reversal or correction, providing a more reliable signal. The more timeframes that align with this pattern, the stronger the signal becomes.
Overbought/Oversold Conditions & Extreme RSI Values: The algorithm also takes into account the size of the RSI values, especially focusing on extreme overbought and oversold levels. The greater the RSI values are in these extreme regions, the stronger the potential reversal or correction signal. This means that not only do multiple timeframes need to confirm the condition, but the magnitude of the overbought or oversold RSI level plays a crucial role in determining the strength of the signal.
Signal Strength Levels: The signals are classified into three levels:
Early Signal
Strong Signal
Very Strong Signal
By taking into account the multi-timeframe analysis of both BTC and the altcoin RSI values, along with the magnitude of these RSI values, the indicator offers a highly reliable method for detecting potential reversals and corrections.
Who Is This Indicator Suitable For?
This indicator can also be used to detect reversal points, but it is especially effective for scalping. It highlights potential correction points, making it perfect for quick entries during smaller market pullbacks or short-term trend shifts, which is more suitable for scalpers looking to capitalize on short-term movements
Integration with other tools
Use this tool alongside key Support and Resistance zones to further enhance your trade by filtering for even better quality entries and focusing only on high-quality reversal or correction setups. It can be also used with other indicators and suitable with other personalised strategies.

Parabolic RSI [ChartPrime]The Parabolic RSI indicator applies the Parabolic SAR directly to the Relative Strength Index (RSI) . This combination helps traders identify trend shifts and potential reversal points within the RSI framework. The indicator provides both regular and strong signals based on whether the Parabolic SAR crosses above or below key RSI thresholds.
⯁ KEY FEATURES
Parabolic SAR Applied to RSI – Tracks momentum shifts within the RSI indicator.
Dynamic SAR Dots – Plots SAR levels directly on the RSI for visual clarity.
Threshold-Based Signal Filtering – Uses upper (70) and lower (30) RSI levels to determine strong signals.
Simple and Strong Signal System :
Big Diamonds (Strong Signals) – Appear when Parabolic SAR crosses above 70 or below 30 RSI, indicating potential reversals.
Small Diamonds (Regular Signals) – Appear when Parabolic SAR flips inside the RSI range, signaling weaker trend shifts.
Chart Overlay Signals – Highlights strong RSI-based trend shifts directly on the price chart.
Fully Customizable – Modify RSI length, SAR parameters, colors, and signal displays.
⯁ HOW TO USE
Look for strong signals (big diamonds) when SAR flips above 70 RSI (overbought) or below 30 RSI (oversold) for potential reversals.
Use regular signals (small diamonds) for minor trend shifts within the RSI range.
Combine with price action and other indicators to confirm entry and exit points.
Adjust the SAR acceleration factors to fine-tune sensitivity based on market conditions.
⯁ CONCLUSION
The Parabolic RSI indicator merges trend-following and momentum-based analysis by applying the Parabolic SAR to RSI. This allows traders to detect trend shifts inside the RSI space with an intuitive diamond-based signal system . Whether used alone or as part of a broader trading strategy, this indicator provides a clear and structured approach to identifying momentum reversals and potential trading opportunities.

MTF RSI & SMA Crossover [OB/OS Filtered Signals]MTF RSI & SMA Crossover
This custom indicator combines the power of Multi-Timeframe (MTF) RSI, Simple Moving Average (SMA), and overbought/oversold (OB/OS) conditions to provide precise buy and sell signals based on the crossovers of the RSI and its SMA. The indicator includes the following features:
MTF RSI: The Relative Strength Index (RSI) is calculated on a customizable timeframe, giving traders the ability to analyze price momentum across different timeframes.
SMA of RSI: The RSI is smoothed using a Simple Moving Average (SMA), helping to filter out market noise and identify clearer trend reversals.
Overbought/Oversold Filter: Signals are only triggered when the RSI has been in an overbought (above 70) or oversold (below 30) condition, improving the reliability of potential trend reversals.
Buy/Sell Signals:
Buy signals occur when the RSI crosses above its SMA after being oversold, indicating potential upward momentum.
Sell signals occur when the RSI crosses below its SMA after being overbought, indicating potential downward momentum.
Customizable Label Colors: Choose your own colors for the "BUY" and "SELL" labels to match your chart's design and preferences.
Alerts: Set alerts for buy and sell signals, ensuring you don't miss a potential trade.
This indicator is ideal for traders who want to capture trend reversals and momentum shifts while filtering out false signals by using overbought and oversold conditions. Customize the settings to suit your trading style and strategy.

Constance Brown RSI with Composite IndexConstance Brown RSI with Composite Index
Overview
This indicator combines Constance Brown's RSI interpretation methodology with a Composite Index and ATR Distance to VWAP measurement to provide a comprehensive trading tool. It helps identify trends, momentum shifts, overbought/oversold conditions, and potential reversal points.
Key Features
Color-coded RSI zones for immediate trend identification
Composite Index for momentum analysis and divergence detection
ATR Distance to VWAP for identifying extreme price deviations
Automatic divergence detection for early reversal warnings
Pre-configured alerts for key trading signals
How to Use This Indicator
Trend Identification
The RSI line changes color based on its position:
Blue zone (RSI > 50): Bullish trend - look for buying opportunities
Purple zone (RSI < 50): Bearish trend - look for selling opportunities
Gray zone (RSI 40-60): Neutral/transitional market - prepare for potential breakout
The 40-50 area (light blue fill) acts as support during uptrends, while the 50-60 area (light purple fill) acts as resistance during downtrends.
// From the code:
upTrendZone = rsiValue > 50 and rsiValue <= 90
downTrendZone = rsiValue < 50 and rsiValue >= 10
neutralZone = rsiValue > 40 and rsiValue < 60
rsiColor = neutralZone ? neutralRSI : upTrendZone ? upTrendRSI : downTrendRSI
Momentum Analysis
The Composite Index (fuchsia line) provides momentum confirmation:
Values above 50 indicate positive momentum
Values below 40 indicate negative momentum
Crossing above/below these thresholds signals potential momentum shifts
// From the code:
compositeIndexRaw = rsiChange / ta.stdev(rsiValue, rsiLength)
compositeIndex = ta.sma(compositeIndexRaw, compositeSmoothing)
compositeScaled = compositeIndex * 10 + 50 // Scaled to fit 0-100 range
Overbought/Oversold Detection
The ATR Distance to VWAP table in the top-right corner shows how far price has moved from VWAP in terms of ATR units:
Extreme positive values (orange/red): Potentially overbought
Extreme negative values (purple/red): Potentially oversold
Near zero (gray): Price near average value
// From the code:
priceDistance = (close - vwapValue) / ta.atr(atrPeriod)
// Color coding based on distance value
Divergence Trading
The indicator automatically detects divergences between the Composite Index and price:
Bullish divergence: Price makes lower low but Composite Index makes higher low
Bearish divergence: Price makes higher high but Composite Index makes lower high
// From the code:
divergenceBullish = ta.lowest(compositeIndex, rsiLength) > ta.lowest(close, rsiLength)
divergenceBearish = ta.highest(compositeIndex, rsiLength) < ta.highest(close, rsiLength)
Trading Strategies
Trend Following
1. Identify the trend using RSI color:
Blue = Uptrend, Purple = Downtrend
2. Wait for pullbacks to support/resistance zones:
In uptrends: Buy when RSI pulls back to 40-50 zone and bounces
In downtrends: Sell when RSI rallies to 50-60 zone and rejects
3. Confirm with Composite Index:
Uptrends: Composite Index stays above 50 or quickly returns above it
Downtrends: Composite Index stays below 50 or quickly returns below it
4. Manage risk using ATR Distance:
Take profits when ATR Distance reaches extreme values
Place stops beyond recent swing points
Reversal Trading
1. Look for divergences
Bullish: Price makes lower low but Composite Index makes higher low
Bearish: Price makes higher high but Composite Index makes lower high
2. Confirm with ATR Distance:
Extreme readings suggest potential reversals
3. Wait for RSI zone transition:
Bullish: RSI crosses above 40 (purple to neutral/blue)
Bearish: RSI crosses below 60 (blue to neutral/purple)
4. Enter after confirmation:
Use candlestick patterns for precise entry
Place stops beyond the divergence point
Four pre-configured alerts are available:
Momentum High: Composite Index above 50
Momentum Low: Composite Index below 40
Bullish Divergence: Composite Index higher low
Bearish Divergence: Composite Index lower high
Customization
Adjust these parameters to optimize for your trading style:
RSI Length: Default 14, lower for more sensitivity, higher for fewer signals
Composite Index Smoothing: Default 10, lower for quicker signals, higher for less noise
ATR Period: Default 14, affects the ATR Distance to VWAP calculation
This indicator works well across various markets and timeframes, though the default settings are optimized for daily charts. Adjust parameters for shorter or longer timeframes as needed.
Happy trading!

ScalpSwing Pro SetupScript Overview
This script is a multi-tool setup designed for both scalping (1m–5m) and swing trading (1H–4H–Daily). It combines the power of trend-following , momentum , and mean-reversion tools:
What’s Included in the Script
1. EMA Indicators (20, 50, 200)
- EMA 20 (blue) : Short-term trend
- EMA 50 (orange) : Medium-term trend
- EMA 200 (red) : Long-term trend
- Use:
- EMA 20 crossing above 50 → bullish trend
- EMA 20 crossing below 50 → bearish trend
- Price above 200 EMA = uptrend bias
2. VWAP (Volume Weighted Average Price)
- Shows the average price weighted by volume
- Best used in intraday (1m to 15m timeframes)
- Use:
- Price bouncing from VWAP = reversion trade
- Price far from VWAP = likely pullback incoming
3. RSI (14) + Key Levels
- Shows momentum and overbought/oversold zones
- Levels:
- 70 = Overbought (potential sell)
- 30 = Oversold (potential buy)
- 50 = Trend confirmation
- Use:
- RSI 30–50 in uptrend = dip buying zone
- RSI 70–50 in downtrend = pullback selling zone
4. MACD Crossovers
- Standard MACD with histogram & cross alerts
- Shows trend momentum shifts
- Green triangle = Bullish MACD crossover
- Red triangle = Bearish MACD crossover
- Use:
- Confirm swing trades with MACD crossover
- Combine with RSI divergence
5. Buy & Sell Signal Logic
BUY SIGNAL triggers when:
- EMA 20 crosses above EMA 50
- RSI is between 50 and 70 (momentum bullish, not overbought)
SELL SIGNAL triggers when:
- EMA 20 crosses below EMA 50
- RSI is between 30 and 50 (bearish momentum, not oversold)
These signals appear as:
- BUY : Green label below the candle
- SELL : Red label above the candle
How to Trade with It
For Scalping (1m–5m) :
- Focus on EMA crosses near VWAP
- Confirm with RSI between 50–70 (buy) or 50–30 (sell)
- Use MACD triangle as added confluence
For Swing (1H–4H–Daily) :
- Look for EMA 20–50 cross + price above EMA 200
- Confirm trend with MACD and RSI
- Trade breakout or pullback depending on structure

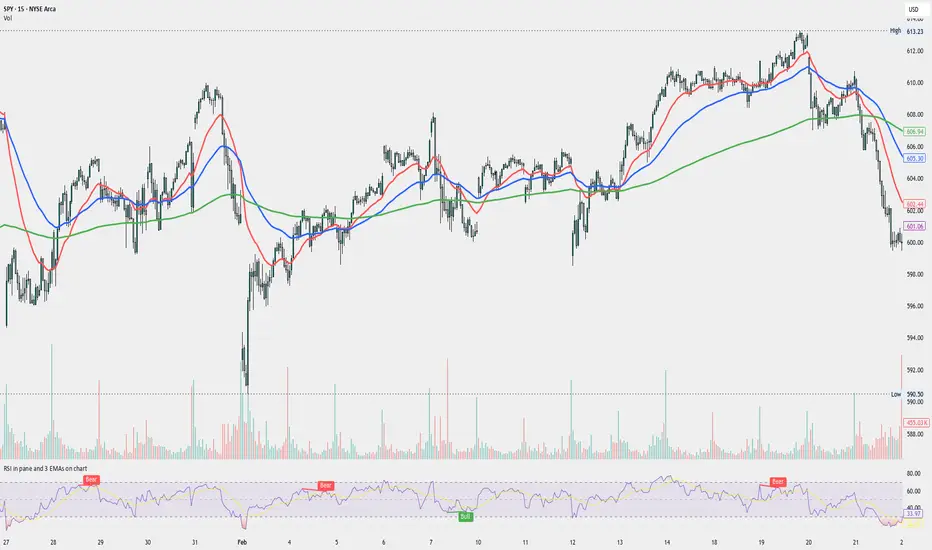
RSI in pane and 3 EMAs on chartCustom RSI in Pane + 3 EMAs on Chart — with Optional RSI Divergence Detection
Combines RSI in a separate pane with 3 EMAs on the chart and optional RSI-based divergence detection. Useful for analyzing both momentum and trend structure.
Features
RSI Pane
Custom RSI calculation (not built-in ta.rsi) with adjustable source and length
Overlay optional moving average (SMA, EMA, SMMA/RMA, WMA, VWMA, or Bollinger Bands) Overbought/oversold gradient fill for visual clarity (70 / 30 zones)
Midline (50) for neutral RSI territory
RSI Divergence Detection
Optional: toggle on/off with one input
Regular Bullish Divergence : Price makes a lower low, RSI makes a higher low
Regular Bearish Divergence : Price makes a higher high, RSI makes a lower high
Customizable lookback for pivot detection
Visual markers and labels plotted on RSI
Built-in alert conditions for both divergence types
3 EMA Trend Indicators on Price Chart
Three customizable EMAs (default: 20, 50, 200)
Color-coded and clearly plotted on main chart
Use to determine short/mid/long-term trend bias
No repainting or smoothing artifacts
Why use this script?
Gives a full view of trend + momentum without cluttering the main price chart, and it helps confirm entries and exits by observing RSI behavior alongside EMAs. The optional divergence detection can act as a signal for potential exhaustion or reversal (not entry signals on their own). It is a Good fit for traders who use RSI zones, divergences, and EMA structure in their decision-making, both for intra-day and swing trades (where it performs best).
How to use
Add this script to your chart. EMAs will appear on the main price chart; RSI and divergence will appear in a separate pane.
Adjust RSI and MA settings to fit your trading style (e.g., fast RSI for scalping, slower for swing)
Enable "Show Divergence" if you want visual alerts and markers
Use alerts to get notified when a divergence occurs without watching the chart
Always check the divergences on different time frames to validate the setup, and do not consider them valid on small time frames (<15 minutes).
Built for traders who want both momentum and trend context in a single tool — without clutter, repainting, or noise. I created this script to streamline my own analysis and avoid switching between multiple indicators. It's not meant to be a "signal generator" but a visual assistant for making better decisions. If you find it useful or have feedback, feel free to reach out.
Machine Learning RSI ║ BullVisionOverview:
Introducing the Machine Learning RSI with KNN Adaptation – a cutting-edge momentum indicator that blends the classic Relative Strength Index (RSI) with machine learning principles. By leveraging K-Nearest Neighbors (KNN), this indicator aims at identifying historical patterns that resemble current market behavior and uses this context to refine RSI readings with enhanced sensitivity and responsiveness.
Unlike traditional RSI models, which treat every market environment the same, this version adapts in real-time based on how similar past conditions evolved, offering an analytical edge without relying on predictive assumptions.
Key Features:
🔁 KNN-Based RSI Refinement
This indicator uses a machine learning algorithm (K-Nearest Neighbors) to compare current RSI and price action characteristics to similar historical conditions. The resulting RSI is weighted accordingly, producing a dynamically adjusted value that reflects historical context.
📈 Multi-Feature Similarity Analysis
Pattern similarity is calculated using up to five customizable features:
RSI level
RSI momentum
Volatility
Linear regression slope
Price momentum
Users can adjust how many features are used to tailor the behavior of the KNN logic.
🧠 Machine Learning Weight Control
The influence of the machine learning model on the final RSI output can be fine-tuned using a simple slider. This lets you blend traditional RSI and machine learning-enhanced RSI to suit your preferred level of adaptation.
🎛️ Adaptive Filtering
Additional smoothing options (Kalman Filter, ALMA, Double EMA) can be applied to the RSI, offering better visual clarity and helping to reduce noise in high-frequency environments.
🎨 Visual & Accessibility Settings
Custom color palettes, including support for color vision deficiencies, ensure that trend coloring remains readable for all users. A built-in neon mode adds high-contrast visuals to improve RSI visibility across dark or light themes.
How It Works:
Similarity Matching with KNN:
At each candle, the current RSI and optional market characteristics are compared to historical bars using a KNN search. The algorithm selects the closest matches and averages their RSI values, weighted by similarity. The more similar the pattern, the greater its influence.
Feature-Based Weighting:
Similarity is determined using normalized values of the selected features, which gives a more refined result than RSI alone. You can choose to use only 1 (RSI) or up to all 5 features for deeper analysis.
Filtering & Blending:
After the machine learning-enhanced RSI is calculated, it can be optionally smoothed using advanced filters to suppress short-term noise or sharp spikes. This makes it easier to evaluate RSI signals in different volatility regimes.
Parameters Explained:
📊 RSI Settings:
Set the base RSI length and select your preferred smoothing method from 10+ moving average types (e.g., EMA, ALMA, TEMA).
🧠 Machine Learning Controls:
Enable or disable the KNN engine
Select how many nearest neighbors to compare (K)
Choose the number of features used in similarity detection
Control how much the machine learning engine affects the RSI calculation
🔍 Filtering Options:
Enable one of several advanced smoothing techniques (Kalman Filter, ALMA, Double EMA) to adjust the indicator’s reactivity and stability.
📏 Threshold Levels:
Define static overbought/oversold boundaries or reference dynamically adjusted thresholds based on historical context identified by the KNN algorithm.
🎨 Visual Enhancements:
Select between trend-following or impulse coloring styles. Customize color palettes to accommodate different types of color blindness. Enable neon-style effects for visual clarity.
Use Cases:
Swing & Trend Traders
Can use the indicator to explore how current RSI readings compare to similar market phases, helping to assess trend strength or potential turning points.
Intraday Traders
Benefit from adjustable filters and fast-reacting smoothing to reduce noise in shorter timeframes while retaining contextual relevance.
Discretionary Analysts
Use the adaptive OB/OS thresholds and visual cues to supplement broader confluence zones or market structure analysis.
Customization Tips:
Higher Volatility Periods: Use more neighbors and enable filtering to reduce noise.
Lower Volatility Markets: Use fewer features and disable filtering for quicker RSI adaptation.
Deeper Contextual Analysis: Increase KNN lookback and raise the feature count to refine pattern recognition.
Accessibility Needs: Switch to Deuteranopia or Monochrome mode for clearer visuals in specific color vision conditions.
Final Thoughts:
The Machine Learning RSI combines familiar momentum logic with statistical context derived from historical similarity analysis. It does not attempt to predict price action but rather contextualizes RSI behavior with added nuance. This makes it a valuable tool for those looking to elevate traditional RSI workflows with adaptive, research-driven enhancements.

RSI Full [Titans_Invest]RSI Full
One of the most complete RSI indicators on the market.
While maintaining the classic RSI foundation, our indicator integrates multiple entry conditions to generate more accurate buy and sell signals.
All conditions are fully configurable, allowing complete customization to fit your trading strategy.
⯁ WHAT IS THE RSI❓
The Relative Strength Index (RSI) is a technical analysis indicator developed by J. Welles Wilder. It measures the magnitude of recent price movements to evaluate overbought or oversold conditions in a market. The RSI is an oscillator that ranges from 0 to 100 and is commonly used to identify potential reversal points, as well as the strength of a trend.
⯁ HOW TO USE THE RSI❓
The RSI is calculated based on average gains and losses over a specified period (usually 14 periods). It is plotted on a scale from 0 to 100 and includes three main zones:
Overbought: When the RSI is above 70, indicating that the asset may be overbought.
Oversold: When the RSI is below 30, indicating that the asset may be oversold.
Neutral Zone: Between 30 and 70, where there is no clear signal of overbought or oversold conditions.
⯁ ENTRY CONDITIONS
The conditions below are fully flexible and allow for complete customization of the signal.
______________________________________________________
🔹 CONDITIONS TO BUY 📈
______________________________________________________
• Signal Validity: The signal will remain valid for X bars .
• Signal Sequence: Configurable as AND/OR .
📈 RSI Conditions:
🔹 RSI > Upper
🔹 RSI < Upper
🔹 RSI > Lower
🔹 RSI < Lower
🔹 RSI > Middle
🔹 RSI < Middle
🔹 RSI > MA
🔹 RSI < MA
📈 MA Conditions:
🔹 MA > Upper
🔹 MA < Upper
🔹 MA > Lower
🔹 MA < Lower
📈 Crossovers:
🔹 RSI (Crossover) Upper
🔹 RSI (Crossunder) Upper
🔹 RSI (Crossover) Lower
🔹 RSI (Crossunder) Lower
🔹 RSI (Crossover) Middle
🔹 RSI (Crossunder) Middle
🔹 RSI (Crossover) MA
🔹 RSI (Crossunder) MA
🔹 MA (Crossover) Upper
🔹 MA (Crossunder) Upper
🔹 MA (Crossover) Lower
🔹 MA (Crossunder) Lower
📈 RSI Divergences:
🔹 RSI Divergence Bull
🔹 RSI Divergence Bear
______________________________________________________
______________________________________________________
🔸 CONDITIONS TO SELL 📉
______________________________________________________
• Signal Validity: The signal will remain valid for X bars .
• Signal Sequence: Configurable as AND/OR .
📉 RSI Conditions:
🔸 RSI > Upper
🔸 RSI < Upper
🔸 RSI > Lower
🔸 RSI < Lower
🔸 RSI > Middle
🔸 RSI < Middle
🔸 RSI > MA
🔸 RSI < MA
📉 MA Conditions:
🔸 MA > Upper
🔸 MA < Upper
🔸 MA > Lower
🔸 MA < Lower
📉 Crossovers:
🔸 RSI (Crossover) Upper
🔸 RSI (Crossunder) Upper
🔸 RSI (Crossover) Lower
🔸 RSI (Crossunder) Lower
🔸 RSI (Crossover) Middle
🔸 RSI (Crossunder) Middle
🔸 RSI (Crossover) MA
🔸 RSI (Crossunder) MA
🔸 MA (Crossover) Upper
🔸 MA (Crossunder) Upper
🔸 MA (Crossover) Lower
🔸 MA (Crossunder) Lower
📉 RSI Divergences:
🔸 RSI Divergence Bull
🔸 RSI Divergence Bear
______________________________________________________
______________________________________________________
🤖 AUTOMATION 🤖
• You can automate the BUY and SELL signals of this indicator.
______________________________________________________
______________________________________________________
⯁ UNIQUE FEATURES
______________________________________________________
Signal Validity: The signal will remain valid for X bars
Signal Sequence: Configurable as AND/OR
Condition Table: BUY/SELL
Condition Labels: BUY/SELL
Plot Labels in the Graph Above: BUY/SELL
Automate and Monitor Signals/Alerts: BUY/SELL
Signal Validity: The signal will remain valid for X bars
Signal Sequence: Configurable as AND/OR
Condition Table: BUY/SELL
Condition Labels: BUY/SELL
Plot Labels in the Graph Above: BUY/SELL
Automate and Monitor Signals/Alerts: BUY/SELL
______________________________________________________
📜 SCRIPT : RSI Full
🎴 Art by : @Titans_Invest & @DiFlip
👨💻 Dev by : @Titans_Invest & @DiFlip
🎑 Titans Invest — The Wizards Without Gloves 🧤
✨ Enjoy the Spell!
______________________________________________________
o Mission 🗺
• Inspire Traders to manifest Magic in the Market.
o Vision 𐓏
• To elevate collective Energy 𐓷𐓏

Trading-Focused RSI with Quality SignalsOverview
Transforms the classic Relative Strength Index into a comprehensive trading system that delivers clear, high-quality signals. Unlike basic RSI indicators that leave interpretation to the trader, TraderRSI filters out noise and highlights only the most promising trading opportunities.
Key Features
Signal Quality Over Quantity
Smart Divergence Detection that identifies only significant, tradable divergences (not every minor oscillation)
Automated Signal Confirmation requiring persistence for multiple bars to eliminate false signals
Clear BUY/SELL Labels appear only on high-probability setups where multiple conditions align
Enhanced Visualization
Color-Coded RSI Line instantly communicates bullish/bearish momentum
Signal Line Crossovers to confirm trend changes early
Trend-Based Background Coloring providing immediate market context
Uncluttered Chart designed specifically for day traders and swing traders
Integrated Market Context
Optional Trend Filter using a 50-period moving average for directional bias
Overbought/Oversold Zones with subtle background highlighting
Divergence Strength Filtering ensures only meaningful divergences are displayed
Trading Applications
For Day Traders
Find precise entry and exit points with clear visual signals. Divergence signals combined with RSI crossovers provide powerful intraday setups.
For Swing Traders
The quality-focused signal system identifies only high-probability trend reversals, perfect for multi-day positions. Background coloring provides immediate trend context.
For Investors
Easily identify overbought or oversold conditions in your watchlist. The trend filter helps distinguish between temporary pullbacks and major reversals.
How to Use
Strong Buy Signal: When a green "BUY" label appears, RSI has crossed above the oversold level with bullish divergence confirmation and (optional) trend alignment
Strong Sell Signal: When a red "SELL" label appears, RSI has crossed below the overbought level with bearish divergence confirmation and (optional) trend alignment
Alert System: Set alerts on any of the eight customizable conditions to never miss a quality trade setup

Smooth Gradient RSIThe RSI READY NO1 is a custom-designed Relative Strength Index (RSI) indicator that visually enhances the classic RSI functionality with modern aesthetics and user-friendly features. Its purpose is to provide smooth and clear insights into price momentum and potential reversal zones.
**Key Features**:
- **Smooth Gradient Line**: The RSI line dynamically changes color from green (low RSI values) to red (high RSI values) through a gradient transition. This visually intuitive representation highlights changes in momentum and overbought/oversold conditions.
- **Customizable Background**: Users can select their preferred background color to enhance visual clarity and suit their personal preferences or chart themes.
- **Precise Levels Marking**: The Overbought Level (default: 70) and Oversold Level (default: 30) are marked with white dashed lines of thickness 2, ensuring clear visibility of critical zones.
**Visual Enhancements**:
- The gradient feature makes the RSI more visually appealing, helping traders quickly identify shifts in market momentum.
- Clean design ensures focus remains on the RSI line, with minimal distractions.
**Usability**:
- Designed for easy integration into charts with parameters customizable directly from the interface.
- Compatible with TradingView platform, leveraging Pine Script Version 5.
This indicator is ideal for traders who prioritize visual clarity and customization, providing enhanced insights into market trends and dynamics.

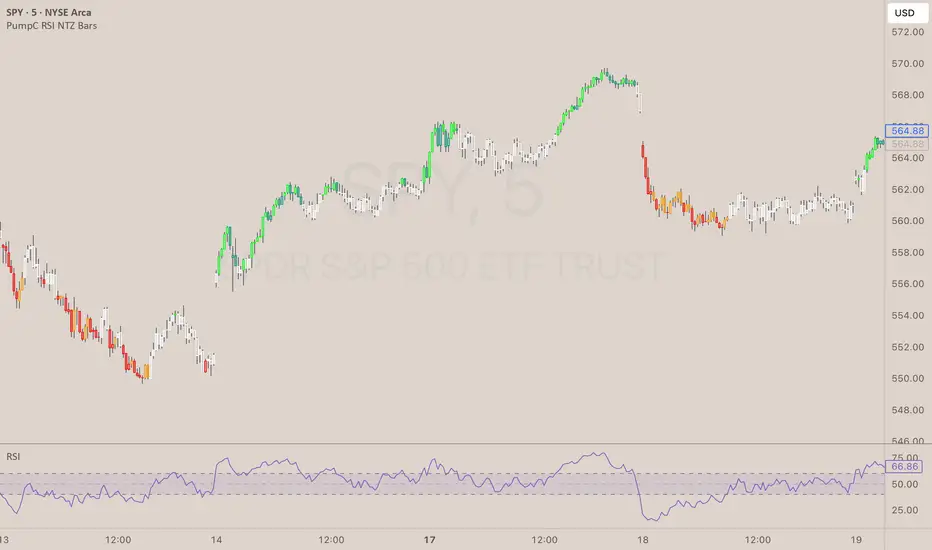
PumpC RSI NTZ BarsPumpC RSI NTZ Bars — Slope-Aware RSI Momentum Overlay
The PumpC RSI NTZ Bars indicator builds on the classic RSI by combining it with slope detection and custom bar highlighting, helping traders quickly identify strong momentum breakouts while avoiding sideways chop — the (NTZ) or No Trade Zone .
What is (NTZ)?
(NTZ) stands for No Trade Zone — the neutral RSI area between bullish and bearish thresholds. In this zone, RSI lacks directional strength, which often reflects indecision or consolidation in price. This indicator helps visually separate the chop from true momentum, so you can trade the breakout, not the noise .
Core Features
Dynamic RSI-Based Bar Coloring with Slope Awareness
Bars change color based on RSI value and its slope:
Bright Green: RSI ≥ Bullish Threshold and sloping upward
Teal Green: RSI ≥ Bullish Threshold but sloping downward
Bright Red: RSI ≤ Bearish Threshold and sloping downward
Orange: RSI ≤ Bearish Threshold but sloping upward
White: RSI is between thresholds (NTZ)
Slope Detection Logic
RSI slope is used to confirm directional bias and filter out weak or fading momentum.
Clean Visual Integration
Choose how signals appear: full bar color, border-only style, background shading, or a mix of all three.
RSI Smoothing Option
Optional smoothing to reduce noise — especially useful on faster timeframes.
Built-In Alerts
RSI crossing above the bullish threshold with an upward slope
RSI crossing below the bearish threshold with a downward slope
User Inputs & Customization Options
RSI Length: Default 14
RSI Source: Default Close
Smooth RSI: On or Off
Smoothing Length: Default 2
Bullish Threshold: Default 60
Bearish Threshold: Default 40
Bar Highlight Style: Full Bar or Border Only
Display Mode: Bar Color, Background, or Both
How to Use It
Step 1 – Adjust Your RSI Settings:
Start by setting the RSI Length (default is 14) and choosing which price source to use — typically close , but you can experiment with hl2 , ohlc4 , etc.
You can also turn on smoothing if you want to reduce noise, especially on fast timeframes like the 1m or 5m chart.
Step 2 – Define Your No Trade Zone (NTZ):
The NTZ is the space between the bullish and bearish thresholds (default 60 and 40).
This is where momentum is weak and price is often ranging or chopping. You don’t want to trade in this zone — you're waiting for RSI to break out of it with conviction.
Step 3 – Choose Your Visual Style:
You can choose to: Highlight the entire candle (Full Bar)
Just highlight the outline (Border Only)
Add a background color behind the chart
Or use a combination of the above This makes the signal easy to see without changing your whole chart look.
Step 4 – Read the Colors for Quick Clarity:
Bright Green / Bright Red = Strong Momentum (with RSI slope confirmation)
Teal / Orange = Momentum is weakening — RSI value is above/below threshold but losing slope strength
White = RSI is in the No Trade Zone (NTZ) — not enough strength to trade
Use this color feedback to stay out during weak periods and act when the trend gains strength.
Step 5 – Use Alerts for Clean Signals:
Set alerts when RSI breaks out of the NTZ with slope confirmation .
These are high-quality signals you can use to trigger your setups or review potential entries.
Disclaimer
This indicator is for educational and informational purposes only and should not be considered financial advice. Always combine tools like this with proper market context and risk management.
RSI Support & Resistance Breakouts with OrderblocksThis tool is an overly simplified method of finding market squeeze and breakout completely based on a dynamic RSI calculation. It is designed to draw out areas of price levels where the market is pushing back against price action leaving behind instances of short term support and resistance levels you otherwise wouldn't see with the common RSI.
It uses the changes in market momentum to determine support and resistance levels in real time while offering price zone where order blocks exist in the short term.
In ranging markets we need to know a couple things.
1. External Zone - It's important to know where the highs and lows were left behind as they hold liquidity. Here you will have later price swings and more false breakouts.
2. Internal Zone - It's important to know where the highest and lowest closing values were so we can see the limitations of that squeeze. Here you will find the stronger cluster of orders often seen as orderblocks.
In this tool I've added a 200 period Smoothed Moving Average as a trend filter which causes the RSI calculation to change dynamically.
Regular Zones - without extending
The Zones draw out automatically but are often too small to work with.
To solve this problem, you can extend the zones into the future up to 40 bars.
This allows for more visibility against future price action.
--------------------------------------------
Two Types of Zones
External Zones - These zones give you positioning of the highest and lowest price traded within the ranging market. This is where liquidity will be swept and often is an ultimate breaking point for new price swings.
How to use them :
External Zones - External zones form at the top of a pullback. After this price should move back into its impulsive wave.
During the next corrective way, if price breaches the top of the previous External Zone, this is a sign of trend weakness. Expect a divergence and trend reversal.
Internal Zones - (OrderBlocks) Current price will move in relation to previous internal zones. The internal zone is where a majority of price action and trading took place. It's a stronger SQUEEZE area. Current price action will often have a hard time closing beyond the previous Internal Zones high or low. You can expect these zones to show you where the market will flip over. In these same internal zones you'll find large rejection candles.
**Important Note** Size Doesn't Matter
The size of the internal zone does not matter. It can be very small and still very powerful.
Once an internal zone has been hit a few times, its often not relevant any longer.
Order Block Zone Examples
In this image you can see the Internal Zone that was untouched had a STRONG price reaction later on.
Internal Zones that were touched multiple times had weak reactions later as price respected them less over time.
Zone Overlay Breakdown
The Zones form and update in real time until momentum has picked up and price begins to trend. However it leaves behind the elements of the inducement area and all the key levels you need to know about for future price action.
Resistance Fakeout : Later on after the zone has formed, price will return to this upper zone of price levels and cause fakeouts. A close above this zone implies the market moves long again.
Midline Equilibrium : This is simply the center of the strongest traded area. We can call this the Point of Control within the orderblock. If price expands through both extremes of this zone multiple times in the future, it eliminates the orderblock.
Support Fakeout : Just like its opposing brother, price will wick through this zone and rip back causing inducement to trap traders. You would need a clear close below this zone to be in a bearish trend.
BARCOLOR or Candle Color: (Optional)
Bars are colored under three conditions
Bullish Color = A confirmed bullish breakout of the range.
Bearish Color = A confirmed bearish breakout of the range.
Squeeze Color = Even if no box is formed a candle or candles can have a squeeze color. This means the ranging market happened within the high and low of that singular candle.

RSI + ADX + ATR Combo Indicator: RSI + ADX + ATR Combo Filter
This indicator is a confluence filter tool that combines RSI, ADX, and ATR into a single, easy-to-read chart overlay. It is designed to help traders identify low-volatility, non-trending zones with balanced momentum—ideal for strategies that rely on breakouts or reversals.
🔍 Core Components:
RSI (Relative Strength Index)
Standard RSI with custom upper and lower bounds (default: 60 and 40).
Filters out extreme overbought/oversold regions and focuses on price consolidation zones.
ADX (Average Directional Index)
Measures trend strength.
When ADX is below a custom threshold (default: 20), it indicates a weak or range-bound trend.
ATR (Average True Range)
Represents volatility.
Low ATR values (default threshold: 2.5) are used to filter out high-volatility environments, helping refine entries.
🟣 Signal Logic:
A signal is highlighted with a background color when all three conditions are met:
RSI is between lower and upper bounds (e.g., 40 < RSI < 60) ✅
ADX is below the trend threshold (e.g., ADX < 20) ✅
ATR is below the volatility threshold (e.g., ATR < 2.5) ✅
These combined conditions suggest a low-volatility, low-trend strength, and balanced momentum zone—perfect for anticipating breakouts or strong directional moves.

Trailing Monster StrategyTrailing Monster Strategy
This is an experimental trend-following strategy that incorporates a custom adaptive moving average (PKAMA), RSI-based momentum filtering, and dynamic trailing stop-loss logic. It is designed for educational and research purposes only, and may require further optimization or risk management considerations prior to live deployment.
Strategy Logic
The strategy attempts to participate in sustained price trends by combining:
- A Power Kaufman Adaptive Moving Average (PKAMA) for dynamic trend detection,
- RSI and Simple Moving Average (SMA) filters for market condition confirmation,
- A delayed trailing stop-loss to manage exits once a trade is in profit.
Entry Conditions
Long Entry:
- RSI exceeds the overbought threshold (default: 70),
- Price is trading above the 200-period SMA,
- PKAMA slope is positive (indicating upward momentum),
- A minimum number of bars have passed since the last entry.
Short Entry:
- RSI falls below the oversold threshold (default: 30),
- Price is trading below the 200-period SMA,
- PKAMA slope is negative (indicating downward momentum),
-A minimum number of bars have passed since the last entry.
Exit Conditions
- A trailing stop-loss is applied once the position has been open for a user-defined number of bars.
- The trailing distance is calculated as a fixed percentage of the average entry price.
Technical Notes
This script implements a custom version of the Power Kaufman Adaptive Moving Average (PKAMA), conceptually inspired by alexgrover’s public implementation on TradingView .
Unlike traditional moving averages, PKAMA dynamically adjusts its responsiveness based on recent market volatility, allowing it to better capture trend changes in fast-moving assets like altcoins.
Disclaimer
This strategy is provided for educational purposes only.
It is not financial advice, and no guarantee of profitability is implied.
Always conduct thorough backtesting and forward testing before using any strategy in a live environment.
Adjust inputs based on your individual risk tolerance, asset class, and trading style.
Feedback is encouraged. You are welcome to fork and modify this script to suit your own preferences and market approach.

Scalping all timeframe EMA & RSIEMA 50 and EMA 100 combined with RSI 14
Should also be accompanied by the RSI 14 chart.
With the following conditions:
IF the EMAs are close but not crossing:
* Be prepared to take a Sell position if the first Bearish Candlestick crosses the lowest EMA, and the RSI value is equal to or below 40.
* Be prepared to take a Buy position if the first Bullish Candlestick crosses the highest EMA, and the RSI value is equal to or above 60.
IF the EMAs are overlapping and crossing:
* Be prepared to take a Sell position if the first Bearish Candlestick crosses both EMAs, and the RSI value crosses below 50.
*Be prepared to take a Buy position if the first Bullish Candlestick crosses both EMAs, and the RSI value crosses above 50.

RSI SiaThis script is a custom indicator for TradingView written in Pine Script version 5. It calculates the Relative Strength Index (RSI) and uses it to generate trading signals. Here's a breakdown of what the script does:
Key Features:
RSI Calculation:
The script calculates the RSI using a 14-period window.
It also calculates the momentum of the RSI over a 9-period window (rsi delta) and a simple moving average (SMA) of the RSI over a 3-period window (rsi sma).
Composite Index (CI):
The composite index is calculated as the sum of rsi delta and rsi sma.
Horizontal Lines and Zones:
Several horizontal lines are plotted at different levels (e.g., 20, 40, 60, 80, 120, 150, 180) to indicate overbought and oversold conditions.
Filled zones are created between certain levels to highlight areas of interest.
Moving Averages:
The script plots SMA and EMA of the RSI when Enable RSI ma is set to true.
It also plots moving averages of the composite index.
Crossover Signals:
The script detects bullish and bearish crossovers between the SMA and EMA of the RSI.
It plots shapes (labels) on the chart to indicate buy (BUY) and sell (SELL) signals based on these crossovers.
Usage:
Enable RSIma: This input allows you to enable or disable the plotting of RSI moving averages.
i1: This variable is used to adjust the vertical position of the composite index and its moving averages.
Visualization:
The RSI is plotted in black.
The RSI fast trigger line (SMA of RSI) is plotted in green when enabled.
The RSI slow trigger line (EMA of RSI) is plotted in orange when enabled.
The composite index and its moving averages are plotted in red, green, and orange.
Buy and sell signals are indicated with green and red labels, respectively.
This script can be used to identify potential trading opportunities based on RSI crossovers and the composite index.

Reversal Trading Bot Strategy[BullByte]Overview :
The indicator Reversal Trading Bot Strategy is crafted to capture potential market reversal points by combining momentum, volatility, and trend alignment filters. It uses a blend of technical indicators to identify both bullish and bearish reversal setups, ensuring that multiple market conditions are met before entering a trade.
Core Components :
Technical Indicators Used :
RSI (Relative Strength Index) :
Purpose : Detects divergence conditions by comparing recent lows/highs in price with the RSI.
Parameter : Length of 8.
Bollinger Bands (BB) :
Purpose : Measures volatility and identifies price levels that are statistically extreme.
Parameter : Length of 20 and a 2-standard deviation multiplier.
ADX (Average Directional Index) & DMI (Directional Movement Index) :
Purpose : Quantifies the strength of the trend. The ADX threshold is set at 20, and additional filters check for the alignment of the directional indicators (DI+ and DI–).
ATR (Average True Range) :
Purpose : Provides a volatility measure used to set stop levels and determine risk through trailing stops.
Volume SMA (Simple Moving Average of Volume ):
Purpose : Helps confirm strength by comparing the current volume against a 20-period average, with an optional filter to ensure volume is at least twice the SMA.
User-Defined Toggle Filters :
Volume Filter : Confirms that the volume is above average (or twice the SMA) before taking trades.
ADX Trend Alignment Filter : Checks that the ADX’s directional indicators support the trade direction.
BB Close Confirmation : Optionally refines the entry by requiring price to be beyond the upper or lower Bollinger Band rather than just above or below.
RSI Divergence Exit : Allows the script to close positions if RSI divergence is detected.
BB Mean Reversion Exit : Closes positions if the price reverts to the Bollinger Bands’ middle line.
Risk/Reward Filter : Ensures that the potential reward is at least twice the risk by comparing the distance to the Bollinger Band with the ATR.
Candle Movement Filter : Optional filter to require a minimum percentage move in the candle to confirm momentum.
ADX Trend Exit : Closes positions if the ADX falls below the threshold and the directional indicators reverse.
Entry Conditions :
Bullish Entry :
RSI Divergence : Checks if the current close is lower than a previous low while the RSI is above the previous low, suggesting bullish divergence.
Bollinger Confirmation : Requires that the price is above the lower (or upper if confirmation is toggled) Bollinger Band.
Volume & Trend Filters : Combines volume condition, ADX strength, and an optional candle momentum condition.
Risk/Reward Check : Validates that the trade meets a favorable risk-to-reward ratio.
Bearish Entry :
Uses a mirror logic of the bullish entry by checking for bearish divergence, ensuring the price is below the appropriate Bollinger level, and confirming volume, trend strength, candle pattern, and risk/reward criteria.
Trade Execution and Exit Strateg y:
Trade Execution :
Upon meeting the entry conditions, the strategy initiates a long or short position.
Stop Loss & Trailing Stops :
A stop-loss is dynamically set using the ATR value, and trailing stops are implemented as a percentage of the close price.
Exit Conditions :
Additional exit filters can trigger early closures based on RSI divergence, mean reversion (via the middle Bollinger Band), or a weakening trend as signaled by ADX falling below its threshold.
This multi-layered exit strategy is designed to lock in gains or minimize losses if the market begins to reverse unexpectedly.
How the Strategy Works in Different Market Conditions :
Trending Markets :
The ADX filter ensures that trades are only taken when the trend is strong. When the market is trending, the directional movement indicators help confirm the momentum, making the reversal signal more reliable.
Ranging Markets :
In choppy markets, the Bollinger Bands expand and contract, while the RSI divergence can highlight potential turning points. The optional filters can be adjusted to avoid false signals in low-volume or low-volatility conditions.
Volatility Management :
With ATR-based stop-losses and a risk/reward filter, the strategy adapts to current market volatility, ensuring that risk is managed consistently.
Recommendation on using this Strategy with a Trading Bot :
This strategy is well-suited for high-frequency trading (HFT) due to its ability to quickly identify reversal setups and execute trades dynamically with automated stop-loss and trailing exits. By integrating this script with a TradingView webhook-based bot or an API-driven execution system, traders can automate trade entries and exits in real-time, reducing manual execution delays and capitalizing on fast market movements.
Disclaimer :
This script is provided for educational and informational purposes only. It is not intended as investment advice. Trading involves significant risk, and you should always conduct your own research and analysis before making any trading decisions. The author is not responsible for any losses incurred while using this script.

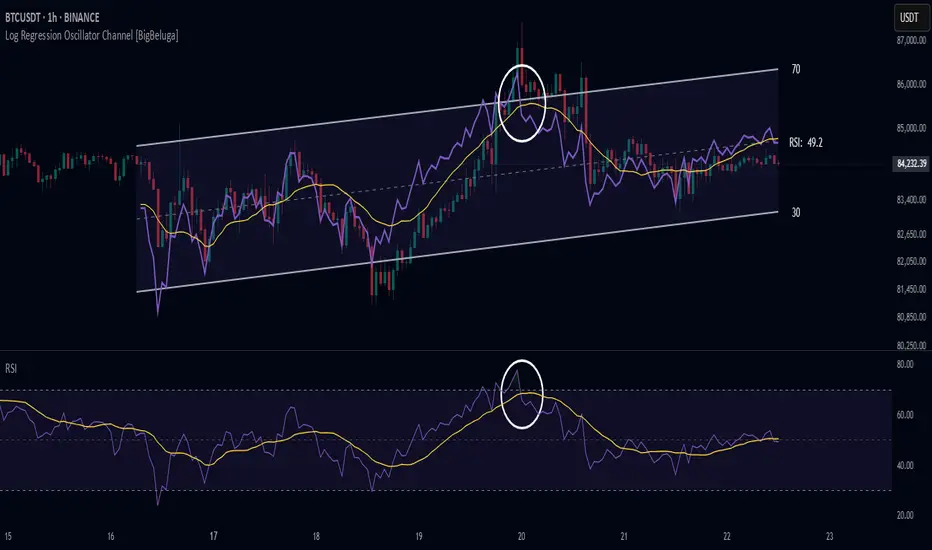
Log Regression Oscillator Channel [BigBeluga]
This unique overlay tool blends logarithmic trend analysis with dynamic oscillator behavior. It projects RSI, MFI, or Stochastic lines directly into a log regression channel on the price chart — offering an intuitive way to detect overbought/oversold momentum within the broader price structure.
🔵Key Features:
Logarithmic Regression Channel:
➣ Draws a trend-based channel using logarithmic regression, adapting to price growth curvature over time.
➣ Features upper, lower, and optional midline boundaries to visualize trend flow and range extremes.
Oscillator Overlay (RSI / MFI / Stochastic):
➣ Projects your chosen oscillator inside the channel using dynamic polylines.
➣ Allows switching between RSI, Money Flow Index, or Stochastic for versatile momentum insight.
Threshold-Based Scaling:
➣ The top and bottom of the channel represent traditional oscillator thresholds (e.g., RSI 70/30).
➣ Users can modify the scale in settings to customize what "overbought" or "oversold" means visually.
Signal Line Integration:
➣ Adds a yellow moving average (signal line) for smoother confirmation of oscillator turns.
➣ Helps identify divergence, momentum shifts, and fakeouts with better clarity.
Live Oscillator Readout:
➣ Displays the real-time oscillator value at the right edge of the chart.
➣ Ensures traders stay aware of current momentum levels without switching panels.
🔵Usage:
Momentum Context:
➣ When the oscillator touches the upper regression band, it may signal local overbought pressure.
➣ Touching the lower band may indicate oversold conditions within the current log trend.
Divergence Detection:
➣ Use the oscillator’s behavior relative to the channel slope to spot divergence from price.
➣ For example, RSI rising inside a falling channel can flag early trend shifts.
Trend-Sensitive Entries:
➣ Combine oscillator signals with log channel direction to filter trades in trend alignment.
➣ Signal line crossovers inside the channel act as early warning for momentum turns.
The Log Regression Oscillator Channel transforms how traders view classic momentum tools. By embedding oscillators into a logarithmic trend structure, it offers unmatched clarity on momentum positioning relative to price expansion. Ideal for swing traders, mean-reverters, or trend followers looking to sharpen entries and exits with style.
Smart Mean Reversion DashboardThis indicator is designed to help traders identify potential mean reversion opportunities using a combination of Bollinger Bands, RSI, and deviation from the moving average. It provides a clean, visually appealing dashboard that displays key metrics and signals in real-time.
How to Read and Use:
Deviation from Mean:
Displays the percentage deviation of the current price from the moving average.
A high positive or negative deviation may indicate overextension and a potential mean reversion opportunity.
Bollinger Band Status:
Indicates whether the price is inside or outside the Bollinger Bands.
"Outside Upper" suggests overbought conditions, while "Outside Lower" suggests oversold conditions.
RSI Status:
Shows whether the RSI is in overbought (>70), oversold (<30), or neutral conditions.
Overbought and oversold levels can confirm potential reversal zones.
Signal:
BUY: Triggered when the price is outside the lower Bollinger Band and RSI is in the oversold zone.
SELL: Triggered when the price is outside the upper Bollinger Band and RSI is in the overbought zone.
WAIT: No clear signal; wait for better conditions.
Important Notes:
This is NOT a buy or sell recommendation. This indicator is a tool to assist in identifying potential trading opportunities. Always use it in conjunction with your own analysis and risk management.
The signals generated by this indicator are based on historical data and do not guarantee future performance.
It is recommended to use this indicator alongside other technical analysis tools and confirm signals with price action or other strategies.
Features:
Dashboard: Displays deviation, Bollinger Band status, RSI status, and signals in a clean, movable interface.
Customizable Settings: Adjust Bollinger Band length, RSI length, and moving average length to suit your trading style.
Visual Enhancements: Color-coded signals and metrics for easy interpretation in both light and dark modes.
Disclaimer:
Trading involves significant risk, and past performance is not indicative of future results. This indicator is for educational purposes only and should not be considered financial advice. Always consult with a financial advisor before making trading decisions.

Smart Grid Scalping (Pullback) Strategy[BullByte]The Smart Grid Scalping (Pullback) Strategy is a high-frequency trading strategy designed for short-term traders who seek to capitalize on market pullbacks. This strategy utilizes a dynamic ATR-based grid system to define optimal entry points, ensuring precise trade execution. It integrates volatility filtering and an RSI-based confirmation mechanism to enhance signal accuracy and reduce false entries.
This strategy is specifically optimized for scalping by dynamically adjusting trade levels based on current market conditions. The grid-based system helps capture retracement opportunities while maintaining strict trade management through predefined profit targets and trailing stop-loss mechanisms.
Key Features :
1. ATR-Based Grid System :
- Uses a 10-period ATR to dynamically calculate grid levels for entry points.
- Prevents chasing trades by ensuring price has reached key levels before executing entries.
2. No Trade Zone Protection :
- Avoids low-volatility zones where price action is indecisive.
- Ensures only high-momentum trades are executed to improve success rate.
3. RSI-Based Entry Confirmation :
- Long trades are triggered when RSI is below 30 (oversold) and price is in the lower grid zone.
- Short trades are triggered when RSI is above 70 (overbought) and price is in the upper grid zone.
4. Automated Trade Execution :
- Long Entry: Triggered when price drops below the first grid level with sufficient volatility.
- Short Entry: Triggered when price exceeds the highest grid level with sufficient volatility.
5. Take Profit & Trailing Stop :
- Profit target set at a customizable percentage (default 0.2%).
- Adaptive trailing stop mechanism using ATR to lock in profits while minimizing premature exits.
6. Visual Trade Annotations :
- Clearly labeled "LONG" and "SHORT" markers appear at trade entries for better visualization.
- Grid levels are plotted dynamically to aid decision-making.
Strategy Logic :
- The script first calculates the ATR-based grid levels and ensures price action has sufficient volatility before allowing trades.
- An additional RSI filter is used to ensure trades are taken at ideal market conditions.
- Once a trade is executed, the script implements a trailing stop and predefined take profit to maximize gains while reducing risks.
---
Disclaimer :
Risk Warning :
This strategy is provided for educational and informational purposes only. Trading involves significant risk, and past performance is not indicative of future results. Users are advised to conduct their own due diligence and risk management before using this strategy in live trading.
The developer and publisher of this script are not responsible for any financial losses incurred by the use of this strategy. Market conditions, slippage, and execution quality can affect real-world trading outcomes.
Use this script at your own discretion and always trade responsibly.
