5-0 Harmonic Pattern [TradingFinder] 0XABCD 50 Harmonic Detector🔵 Introduction
Harmonic patterns are a powerful tool in technical analysis, widely used to detect reversal points and trend changes. Among these, the 5-0 Harmonic Pattern stands out due to its reliance on specific Fibonacci ratios—1.13, 1.618, 2.24, and 0.45 to 0.55—anchored at points 0, X, A, B, C, and D. This pattern provides a structured approach for identifying critical buy and sell points, helping traders achieve optimal entry and exit levels in volatile markets.
This 5-0 Harmonic Pattern indicator automatically detects and marks bullish and bearish formations on the chart, offering precise trading signals based on established harmonic ratios. With its dynamic signals, the 5-0 pattern enables traders to anticipate market movements and capitalize on favorable price trends.
Especially in fast-moving markets, harmonic patterns, particularly the 5-0 Harmonic Pattern, equip traders with an essential framework for identifying reversal opportunities and refining their trading strategies.
Bullish 5-0 Pattern :
Bearish 5-0 Pattern :
🔵 How to Use
The 5-0 Harmonic Pattern indicator is designed to automatically mark the key levels of the harmonic structure: 0, X, A, B, C, and D. By doing so, it detects both bullish and bearish patterns and helps traders recognize optimal entry and exit points.
Formed through specific Fibonacci levels, this pattern signals potential shifts in trend direction, giving traders critical insights for managing entries and exits effectively. The tool proves valuable in high-volatility settings, enabling traders to leverage these signals for refined decision-making.
🟣 Bullish 5-0 Pattern
A bullish 5-0 pattern materializes when Fibonacci levels indicate a potential price reversal to the upside. With points 0, X, A, B, C, and D in alignment, the indicator highlights this upward momentum by displaying a green arrow as a buy signal on the chart. This marking provides a clear entry point, indicating that prices are likely to rise, making it a prime moment for traders to enter long positions.
Additionally, the bullish 5-0 pattern is equipped with tools for traders to set stop-loss and take-profit points based on harmonic lines within the pattern, which represent support and resistance levels. Using these dynamic points, traders can create a more effective risk-reward setup while following the bullish signals in a standalone harmonic strategy.
🟣 Bearish 5-0 Pattern
The bearish 5-0 pattern functions similarly but signals a likely downturn. This pattern emerges when Fibonacci ratios align at points 0, X, A, B, C, and D, predicting a reversal downward. The indicator generates a sell signal, marked by a red arrow, prompting traders to exit long positions or initiate short trades to capitalize on falling prices.
Traders can utilize this bearish pattern for defining exit strategies and setting key levels for stop-loss and take-profit orders. The bearish 5-0 pattern enhances traders’ abilities to gauge critical price levels and manage trade risk effectively, especially in volatile markets. For traders focused on profiting from downward trends, this indicator serves as a powerful tool for timely entries and exits.
🔵 Setting
🟣 Logical Setting
ZigZag Pivot Period : You can adjust the period so that the harmonic patterns are adjusted according to the pivot period you want. This factor is the most important parameter in pattern recognition.
Show Valid Forma t: If this parameter is on "On" mode, only patterns will be displayed that they have exact format and no noise can be seen in them. If "Off" is, the patterns displayed that maybe are noisy and do not exactly correspond to the original pattern.
Show Formation Last Pivot Confirm : if Turned on, you can see this ability of patterns when their last pivot is formed. If this feature is off, it will see the patterns as soon as they are formed. The advantage of this option being clear is less formation of fielded patterns, and it is accompanied by the latest pattern seeing and a sharp reduction in reward to risk.
Period of Formation Last Pivot : Using this parameter you can determine that the last pivot is based on Pivot period.
🟣 Genaral Setting
Show : Enter "On" to display the template and "Off" to not display the template.
Color : Enter the desired color to draw the pattern in this parameter.
LineWidth : You can enter the number 1 or numbers higher than one to adjust the thickness of the drawing lines. This number must be an integer and increases with increasing thickness.
LabelSize : You can adjust the size of the labels by using the "size.auto", "size.tiny", "size.smal", "size.normal", "size.large" or "size.huge" entries.
🟣 Alert Setting
Alert : On / Off
Message Frequency : This string parameter defines the announcement frequency. Choices include: "All" (activates the alert every time the function is called), "Once Per Bar" (activates the alert only on the first call within the bar), and "Once Per Bar Close" (the alert is activated only by a call at the last script execution of the real-time bar upon closing). The default setting is "Once per Bar".
Show Alert Time by Time Zone : The date, hour, and minute you receive in alert messages can be based on any time zone you choose. For example, if you want New York time, you should enter "UTC-4". This input is set to the time zone "UTC" by default.
Conclusion
The 5-0 Harmonic Pattern indicator serves as a robust solution for technical analysts and traders looking to pinpoint market reversal points. By automatically recognizing 5-0 patterns and generating buy and sell signals based on Fibonacci ratios, this tool supports precise trend analysis and entry/exit timing. The indicator’s adjustable alerts, color themes, and pattern toggles allow for comprehensive customization, ensuring alignment with individual trading strategies.
Harmonic patterns, especially the 5-0 Harmonic Pattern, guide traders in identifying high-accuracy entry and exit points, thus aiding in more informed trading decisions. By combining Fibonacci ratio analysis with real-time signal updates, this indicator provides a well-rounded approach for risk management and capitalizing on trading opportunities. Professional traders can harness this tool to enhance technical analysis precision and capitalize on price trends effectively, maximizing profitability in both bullish and bearish markets.
Resistence

Revenue GridDescription:
The Revenue Grid indicator helps traders and investors visualize a stock’s valuation by plotting horizontal lines based on its price-to-sales (P/S) ratio. This tool displays how the stock price compares to multiples of its total revenue per share, giving a clear perspective on valuation benchmarks.
Fundamental Concept:
The price-to-sales ratio compares a company’s stock price to its revenue per share. It’s used to evaluate whether a stock is overvalued or undervalued based on its revenue.
This indicator offers a unique way to view this ratio by applying Fibonacci multiples to the revenue per share. It plots lines at these multiples to show how the stock price measures up against different valuation levels.
How It Works:
Data Inputs:
Total Revenue (TR): The company’s revenue over the past twelve months.
Total Shares Outstanding (TSO): The total number of shares in circulation.
Calculation:
Calculates the revenue per share (TR/TSO).
Plots lines at fixed Fibonacci multiples (e.g., 1x, 2x, 3x, 5x, 8x, 13x) of the revenue per share value.
How to Use:
1. Add the "Revenue Grid" indicator to your chart by searching for it in the indicator library and applying it.
2. Observe the lines plotted on the chart. If these lines are trending upwards, it indicates that the revenue is increasing.
3. Analyze how historical prices trend relative to these lines. Look for periods where the stock price supports around specific multiples, you can easily get a sense of overvaluation or undervaluation in certain periods.
Use this information to guide further analysis and investment decisions.
Benefits:
1. Clear Valuation View: Easily see how the company’s revenue translates into stock price levels.
2. Investment Insight: Identify if the stock price is lagging behind revenue growth, which might signal a buying opportunity.
3. Historical Context: Understand how the market has historically valued the company and assess the current valuation.
Do let me know your feedbacks in comments. Happy Investing :)

[1] Dynamic Support and Resistance with breakout [Dr Future]This script appears to be designed to identify and visualize dynamic support and resistance levels on a price chart, along with potential breakout signals.
Key Components & Functionality (Inferred):
Dynamic Support and Resistance: The script likely employs algorithms to calculate and plot support and resistance levels that adjust in real-time as price action evolves.
Breakout Detection: The script probably incorporates logic to recognize when the price breaks out of these dynamic support or resistance zones. This could trigger alerts or visual cues on the chart.
Dr Future's Approach: It's worth noting the " " tag, suggesting the script might be based on specific methodologies or insights associated with a trader or analyst known as "Dr Future." Without more context on their strategies, it's difficult to pinpoint the exact techniques used.
Potential Benefits:
Adaptive Levels: Dynamic support and resistance can offer a more responsive approach compared to static levels, as they account for changing market conditions.
Breakout Opportunities: Identifying breakouts can help traders spot potential entry or exit points.
Visual Clarity: Plotting these levels directly on the chart can provide a clearer picture of the current market structure and potential turning points.
Caveats:
False Signals: Like any technical tool, dynamic support and resistance can generate false signals. Breakouts might not always lead to sustained trends.
Parameter Sensitivity: The script's effectiveness likely depends on how its parameters are configured. Fine-tuning might be required to suit different markets or timeframes.
"Dr Future" Factor: The script's performance could be tied to the specific strategies of "Dr Future," which might not be universally applicable.
Important Note:
Without access to the actual code and a deeper understanding of "Dr Future's" methods, this description is based on inference and general knowledge of technical analysis.
Recommendation:
If you're considering using this script, it would be prudent to:
Backtest Thoroughly: Test the script on historical data to assess its performance and identify potential pitfalls.
Understand the Parameters: Familiarize yourself with the script's settings and how they impact the plotted levels and breakout signals.
Combine with Other Tools: Use this script in conjunction with other technical indicators and risk management strategies for a more holistic trading approach.

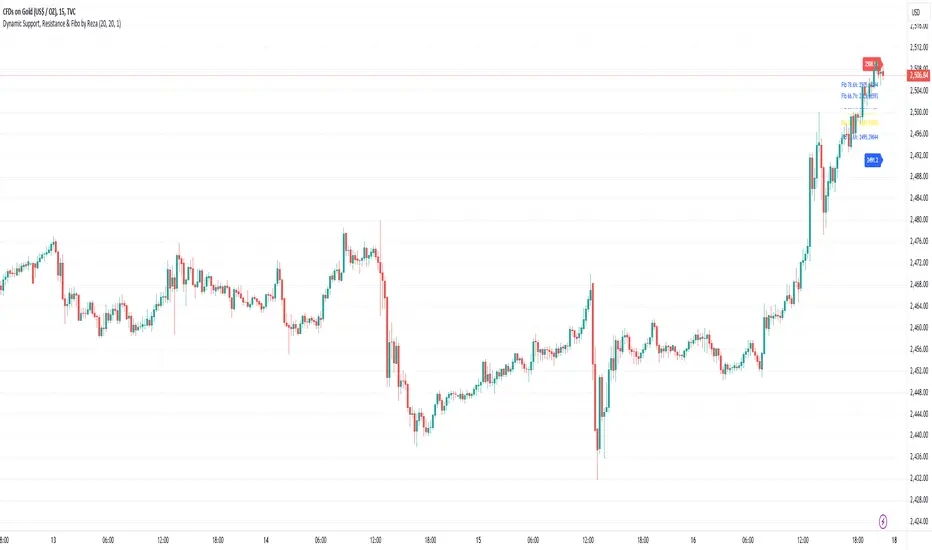
Dynamic Support, Resistance & Fibo by RezaDynamic Support, Resistance & Fibonacci Levels by Reza
This Pine Script indicator dynamically calculates and plots significant support and resistance levels, along with key Fibonacci retracement levels, based on recent price action. It provides traders with essential tools to identify crucial levels on the chart that may influence future price movements.
Key Features:
Dynamic Support and Resistance Lines:
The script identifies recent swing highs and swing lows within a customizable lookback period to determine dynamic support and resistance levels.
These levels are plotted as horizontal lines (blue for support, red for resistance) and are updated in real-time to reflect changes in the price structure.
Labels next to each line display the exact price level of the support and resistance, making it easy to identify them at a glance.
Fibonacci Retracement Levels:
The script calculates and plots Fibonacci retracement levels (23.6%, 38.2%, 50.0%, 55.9%, 61.8%, 66.7%, and 78.6%) between the identified support and resistance levels.
These Fibonacci levels are plotted as dotted lines, with customizable colors and labels for clarity.
The Fibonacci levels provide traders with potential retracement and extension levels, which are commonly used to predict price reversals, pullbacks, and continuation zones.
Customization:
Users can adjust the lookback period for swing high and swing low calculations to suit different trading styles and market conditions.
The script allows traders to enable or disable Fibonacci levels and choose whether or not to remove the background color of the labels for cleaner chart visuals.
Line width, highlight colors, and label colors are fully customizable for better integration with various chart styles and themes.
Real-Time Dashboard:
The indicator includes a real-time dashboard that calculates and displays the next potential target based on current market conditions, including potential retracement or continuation targets.
The dashboard dynamically updates based on trend direction and Fibonacci zones, giving traders valuable insights into potential price objectives.
How to Use:
This indicator is suitable for multiple timeframes, helping traders identify key levels in real-time as the market evolves.
By providing support and resistance zones along with Fibonacci retracement levels, this script offers a powerful combination of technical analysis tools for both novice and experienced traders.
The dynamic calculations help traders spot potential areas for entering or exiting trades, placing stop-loss levels, and identifying profit-taking zones.
Ideal for:
Traders who want to use support and resistance levels for trade planning.
Fibonacci enthusiasts looking for automated level plotting.
Anyone seeking to identify key price levels in real-time across different timeframes.
Script Author:
Reza – Bringing you dynamic, real-time support, resistance, and Fibonacci level plotting for more effective trading decisions.
ICT NWOG/NDOG Gaps [TradingFinder] New Opening Gaps🔵 Introduction
🟣 Understanding ICT Opening Gaps
In the realm of technical analysis, mastering the art of recognizing market behavior and pinpointing key price levels is vital for making sound trading decisions. Among the array of tools available, the concept of opening gaps stands out for its ability to provide crucial insights.
The ICT (Inner Circle Trader) methodology offers a distinctive approach to understanding the importance of New Day Opening Gaps (NDOG), New Week Opening Gaps (NWOG), and New Monthly Opening Gaps (NMOG).
These gaps, representing the price differences between the close of a previous period and the open of the next, serve as key reference points that can greatly impact price movements.
The ICT trading approach highlights these gaps as potential zones of support and resistance. Prices often respond to these areas, either bouncing off or passing through and then retesting them. Within these gaps, significant levels such as the high and low are particularly important.
Additionally, the Event Horizon PD Array (EHPDA) concept, which is an intermediate level calculated from the average of neighboring NWOGs or NDOGs, adds another layer to this analysis.
This guide delves into ICT's New Daily, Weekly, and Monthly Opening Ranges, showing how these gaps can be effectively utilized in trading. By grasping the nuances of these gaps, traders can better forecast market behavior, identify key support and resistance levels, and refine their trading strategies.
🟣 The Gaps
1. New Week Opening Gap (NWOG) : The NWOG is the price gap between Friday's closing price and Sunday's opening price. This gap is particularly crucial for traders who monitor weekly trends. Depending on the direction of the gap, the NWOG often serves as a pivotal support or resistance level.
2. New Day Opening Gap (NDOG) : The NDOG signifies the price difference between the closing price of the previous day and the opening price of the current day. Much like the NWOG, the NDOG is a key reference point for intraday traders.
Prices typically react to these levels, either reversing or continuing through the gap after a retest. NDOGs are instrumental in identifying short-term support and resistance levels, aiding traders in making decisions based on daily price movements.
3. New Monthly Opening Gap (NMOG) : The NMOG represents the gap between the closing price of the previous month and the opening price of the current month.
This gap is especially valuable for traders focusing on long-term trends and macroeconomic factors. As with NWOGs and NDOGs, the NMOG can act as a significant support or resistance level.
🔵 How to Use
Identifying Support and Resistance : Opening gaps often indicate potential zones where prices might reverse or find support/resistance. For example, if a new day opens below the previous day’s close (creating a NDOG), this gap could act as resistance, prompting traders to consider short positions if the price retests this level without breaking through.
Conversely, if the price opens above the previous day’s close, the gap might serve as support, offering a potential entry point for long trades.
Gap Fill Strategy : A popular strategy associated with opening gaps is the "gap fill" approach, where traders anticipate that the price will eventually return to fill the gap.
For instance, if there’s a significant NDOG at market open, a trader might expect the price to retrace back to the previous day’s close, effectively "filling" the gap. This strategy is particularly effective in markets that exhibit mean-reverting behavior.
Combining Gaps with Other Indicators : Traders often enhance their analysis of NDOG, NWOG, and NMOG by integrating other technical indicators. Aligning gap levels with tools such as Fibonacci retracements, moving averages, or existing support and resistance zones can provide additional confirmation for trade entries and exits.
🔵 Setting
Show and Color : You can control the display or non-display of the range as well as the color of the range.
Max Opening Range Update Method : You can control the number of ranges that are updated. If it is "All", all ranges that are not mitigated will be displayed. If "Custom", the ranges will be updated based on the number you specify.
Max Opening Range Update : The number of ranges to update.
🔵 Conclusion
The ICT New Daily, Weekly, and Monthly Opening Ranges provide traders with a systematic approach to understanding market dynamics and identifying critical support and resistance levels.
By analyzing these gaps, traders can gain deeper insights into potential price movements, spot high-probability trade setups, and strengthen their overall trading strategy. Whether you are focused on short-term day trading or long-term market trends, incorporating NDOG, NWOG, and NMOG analysis into your trading plan can be a powerful addition to your toolkit.

Price Close ProbabilityThe Price Close Probability Indicator is designed to help traders estimate the likelihood of price closing above or below specified levels within a given bar. By placing two levels on your chart, you can quickly gauge the probability of the current price bar closing above or below these levels in real-time.
Key Features:
Dynamic Probability Calculation: The indicator continuously updates the probability of price closing above or below your set levels as the current bar progresses, providing you with timely insights as the bar approaches its close.
Customizable Standard Deviation : Adjust the length of the Standard Deviation used in the calculations to tailor the probability estimates to your preferred settings.
User-Friendly Probability Table : A clean, easy-to-read table displays the calculated probabilities, helping you make informed trading decisions at a glance.
Assumptions and Considerations:
While the indicator assumes that returns are normally distributed, which may not fully reflect reality, it still offers a valuable approximation of the probabilities for price movement within the current bar.
Future Enhancements (Coming Soon):
Multi-Bar Probability: Calculate probabilities across multiple bars to enhance your forecasting capabilities.
Additional Levels: Set more than two levels for a broader analysis of price movements.
Refined Distribution Modeling: Improve the accuracy of probability calculations by adjusting for more realistic return distributions.
Disclaimer
Please remember that past performance may not be indicative of future results.
Due to various factors, including changing market conditions, the strategy may no longer perform as well as in historical backtesting.
This post and the script don’t provide any financial advice.

Relative Equal Highs/LowsThis Pine script indicator is designed to create a visual representation of the relative equal highs & lows formed and automatically removed mitigated ones. Unlike indicators designed to show exact equal high/lows this indicator allows a small, configurable degree of variance between price to identify areas where price stops.
Relevance:
Relative Equal highs and lows can serve as valuable tools in identifying potential shifts in trend direction. They come into play when the price hits a support or resistance level and can’t advance further, signaling a possible reversal or pivot point. When the price sufficiently retreats from these levels, relative equal highs and lows can also indicate liquidity draws where buy/sell stops might be positioned, in accordance with SMC/ICT concepts.
How It Works:
The indicator tracks all unmitigated highs & lows within the chart’s present timeframe, limited to the user-defined max bars lookback for optimal performance. If the prices are within the configured variance they are marked as relatively equal and at that point are visually identified by a horizontal line, which connects the two (or more) points of price. Depending on configuration of the indicator, a line is rendered from the 1st, last or both values within the relatively equal range of price. A unique feature of this indicator is its ability to remove the line once the price mitigates the relative equal high/low by falling below the lows or rising above highs. This ensures the chart remains uncluttered and highlights only the currently relevant levels, setting it apart from other indicators providing similar functionality.
Configurability:
The indicator offers five style settings for complete customization of the lines that represent equal highs/lows. These settings include line style, color, and width, along with an option to extend the lines to the right of the chart for enhanced visibility of equal high/low levels. To optimize performance, the indicator allows users to configure the lookback length, determining how far back the price history should be examined. In most instances, the default setting of 500 bars proves more than adequate. Additionally, you can set thresholds via separate configs for stocks & indices that will determine if the price is relatively equal and lastly allow you to configure where the indicator line should be drawn, the first, last or all the values.
Additional notes:
This uses a different approach then my “equal highs/lows” indicator to identify price levels and because it focuses specifically on relative as opposed to exact values it is entirely different and may show “weaker”, but still important levels of liquidity. This indicator is more suited for analysis of stocks and indices or higher-timeframes where price-action rarely forms exact equal values instead more frequently forming almost equal values. My other indicator is more suited for smaller (15m or less) timeframe on indices where exact equal prices are often identical. Depending on situation different indicators should be used.

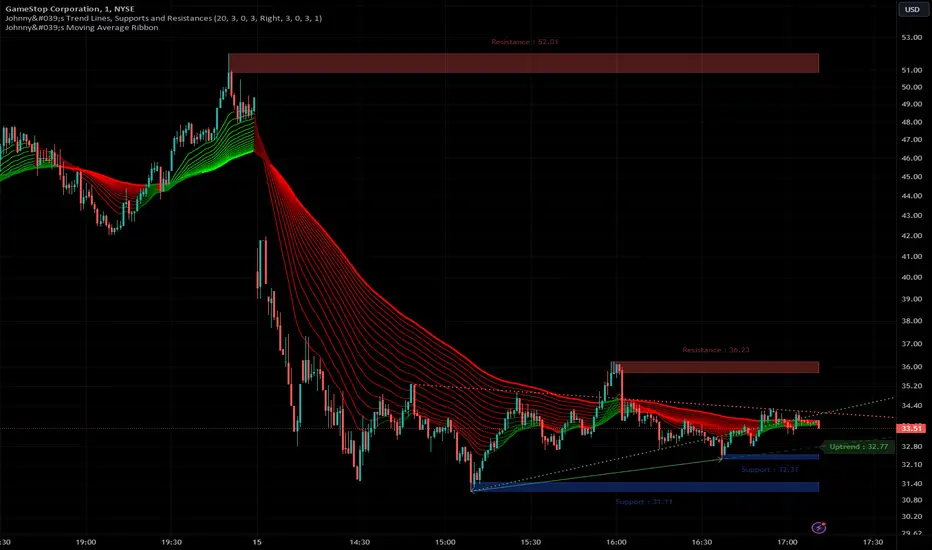
Johnny's Trend Lines, Supports and ResistancesInspired and based on ismailcarlik's Trend Lines, Supports and Resistances.
Additions include an overall upgrade to Pinescript v5, changes in the way resistance and support levels are calculated, improved visual queues, and additional customization options.
This indicator is meticulously crafted to provide traders with visual tools for identifying trend lines, support, and resistance levels, enhancing the decision-making process in trading activities.
Features and Functionality
Trend Lines: The indicator allows users to enable or disable trend lines, adjust the number of points to check for establishing a trend, and set parameters for trend validation, including the maximum violation and exceptions for the last bars.
Support and Resistance: It offers tools to identify and visualize key support and resistance levels based on recent pivot points. This includes adjustable parameters for the maximum violations allowed and the exclusion of recent bars from the analysis.
Pivot Points: Users can define the pivot length for calculating highs and lows, which helps in marking significant pivot points that are instrumental in trend analysis.
Alerts and Notifications: The indicator is equipped with customizable alerts for trend line breaches and pivot point formations, which can be set to trigger at different frequencies based on user preference.
How It Works
Input Flexibility: Users can adjust various settings like the length of trend lines and pivot points, enabling or disabling specific features like marking pivots, and managing alert settings directly from the indicator’s input panel.
Dynamic Analysis: By analyzing the price action relative to the calculated trend lines and pivot points, the indicator dynamically identifies potential trend reversals, continuations, and significant price levels.
Visualization: It plots trend lines and marks support and resistance levels directly on the chart, with options to extend these lines and add labels for better clarity. Violated trend lines can be visually differentiated by changing their style and width.
Practical Application
Trend Line Strategy: Traders can use the trend lines to determine the strength of the current market trend and to spot potential reversal points.
Support and Resistance Strategy: By marking where the price has historically faced resistance or found support, traders can plan entry and exit points, set stop-loss orders, or identify breakout opportunities.
Pivot Points Strategy: Pivot points serve as vital indicators for intraday trading or long-term trend analysis, providing insights into potential support and resistance levels.
Customization and Alerts
Custom Alerts: Traders can set alerts for when the price crosses trend lines or when new support or resistance levels are formed, helping them stay informed of critical market movements without having to continuously monitor the charts.
Visual Customization: Users can personalize the appearance of trend lines and labels, choosing from a variety of colors and styles to match their chart setup or preferences.
"Johnny's Trend Lines, Supports and Resistances" is an essential tool for traders who rely on technical analysis, offering detailed insights and real-time updates on market conditions, trend strength, and potential price barriers.
Previous Day and Week RangesI've designed the "Previous Day and Week Ranges" indicator to enhance your trading strategy by clearly displaying daily and weekly price levels. This tool shows Open-Close and High-Low ranges for both daily and weekly timeframes directly on your trading chart.
Key Features :
Potential Support and Resistance: The indicator highlights previous day and week ranges that may serve as key support or resistance levels in subsequent trading sessions.
Customizable Display Options: Offers the flexibility to show or hide daily and weekly ranges based on your trading needs.
Color Customization: Adjust the color settings to differentiate between upward and downward movements, enhancing visual clarity and chart readability.
This indicator is ideal for traders aiming to understand market dynamics better, offering insights into potential pivot points and zones of price stability or volatility.

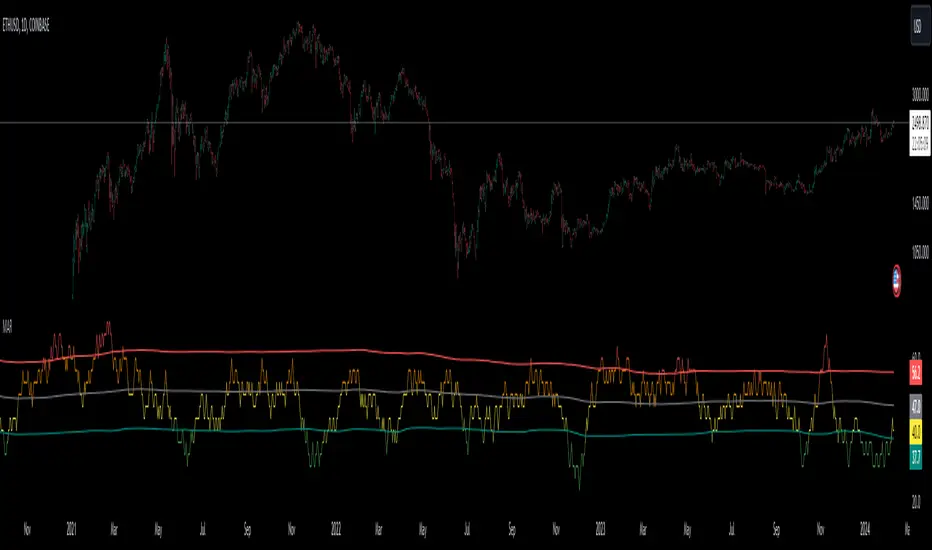
Market Activity Risk"Market Activity Risk" (MAR) - Is a dynamic tool designed to structurize the competitive landscape of blockchain transaction blocks, offering traders a strategic edge in anticipating market movements.
By capturing where market participants are actively buying and selling, the MAR indicator provides insights into areas of high competition, allowing traders to make informed decisions and potentially front-run transactions.
At the heart of this tool are blockchain transaction fees , they can represent daily shifts in transaction fee pressures.
By measuring momentum in fees, we can analyze the urgency and competition among traders to have their transactions processed first. This indicator is particularly good at revealing potential support or resistance zones, areas where traders are likely to defend their positions or increase their stakes, thus serving as critical junctures for strategic decision-making.
Key Features:
Adaptable Standard Deviation Settings: Users have the flexibility to adjust the length of the standard deviation and its multipliers, managing the risk bands to their individual risk tolerance.
Color-Coded Risk Levels: The MAR indicator employs an intuitive color scheme, making it easy to interpret the data at a glance.
Multi-Currency Compatibility: While designed with Bitcoin in mind, the MAR indicator is versatile, functioning effectively across various cryptocurrencies including Ethereum, XRP, and several other major altcoins. This broad compatibility ensures that traders across different market segments can leverage the insights provided by this tool.
Customizable Moving Average: The 730-day moving average setting is thoughtfully chosen to reflect the nuances of a typical cryptocurrency cycle, capturing long-term trends and fluctuations. However, recognizing the diverse needs and perspectives of traders, the indicator allows for the moving average period to be modified.
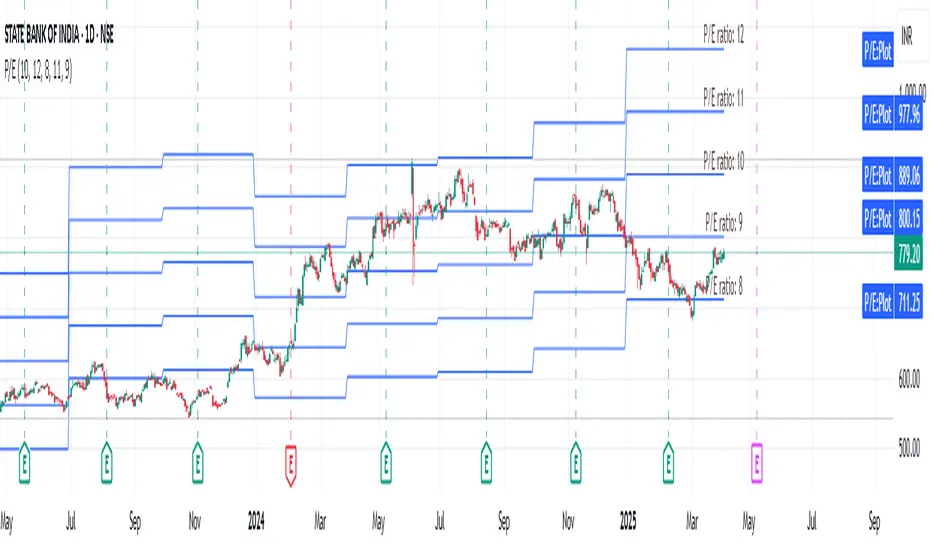
EPS GridIntroduction:
This simple indicator offers insights into the relationship between stock prices and earnings, aiding in the assessment of valuation dynamics during different periods.
Understanding Price-to-Earnings (P/E) Ratio:
The commonly used Price to Earnings (P/E) ratio, calculated as Current Price divided by Earnings Per Share (EPS) over the trailing 12 months (TTM), serves as a fundamental metric. Here, we use this formula to estimate a stock's price. For instance, multiplying EPS by 10 provides an approximation of the stock price with a P/E ratio of 10.
The Grid Concept:
Utilizing this principle, a visual grid is constructed to illustrate how stock prices correlate with earnings. This grid facilitates the identification of both potential bargains and overvalued stocks.
How to Utilize:
This indicator is pre-configured with earnings multiples of 10, 15, 20, and 25. Simply add it to your chart and observe whether earnings demonstrate consistent growth. If prices lag behind earnings, a potential catch-up phase may ensue in the future.
Happy Investing!
Embark on your investment journey armed with this indicator, and may it guide you towards informed decisions and successful ventures.
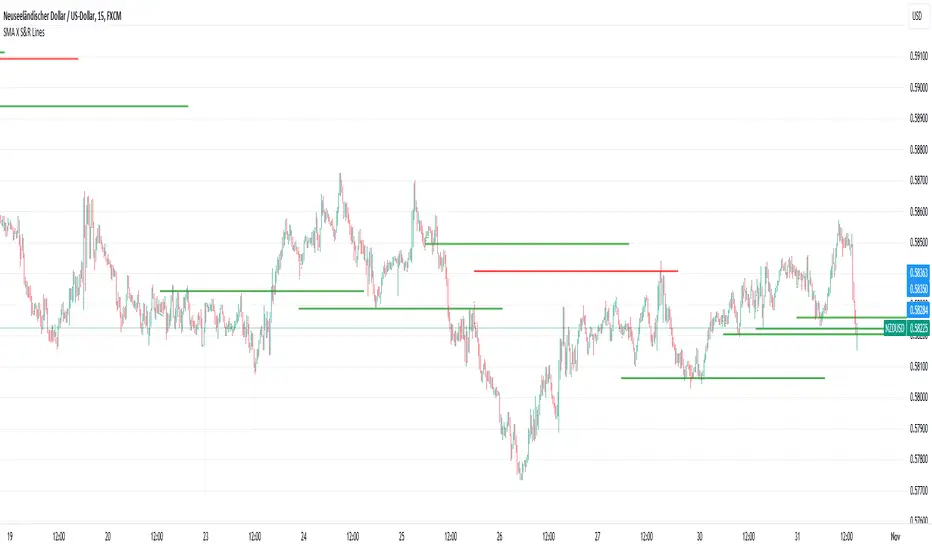
SMA Crossover Support & Resistance [Rami_LB]This indicator draws a horizontal line on the price chart at the point where two pre-defined SMA (Simple Moving Average) lines intersect. It is most useful for identifying crossed SMA lines on the 1-hour chart and then trading on smaller chart intervals.
For optimal performance, it is recommended to customize the values of the SMA lines individually for each currency pair, as these values can vary from one pair to another. To do this, switch to the 1-hour chart and adjust the SMA parameters until you visually observe that these settings would yield favorable results based on historical data. Certainly, you can also adjust the length of the lines accordingly when you switch from the 1-hour chart to smaller timeframes.
Please note that this indicator allows traders to visually identify potential trend changes and crossovers between short-term and long-term moving averages, aiding in decision-making for trading strategies.
Confluence Buy-Sell Indicator with Fibonacci The script is a "Confluence Indicator with Fibonacci" designed to work on the TradingView platform. This indicator combines multiple technical analysis strategies to generate buy and sell signals based on user-defined confluence criteria. Here's a breakdown of its features:
Confluence Criteria: Users can enable or disable various strategies like MACD, RSI, Bollinger Bands, Divergence, Fibonacci, and Moving Average. The number of strategies that need to align for a signal to be generated can be set by the user.
Strategies Included:
MACD Strategy: Uses the Moving Average Convergence Divergence method to identify buy/sell opportunities.
RSI Strategy: Utilizes the Relative Strength Index to detect overbought or oversold conditions.
Bollinger Bands Strategy: Incorporates Bollinger Bands to identify volatility and potential buy/sell signals.
Divergence Strategy: A basic implementation that detects bullish and bearish divergences using the RSI.
Fibonacci Strategy: Uses Fibonacci retracement levels to determine potential support and resistance levels.
Moving Average Strategy: Employs a crossover system between the 50-period and 200-period simple moving averages.
Additional Features:
Support & Resistance: Identifies major support and resistance levels from the last 50 bars.
Pivot Points: Calculates pivot points to determine potential turning points.
Stop Loss Levels: Automatically calculates and plots stop-loss levels for buy and sell signals.
NYC Midnight Level: Option to display the New York City midnight price level.
Visualization: Plots buy and sell signals on the chart with green and red markers respectively.
Adequate Category:
"Technical Analysis Indicators & Overlays" or "Strategy & Scripting Tools".

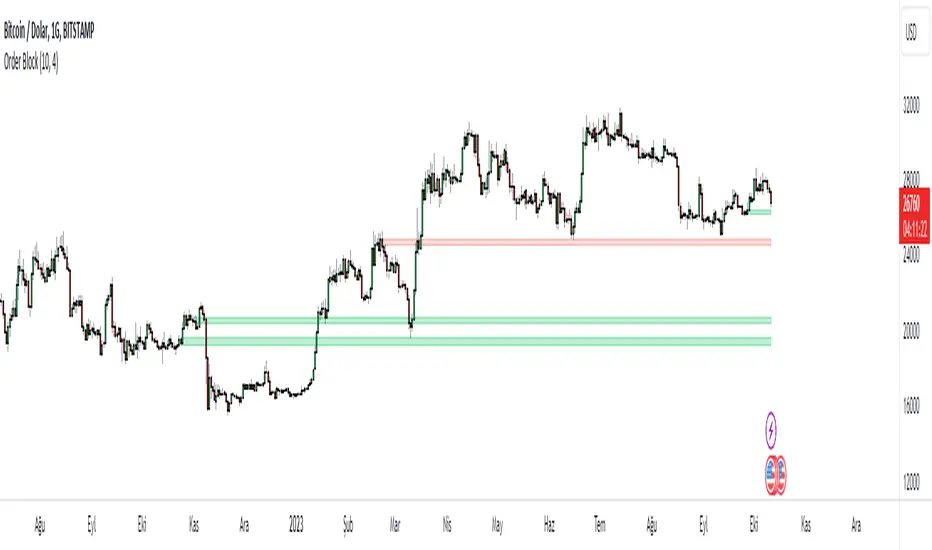
Order Block v1Hello Traders :)
I am Only Fibonacci.
While coding this indicator, I examined many concepts and decided to blend them.
I took the method shared by most traders and added different perspectives and options.
First of all, you can choose how many order block regions you want to see on the screen.
Note: The levels displayed on the screen are the sum of bears and bulls.
You can also choose whichever you want to see, bearish or bullish.
You can specify the precision of pivot points.
Whether you want to select a zone with a body or a zone with a wick, you can see this in the settings.
You can extend the regions infinitely with the right extension option.
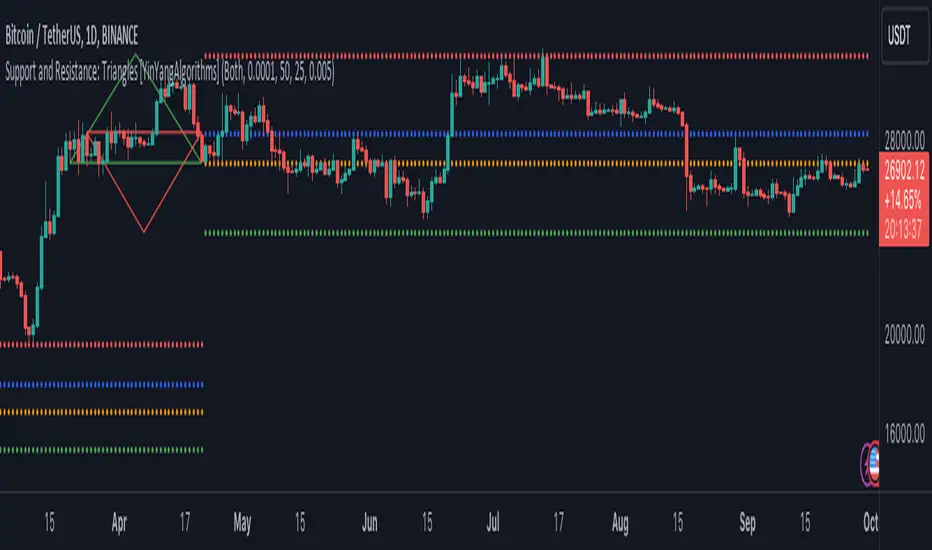
Support and Resistance: Triangles [YinYangAlgorithms]Overview:
Triangles have always been known to be the strongest shape. Well, why wouldn’t that likewise apply to trading? This Indicator will create Upwards and Downwards Triangles which in turn create Support and Resistance locations. For example, we find 2 highs that meet the criteria (within deviation %, Minimum Distance and Lookback Distance). We calculate the distance between these two and create an Equilateral Triangle Downwards (You can adjust the % if you want more of an Isosceles Triangle). The midpoint (tip) of this triangle is the Support and the bottom (base) of it is the Resistance. The exact opposite applies for an Upwards Triangle.
The reason why Triangles may make for good Support and Resistance locations is the % 's used, much like the fibonacci, use ratios relevant in nature and everywhere in the world around us, so why not for trading too?
Tutorial:
If you look at the locations we’ve circled above, all of them exhibit strong rejections are predictive Support and Resistance locations plotted by the triangles created. There can only ever be 1 Upward and 1 Downward Triangle at a time, so when a new one is created, the Support and Resistance locations are moved.
If you scroll back far enough you’ll notice the Triangles disappear but their Support and Resistance locations are still plotted. This has to do with the fact you are allowed only so many Lines plotted and when a new Triangle is created, an old one will be removed. The Support and Resistance locations however will stay.
If we look at the example above, you can see the Support and Resistance locations the Triangles made here may have helped predict where the price would struggle to surpass.
By default the Look Back Distance is set to 50 and the Min Distance is 10 (settings used in all previous examples). However, you can modify these to make Triangles more ‘Rare’ and therefore the Support and Resistance locations change less. In the example above for Instance we left Look Back Distance to 50 but changed Min Distance from 10 to 25. This results in Support and Resistance locations that may hold better in the long term.
If we scroll back a bit, we can see the settings ‘Look Back Distance’ 50 and ‘Minimum Distance’ 25 had done a decent job at predicting the ATH resistance and many Support and Resistance locations around it. Keep in mind, previous results don’t mean future results, but Triangles may create ratios which apply well to trading.
We will conclude our Tutorial here. Hopefully you can see the benefit to the ratio Triangles make when predicting Support and Resistance locations.
Settings:
Show Triangles: If all you want to know is the Support and Resistance locations, there’s no need to draw the Triangles.
Triangle Zones: What types of triangles should we create our zones for? Options are Upward, Downward, Both, None.
Max Deviation Allowed: Maximum Deviation up or down from the last bars High/Low for potential to create a Triangle.
Lookback Distance: How far back we look to see for potential of a High/Low within Deviation range.
Min Distance: This is so triangles are spaced properly and not from 2 bars beside each other. Min distance allocated between 2 points to create a Triangle.
Bar Percent Increase: How much % multiplier do we apply for each bar spacing of the triangle. 0.005 creates a close to Equilateral Triangle, but other values like 0.004 and 0.006 seem to work well too.
If you have any questions, comments, ideas or concerns please don't hesitate to contact us.
HAPPY TRADING!
Liquidity Spike PoolThe “Liquidity Pools” indicator is a tool for market analysts that stands out for its ability to clearly project the intricate zones of manipulation present in financial markets. These crucial territories emerge when supply or demand takes over, resulting in long shadows (wicks) on the chart candles. Imagine these regions as "magnets" for prices, as they represent authentic "liquidity pools" where the flow of money into the market is significantly concentrated. But the value of the indicator goes beyond this simple visualization: these zones, when identified and interpreted correctly, can play a crucial role for traders looking for profitable entry points. They can mutate into important bastions of support or resistance, providing traders with key anchor points to make informed decisions within their trading strategies.
A key aspect to consider is the importance of different time frames in analyzing markets. Larger time frames, such as daily or 4h, tend to host larger and more relevant liquidity zones. Therefore, a successful strategy might involve identifying these areas of manipulation over longer time frames through the use of this indicator, and then applying these findings to shorter time frames. This approach allows you to turn manipulation zones into crucial reference points that merit constant surveillance while making trading decisions on shorter time frames.
The indicator uses color to convey information clearly and effectively:
- Dark blue lines highlight candles with significant upper wick, signaling the possible presence of an important manipulation area in the considered area.
- Dark red lines are reserved for sizable candlesticks with significant upper wick, emphasizing situations that are particularly relevant to traders.
- Dark gray lines highlight candles with significant lower wick, providing a valuable indication of manipulation zones where the bid may have prevailed.
- White lines highlight sizable candlesticks with significant lower wick, clearly indicating situations where demand has been predominant and may have helped form a liquidity pool.
This indicator constitutes an important resource for identifying and clearly displaying candles with significant wicks, allowing traders to distinguish between ordinary market conditions and circumstances particularly relevant to their trading strategies. Thanks to the distinctive colors of the lines, the indicator offers intuitive visual guidance, allowing traders to make more informed decisions while carrying out their analyses.

Monthly Range Support & Resistance [QuantVue]The Monthly Range Support & Resistance Levels is an advanced analytical tool designed to assess monthly price movements and provide potential support and resistance levels.
This tool examines the average monthly price fluctuations over the past 7 months (default), and creates support and resistance levels based on the opening price.
The indicator also considers a standard deviation multiplier.
This enables traders and investors to identify potential price zones.
The support and resistance levels are dynamically updated every month.
Users can also choose to view previous daily levels as well.
Customizable settings for this tool include:
-Averaging Period: Adjust the number of months to calculate the average monthly range.
-Standard Deviation Multiplier: Modify the standard deviation multiplier to fine-tune the sensitivity of the support and resistance levels. A higher multiplier will result in wider levels, accommodating higher price fluctuations.
-Toggle Support & Resistance Prices: Easily switch on or off the display of support and resistance price levels.
-Show Monthly Open Line: Display the monthly opening price as a reference point on the chart.
-Show Previous Levels: Choose whether to display past daily support and resistance levels.
Note: this indicator works on a 1 hour timeframe or higher
Give this indicator a BOOST and COMMENT your thoughts!
We hope you enjoy.
Cheers!

VWAP with CharacterizationThis indicator is a visual representation of the VWAP (Volume Weighted Average Price), it calculates the weighted average price based on trading volume. Essentially, it provides a measure of the average price at which an asset has traded during a given period, but with a particular focus on trading volume. In our case, the indicator calculates the VWAP for the current trading symbol, using a predefined simple moving average (SMA) with a period of 14. This volume-weighted moving average offers a clearer view of the behavior of the VWAP and, of consequence of market dynamics.
One of the distinctive features of this indicator is its ability to provide a more "linear" representation of the data. This means that the data is "smoothed" to remove noise, allowing you to more easily identify the direction of the market trend. This smoother representation is especially useful because the financial market can be subject to significant fluctuations and volatility, and this indicator can help get a more stable view of the trend.
The indicator also offers a visualization of the market trend in a very intuitive way. Using an evaluation of the highs and lows of the last 10 days, determine whether the market is in an uptrend, downtrend, or no trend at all. To make this evaluation even clearer and more immediate, the indicator line is colored dynamically. When the trend is bullish, the line is blue, while in case of a bearish trend, it takes on a distinctive color, such as pink. If the trend is not defined, the line will be colored differently, for example light yellow. This coloration gives traders an immediate visual indication of the prevailing trend, allowing them to make more informed decisions regarding trading operations.
One potential strategy involves watching candles when they cross the VWAP line strongly. If, for example, a candlestick breaks above the VWAP line, we may look for retest areas near key support levels to gauge a potential long entry. In other words, we would consider that the price may have the potential to rise further after breaking above the VWAP line, and we would look to enter a long position to take advantage of this opportunity.
On the other hand, if a candlestick crosses below the VWAP line, we might consider looking for retest areas near the VWAP line itself, which now serves as potential resistance. This could indicate a possible short entry opportunity, as the price may struggle to break above the resistance represented by the VWAP line after breaking it down. In this case, we would look to take advantage of the expected continuation of the downtrend.
In both cases, the idea is to exploit significant movements across the VWAP line as signals of potential reversal or continuation of the trend. This strategy can help identify key entry points based on price behavior relative to the VWAP line.

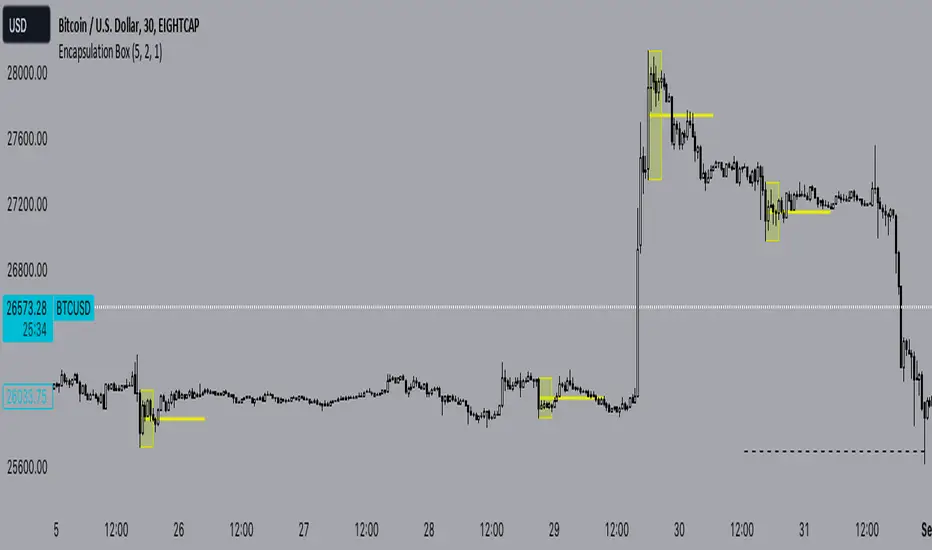
Encapsulation BoxThe “Encapsulation Box” indicator is designed to locate areas of the chart where the highs and lows of candlesticks are “embedded” or enclosed within the body of a previous candlestick. This setup indicates a significant contraction in the market and can provide important trading signals. Here's how it works in more detail:
Detecting contraction: The indicator looks for situations where the price range of the candles is very narrow, i.e. when subsequent candles have highs and lows that are contained within the range of a previous candle. This condition indicates a contraction in the market before a possible directional move.
When a contraction is detected, the indicator draws a rectangle around the area where the highs and lows of the candles are embedded. The rectangle has its upper vertex corresponding to the maximum of the candles involved and its lower vertex corresponding to the minimum. The width of the rectangle is defined by can be customized by the user.
A key feature of this indicator is the horizontal line drawn outside the rectangle. This line is positioned in the middle of the rectangle and represents 50% of the range of the rectangle itself. This line acts as a significant support or resistance level depending on the direction the contraction breaks.
The indicator can generate buy or sell signals when a break in the rectangle or horizontal line occurs. For example, if the price breaks above the rectangle and the horizontal line, it could generate a buy signal, indicating a possible uptrend. Conversely, if the price breaks below the rectangle and the horizontal line, it could generate a sell signal, indicating a possible downtrend.
Pivot Points [MisterMoTA]The Pivot Points indicator by MisterMoTA allow users to get pivots points calculated from last candle high, low and close on any timeframe from 1 minute to weekly.
This will help users that are trading ins small timeframes to see the pivots that are near their timeframes and not only daily timeframe.
Here is an example on the chart from nex image the timeframe is set to 1 minute and pivot points displayed are at 15 minutes :
The users have control on pivots colors, pivot labels colors, text color from labels, decimal numbers displayed in the labels and style of the pivots lines.
Please follow me for other script like this one.
Kind regards,
MisterMoTA

Contraction Box & Doji LinesContraction & Doji Lines indicator is designed to identify and visualize potential support and resistance levels on a price chart. It does this by detecting doji candlestick patterns and drawing horizontal lines from the middle of the doji bodies to the right. Additionally, it also highlights price contraction zones with colored boxes.
The indicator first identifies doji candlestick patterns that it suggests indecision in the market, a horizontal line and these horizontal lines can act as potential support or resistance levels. Traders can observe price reactions around these lines. If the price approaches a line and bounces off it, it may indicate a significant level in the market.
In addition to doji lines, this indicator also highlights price contraction zones. When a contraction zone is detected, a colored box is drawn to highlight this zone. The box extends from the fifth bar ago (left side) to the current bar (right side), with the highest high and lowest low of the identified zone. The color and width of this box can be customized using the "Box Line Border Color," "Box Background Color," and "Box Width" parameters.
A possible strategy could be can use the doji lines as potential support and resistance levels to make trading decisions. For example, if the price breaks above a doji line and holds, it may indicate a bullish signal.
The colored boxes highlight areas of price contraction, which often precede significant price movements. Traders can use these zones to anticipate potential breakouts or breakdowns.
For example, you might enter a long (buy) position if it anticipate a breakout from a contraction zone with a target price set above the breakout level. Conversely, you might enter a short (sell) position if they anticipate a breakdown from a contraction zone with a target price set below the breakdown level.

Support & Resistance PROHi Traders!
The Support & Resistance PRO
A simple and effective indicator that helped me a bunch!
This indicator will chart simple support and resistance zones on 2 time frames of your choice.
It uses a 30 day lookback period and will find the last high and low.
Each zone is built from the highest/lowest closure, and the highest/lowest wick, creating a liquid zone between the 2.
It is perfect for people trading support and resistance, watching key areas, scalping zones and much more!
*You can change the time frames you are looking at and the lookback period.
*The example in the picture is looking at the Daily and Weekly zones on BTC.

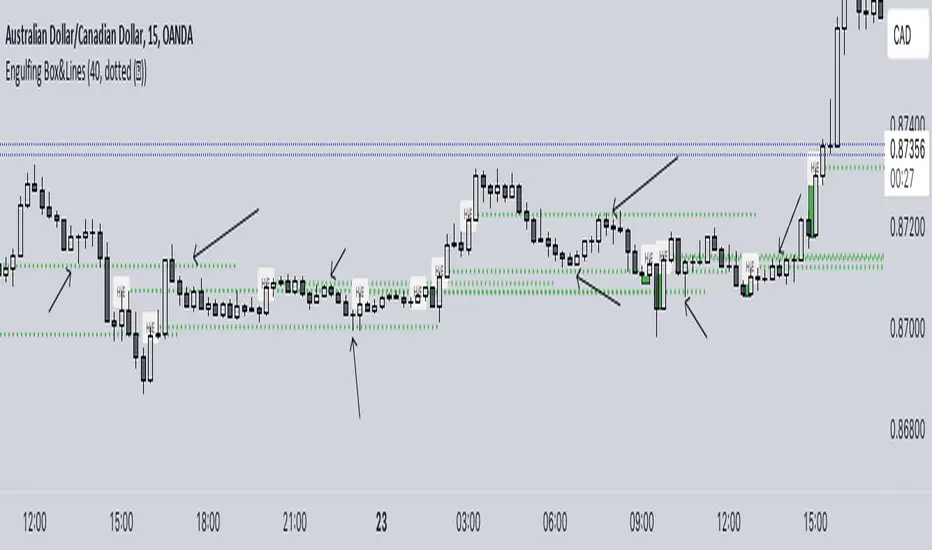
Engulfing Box & LinesThe "Engulfing Box & Lines" indicator aims to spot and highlight Engulfing candlestick patterns within a trend. These patterns can provide valuable indications of a possible trend reversal, and the indicator underlines them through the use of colored rectangles and horizontal lines. To fully understand the functioning and use of this indicator, let's explore its key elements and associated strategies.
Identification of Engulfing Patterns:
The indicator focuses on detecting two types of Engulfing candles:
Bullish Engulfing: Occurs when a bullish candle (open lower than close) completely encloses the body of the previous bearish candle. This could indicate a possible upside reversal.
Bearish Engulfing: Occurs when a bearish candle (opening higher than closing) entirely engulfs the body of the previous bullish candle. This could signal a potential bearish reversal.
Using the EMA 200:
The indicator uses the 200-period Exponential Moving Average (EMA) as a reference to determine the position of the candles with respect to the long-term trend. When the price is above the 200 EMA, the bullish Engulfing candles are highlighted with a green box, while below the 200 EMA, red boxes are shown for the bearish Engulfing candles.
Size of Boxes and Lines:
The colored boxes represent the size of the body of the candle that caused the Engulfing. Additionally, a horizontal line is drawn close to the body of the candle, serving as the fulcrum of the indicator.
Trading Strategies:
This indicator can be used for different trading strategies:
Trend Continuation: During a positive trend, the onset of an engulfing pattern suggests a possible continuation of the trend. The horizontal lines represent potential support areas, where the price could bounce. Traders might consider buying during such bounces.
Retracements and Entries: Lines can act as support or resistance zones, depending on the trend. When the price approaches a line, a retracement could occur. Traders might move to a lower timeframe to spot entry signals, using the line as a reference.
Closing Positions: Lines could also be used to define exit levels. For example, a trader might decide to exit a position when the price approaches a resistance line.
Confirmations with Other Indicators: The indicator could be used in conjunction with other technical tools, such as oscillators or candlestick analysis, to confirm signals and improve the accuracy of trading decisions.