NhaDuHanhFX - Congestion Zone (Complete & Incomplete)
When the market is trending, the momentum is strong, the price often moves quickly in one direction. In the higher time frame, we see that the closing price of the candlestick is often far away from the previous candlesticks.
When the market is sideways, the momentum is weak, and prices often move slowly around an area. In the higher time frame, we see that the closing price of the candlestick is usually within the range of the previous candlesticks.
The Congestion Zone is a price action indicator that marks out such a sideways market area. It has many patterns: Complete and incomplete patterns.
- Complete Congestion Zone (Default): It includes at least 3 candlesticks that the next candlestick has a closing price within the previous candlestick range. Then, if a candlestick closes outside the range of the previous candlestick, it is a sign that the market has most likely ended the sideway, moving into a trending state.
- Incomplete Congestion Zone (Settings Option): It is more complex Congestion patterns. It also marks out sideways of the market. However, during the congestion formation, the price tried to break out of the zone with a candlestick closing outside the previous candlestick , right after that the price turns back and continues to congest.
In addition to using the Congestion Zone to predict if the market is likely to have moved from sideways to trending. The Congestion Zone is also used as a Support & Resistance area. When the price goes away and returns to the Congestion Zone, it will likely reverse.
Pay attention to the price area that previously appeared a lot of congestion zone. It is more likely to reverse.
Resistence

Sup/Res Levels [QuantVue]Shows basic pivot point of support and resistance levels. Will show alerts for break of sup. or res. Allows for a volume filter for sup. res. breaks as well.
"B" means break of either a Sup. or Res. level with volume greater than the threshold.
"Bull/Bear Wick" means bullish/bearish candle on break.
Left - number of bars left hand side of the pivot .
Right - number of bars right hand side of the pivot .
Volume Thres. - the threshold value (%) for the Volume.
This indicator is useful to filter our insignificant breaks of sup. or res. Can help trader determine when to sit on their hands, or enter a trade.

Support and Resistancewhat is "Support and Resistance"?
it is a support and resistance indicator.
what it does?
it draw support and resistance zones on the chart.
how it does it?
It determines the zones where the price leaves with a big candle after going horizontal for a while as support or resistance zones according to the price movement direction. while doing this, it compares the size of the candles and the elapsed time.
how to use it?
Red zones represent resistance and green zones represent support. You can buy in the support zone or sell in the resistance zone. my advice is to make your own interpretation by taking into account the price movement with different indicators. they are considered useful if there is a closure beyond the zones. otherwise, they continue to be shifted to the right.
notice: As new zones are created, old ones may disappear. so it might be wise to draw boxes using drawing tools where the old zones are.
Support and resistance are very important concepts for technical analysis. so I am thinking of updating and improving this indicator many times in the long run. but I couldn't wait long to post it.
examples:

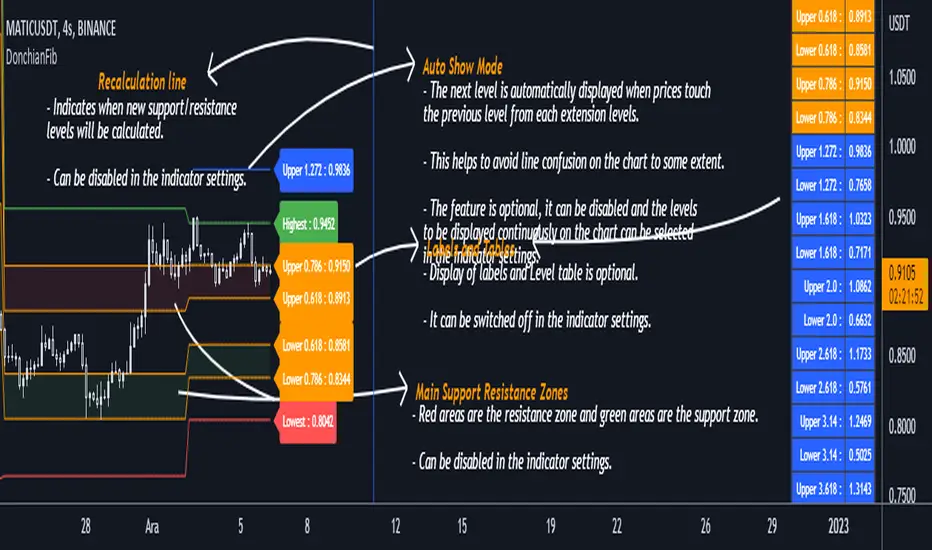
DonchianFib[Akcay]How does it work?
- The indicator detects the highest and lowest price level in the last x periods every time prices advance by x periods.
- From these values, retracement (0.618, 0.786) and expansion levels (1.272, 1.618, 2, 2.618, 3.14, 3.618, 4.236) are obtained.
- Since the symmetrical counterpart of the retracement levels is used, there are two of each of the 0.618 and 0.786 lines, for a total of four.
How can it be used?
- It can be used for step buying.
- It can be used for step selling.
- Can be used to set a profit target.
- Can be used to set a stop target.
- This indicator can be used in the same way as Pivot levels can be used. You can think of this indicator like the Pivot Points Standard indicator, where you set the period more flexibly.
Which indicators can it be combined with?
- I don't think there are any limitations, but I think it is compatible with trend detection indicators, trend detection with DonchianFib, and stepped buy/sell with limit orders.
- If you want to enter a position with mismatch signals, you can wait for the DonchianFib levels to break.
- Its use is limited by your imagination :)
Where does the name come from?
- As the name suggests, Donchian Channels. I was inspired by Donchian Channels when developing the indicator. Donchian channels show the highs and lows of prices over the last x number of periods. DonchianFib does this once for every x periods and uses the fibonacci levels to create upper and intermediate levels.
Note : I don't know if such an indicator has been done before or not. If it has been done, I haven't seen it in tradingview.
Çalışma mantığı nedir ?
- Gösterge, fiyatlar her x periyot kadar ilerlediğinde son x periyot içerisindeki en yüksek ve en düşük fiyat seviyesini tespit eder.
- Bu değerler üzerinden geri çekilme (0.618, 0.786) ve genişleme seviyeleri (1.272, 1.618, 2, 2.618, 3.14, 3.618, 4.236) elde edilir.
- Geri çekilme seviyelerinin simetrik karşılığı kullanıldığından 0.618 ve 0.786 çizgilerinden her birinden iki adet olmak üzere toplamda dört adet bulunur.
Nasıl kullanılabilir ?
- Kademeli alım yapmak için kullanılabilir.
- Kademeli satım yapmak için kullanılabilir.
- Kâr hedefi belirlemek için kullanılabilir.
- Stop hedefi belirlemek için kullanılabilir.
- Pivot seviyelerinden nasıl faydalanılıyorsa bu göstergeden de aynı şekilde faydalanılabilir. Bu göstergeyi, periyodunu kendinizin daha esnek bir şekilde belirlediğiniz Pivot Noktalar Standartı göstergesi gibi düşünebilirsiniz.
Hangi göstergelerle kombine edilebilir ?
- Bunun için herhangi sınırlama yapmak doğru değil ancak trend tespit etmeye çalışan göstergelerle uyumlu olduğunu düşünüyorum. Bu göstergeler ile trend tespiti yapıp DonchianFib ile alım/satım yerleri belirlenebilir ve limit emirleri ile kademeli alım/satım yapılabilir.
- Uyuşmazlık sinyalleri ile pozisyona girilmek isteniliyorsa DonchianFib seviyelerinin kırılması beklenebilir.
- Kullanımı sizin hayal gücünüz ile sınırlıdır :)
Adı nereden geliyor ?
- Adından da anlaşılacağı üzere Donchian Kanallarından. Göstergeyi geliştirirken Donchian Kanallarından ilham aldım. Donchian kanalları fiyatların son x periyot içerisindeki en yüksek ve en düşük seviyelerini grafikte gösteriyor. DonchianFib ise bunu her x periyot için bir defa yapıp, fibonacci seviyelerini de kullanarak üst ve ara seviyeler oluşturuyor.
Not : Daha önce böyle bir göstergenin yapılıp yapılmadığını bilmiyorum. Yapıldı ise ben tradingview'da görmedim.
4C Expected Move (Weekly Options)This indicator plots the Expected Move (EM) calculated from weekly options pricing, for a quick visual reference.
The EM is the amount that a stock is predicted to increase or decrease from its current price, based on the current level of implied volatility.
This range can be viewed as support and resistance, or once price gets outside of the range, institutional hedging actions can accelerate the move in that direction.
The EM range is based on the Weekly close of the prior week.
It can be useful to know what the weekly EM range is for a stock to understand the probabilities of the overall distance, direction and volatility for the week.
To use this indicator you must have access to a broker with options data (not available on Tradingview).
Look at the stock's option chain and find the weekly expected move. You will have to do your own research to find where this information is displayed depending on your broker.
See screenshot example on the chart. This is the Thinkorswim platform's option chain, and the Implied Volatility % and the calculated EM is circled in red. Use the +- number in parentheses, NOT the % value.
Input that number into the indicator on a weekly basis, ideally on the weekend sometime after the cash market close on Friday, and before the Market open at the beginning of the trading week.
The indicator must be manually updated each week.
It will automatically start over at the beginning of the week.

Trend SuggestionsThis brings together a number of variables to produce trend predictions that could be utilized as decision-making tools.
Uses the aforementioned price and volume derivatives
- A moving average and three weighted moving averages (WMA1, WMA2, WMA3)
- Super Trend Line (ST)
- Opening Range Breakout on Five Minutes, Resistance Bands Pocket pivots, support, and price volume
he Direction is determined by the High and Low Bands of WMAs and the Supertrend Line, which are used to determine the Upper and Lower Lines around the Price. When the price passes below the lower boundary of the band, a downtrend is said to have begun.
Similarly, for an uptrend, this continues until the price passes over the upper edge of the band. Teal for an uptrend and fuchsia for a downturn area shared by the band to identify the trend.
The first five minutes of the breakout lines have a tiny buffer augmentation of 11% applied to them.
Based on what has been observed, support and resistance zones have been somewhat changed from the figures that are often utilized (might work other markets as well)
The markings that may be seen are as follows:
- Blue Triangle indicates a pocket pivot with an upward bias;
- Maroon Triangle indicates a pocket pivot with a downward bias;
- Teal colored Diamonds indicate price upthrusts and potential trend confirmation locations, depending on success or failure.
- Similar backdrop color changes that look as vertical shading are also used to identify them.
- Fuchsia-colored diamonds indicate price declines and a potential trend, depending on whether it persists or fails.
- Dark green and maroon square boxes indicate potential price reversals in the support and resistance bands, respectively.
It goes without saying that this work is derived from numerous other open-source community initiatives.
Feel free to adjust anything you'd like, and we appreciate any feedback.

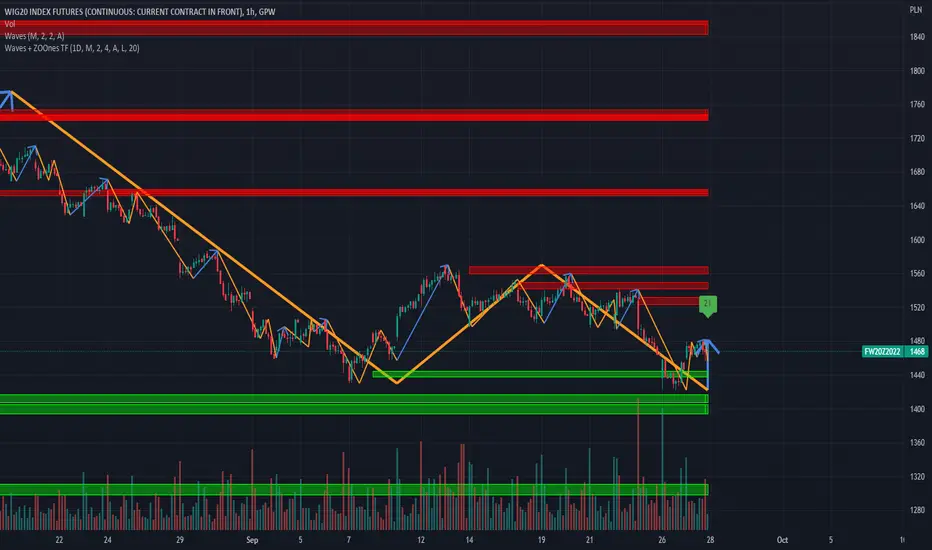
Waves + ZOOnes TimeFrameTrend visualization tool in Wave theory. Unlike Elliot waves, it has a constant pattern length. The formation consists of impulse and 3 corrections.
The script analyzes candle relationships in the currect trend, trend will be continueted until candle are not breaking trend rules.
Currently it supports 2 rulesets/wave variants:
Low - More sensitive (trend will change more ofter).
Meddium - Less sensitive ( trend will change less ofter).
Simultaneous observation of both types allows to detect consolidation before the overlapping movement and increase the probability of indicating the moment of the movement occurrence.
Script with limited access, contact author to get authorization
Features:
- Allow to pick timeframe used for visualization.
- Show Low and Middle type/order waves
- Show support/resistance areas for the Low and Middle type/order waves.
- Types for waves and support areas are picked independently. Script can show Middle Waves with Low Waves support areas.
- Shadow mode that show second wave moved to the wave max/min bars.
- Show historical support/resistance areas that are not valid any more.
Script settings:
Timeframe - Time frame used for visualization. It should be less precise or equal as the chart one. e.g. it can show 1D visualization over 1H chart.
TREND VISUALIZATION
Type - Kind of waves should be drawn.
H(idden) - Do not draw any waves.
L(low) - Draw low waves
M(edium) - Draw medium waves
B(oth) - Draw both low and medium waves
Confirmation - Showing confirmation lavel over current bar If wave direction will not change on this bar
Shadow - Showing second reprezentation of the trend with drawing with the use of minimal and maximal values. It's usefull to determine the delay between the peak and a wave change signal.
Line width - Width of drawn line. Separate setting for Low and Medium trend type.
Color - Color of drawn line. Separate settings for Low and Medium trend type.
Change trend signals - Showing places where alerts are generated (debug feature).
u - trend change to UP
d - trend change to DOWN
U - trand change to UP from the zone
D - trand change to down from the zone
IMPULS VISUALIZATION
Impuls - Picking graphical reprezentation of first bullish arrow.
H - Hidden
F - First
S - Second
A - Auto
Color - Color of the first bullish arrow.
Draw arrow - Turning on/off drawing arrow at the end of the impuls wave.
ZOONES
ZOOnes type - Determines what type of trend is used to designate areas of support.
D - Disabled
L - Low
M - Medium
Only nearest zones - Drawing only one nearest zone above and below current price.
Only nearest potencial zones - Drawing only one nearest potencial zone above and below current price.
Resistance - Set of colors (resistance zone background, resistance zone border, potencial resistance zone background, potencial resistance zone border) used for drawing resistance zones and potencial resistance zones.
Support - Set of colors (support zone background, support zone border, potencial support zone background, potencial support zone border) used for drawing support zones and potencial support zones
Show history - Showing zones in historical data
Show fake potencials - Showing historical potencial zonnes that were rejected (debug purpose).
Double count - Treated support and resistance zoones as one zoone
Zone precision - Determines how many bars are included in area calculation.
Alerts:
Low trend DOWN - When Low trend type is changing from UP to DOWN
Low trend UP - When Low trend type is changing from DOWN to UP
middle trend DOWN - When Middle trend type is changing from UP to DOWN
middle trend UP - When Middle trend type is changing from DOWN to UP
middle trend from ZOOnes DOWN - When Middle trend type is changing from UP to DOWN after hiting resistance area .
middle trend from ZOOnes UP = When Middle trend type is changing from DOWN to UP after hiting support area .
Troubleshooting:
In case of any problems, send error details to the author of the script.
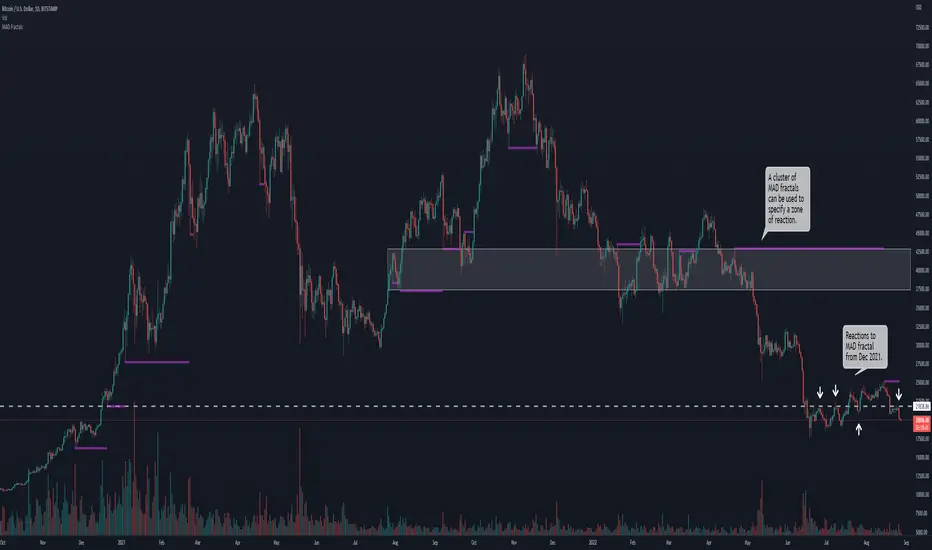
Median Absolute Deviation Outlier FractalsCore Concepts
Using Bill William's fractals (can be any types of pivots), we want to find outlier fractals using the median absolute deviation (MAD). When the true range falls outside the specified threshold, it is counted as an outlier. These outliers tend to have significance. Prices usually react to those levels in the future, sometimes a single level and other times a cluster of them to create a zone.
Usage
The baseline determines the trend. Above baseline is uptrend and below is downtrend.
MAD length is how much data you want to use for the MAD calculation.
Deviation limit is the multiple of MAD from median figure to determine if the true range prices exceeds it and if it does we have an outlier.
Notes:
The script is for informational and educational purposes only.
Any suggestions for improvement are welcome!
Mark FVGsMark FVGs is marking FVG (stands for Fair Value Gap, other name is Imbalance or IMB) on your chart so that you can instantly detect them
It supports:
- marking bullish and bearish partly filled or unfilled FVGs of the current timeframe
- marking bullish and bearish already filled FVGs of the current timeframe
- marking bullish and bearish FVGs of the any 4 timeframes on your current timeframe
technically it re-builds them on the last bar or as soon as new realtime bar is updated. it looks with 1k bars back to find the nearest specific number of FGVs
Adjustments:
- changing the maximum number of FVGs to display.
- changing the color of FVG area
- displaying already filled FVG of the current time frame
- changing the mode of displaying area it can either extended or fixed width
- displaying labels of other time frame FVGs

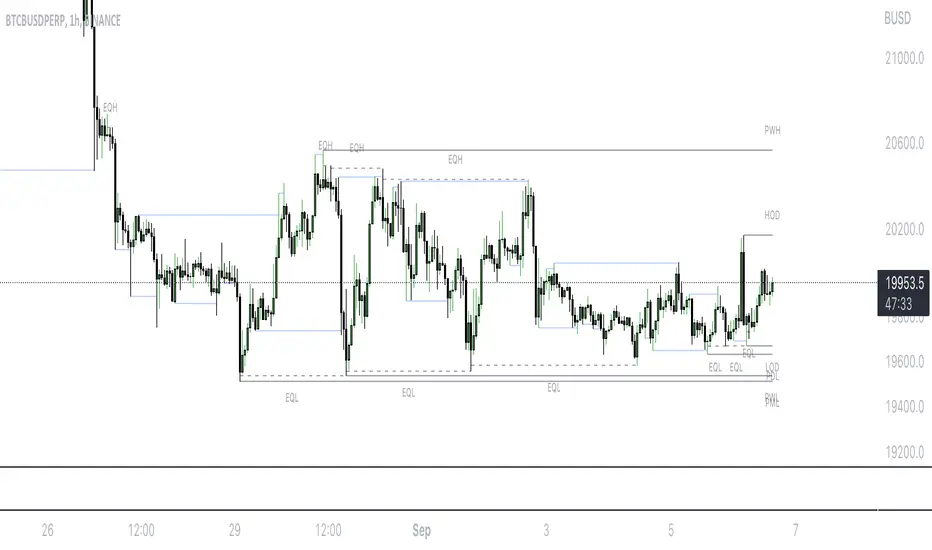
Mark LevelsMark Levels is marking liquidity pools by drawing lines on their pivots and labelling them so that you can instantly detect them on your realtime chart
It supports:
- marking previous and current day lows and highs
- marking previous and current week lows and highs
- marking previous and current month lows and highs
- marking equal lows and highs
technically it re-builds them on the last bar or as soon as new realtime bar is updated. it looks with 1k bars back to find higher timeframe ranges and find lows and highs there
Adjustments:
- changing the line style of the group
- changing the lines color and the labels on the groups
- currently pools are split on 2 groups Period Liquidity and Equal Pivots Liquidity.
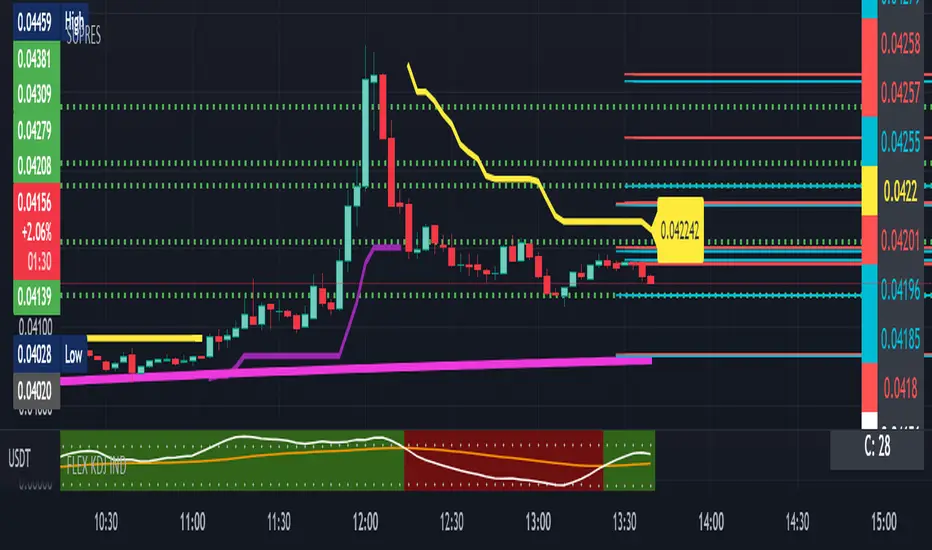
SUPRESHi Dears!
I hope that you enjoyed my "FLEX KDJ IND" till today!
Here, I want to publish one of my other golden indicators for you!
Contents:
+ SUPRES
+ SUPERTREND
+ T.O Line
- SUPRES (SUPPORT/RESISTANCE) is sensitive to trading volumes and with "BACHWARD" you can adjust the length of previous indices in investigation and "MEMORY" is an argument for calling maximum lines that have to be kept for "SUPPORT" and "RESIST".
- SUPERTREND is the normal prepared indicator which is defined in "TRADING VIEW"
-T.O is my suggestion instead of "EMA" to check the phase of session.
I hope that you enjoy this Indicator, please do not forgot to "Warm-It-UP"!
Happy trading,
Shakib
SR StrengthThis indicator measures the strength of support and resistance. Purple bars show SR is increasing. Blue bars show SR strength is decreasing. White bars show the peak of SR strength. The threshold of the white bars can be adjusted in the settings. These extremes happen before a boom. This indicator is also very useful for picking up reversals. Sensitivity can be adjusted to 20 or 50 to find smaller booms and pushed all the way to 1000 or more to find stronger booms.
Next Gen Auto S/RThis indicator will automatically plot support and resistance levels and will also allow you to overlay multi time frame support and resistance on any time frame that you are currently conducting analysis on. In addition you can also set alerts when a support and resistance level is tested, fine tune how many levels you would like to view on your charts, option to input how many candlesticks minimum you would like between support and resistance levels. You can also select breakout mode which will turn old support into resistance by a colour change and turn old resistance into support. NEW you can now use extended levels and change your zones into lines.

Trendlines Boll Ichi S1 by GammaprodI. How to use this indicator :
------------------------------
I.1. Set your teadingview theme to dark theme.
I.2. Gammaprod indicator is valid for forex, stock and but more valid for crypto.
I.3. Use three timeframe for more validation (choose between those, that fit to your trading style) :
- Timeframe 1m, 5m, and 15m for Scalping
- Timeframe 30m, 1h and 4h for Intraday
- Timeframe 4h, 1D and 1W for Swing Trading
I.4 Always use THREE INDICATORS FROM GAMMAPROD, those three indicators is back to back each other, by the way, I only made those three indicators only (for now) :
- Trendlines Boll Ichi S1 by Gammaprod
- MACD Volume S2 by Gammaprod
- Stoch RSI Divs Zone S2 by Gammaprod
============================================================================
II. How to setting :
--------------------
II.1. Trendlines Boll Ichi Crypto by Gammaprod
II.1.A. Support and Resistance
- Well if you familiar with this indicator you can add it, but recommended for Timeframe 30m or more
II.1.B. Trendlines Primary or Trendlines Secondary
- Timeframe 1m you DON'T NEED Trendlines Primary or Trendlines Secondary
- Timeframe 5m you DON'T NEED Trendlines Secondary, but you CAN ADD Trendlines Primary if you fell it helpful (for me, it is helpful to find where the candles start or the end trend or a consolidation or where the candles will surpass a resistance or a support).
- Timeframe 15m you DON'T NEED Trendlines Secondary, DEFENITELY add Trendlines Primary it will help to find where the candles stop or a consolidation or where the candles will surpass a resistance or a support).
- Timeframe 30m or more, DEFENITELY NEED BOTH Trendlines Primary and Secondary Trendlines, it will help to find where the candle stop or consolidation or where the candle will surpass a resistance or support).
II.1.C. Bollinger, Ichimoku Cloud and Lagging Span
- Please DON'T CHANGE IT at all, it's really helpful to know when and where to make an entry decesion or a trend or a consolidation, if you don't understand how to read it, you better to learn it first (on "how to read" section and "How to OPEN position" the section below)
II.2. Stoch RSI Divs Zone Crypto by Gammaprod (DON'T CHANGE IT)
II.3. MACD Volume Crypto by Gammaprod (DON'T CHANGE IT)
============================================================================
III. How to read :
------------------
III.1. Sell or Buy Priority :
III.1.A. Sell Priority
- Color background on macd and stoch rsi is pink or purple sell is the priority, (if you're not sure to buy, just wait until the best moment to sell)
III.1.B. Buy Priority
- Color background on macd and stoch rsi Teal or light green buy is the priority, (if you're not sure to sell, just wait until the best moment to buy)
III.1.C. Indecision / Golden Moment
- Color background on stoch rsi yellow is indecision / golden moment of reversal pattern (wait until it formed background only on Stoch RSI), please be careful at this moment.
III.2. Trend / Consolidation :
III.2.A. BULLISH trend
- When Stoch RSI and MACD have teal or light green background that's means BULLISH trend, better to confirm by the candle is above green cloud and lagging span (red line) is also above the candle.
III.2.B. BEARISH trend
- When Stoch RSI and MACD have the Pink or purple background that's means BEARISH trend, better to confirm by the candle is above purple cloud and lagging span (red line) is also below the candle.
III.2.C. CONSOLIDATION
- When Stoch RSI have the mix background that's means CONSOLIDATION, better to confirm by the candle is in or near to green / purple cloud and lagging span (red line) is also on the candle.
III.3. Special Mark
III.3.A. Ideal Bullish :
- Near line 20 and green / teal background = When Stoch RSI have the char R / H on lime color label, that's means divergence or hidden divergence for buy position, if you not see this label that's means just a standard confirmation for buy
III.3.B. Not an Ideal Bullish :
- Near line 80 and green / teal background = if this happens make sure you know what happen, it could be a false signal or bullish continual pattern
III.3.C. Ideal Bearish :
- Near line 80 and pink / purple background = When Stoch RSI have the char R / H on lime color label, that's means divergence or hidden divergence for buy position, if you not see this label that's means just a standard confirmation for sell position.
III.3.D. Not an Ideal Bearish:
- Near line 20 and pink / purple background = if this happens make sure you know what happen, it could be a false signal or bearish continual pattern
III.3.E. The Beginning of Reversal (from BEARISH to BULLISH) :
- When Stoch RSI line shaping GREEN position is near 20.
- MACD lines still PINK, position lines is UNDER the HISTOGRAM, but the HISTOGRAM start to SHAPE FALL PINK (light pink) and the BACKGROUND still PINK / PURPLE.
- Position CANDLES NEAR BLUE line, NEAR PURPLE CLOUD, and lagging span (red line) STILL ON the area candle. (it used to be confirmed with the golden moment).
III.3.F. The Beginning of Reversal (from BULLISH to BEARISH) :
- When Stoch RSI line shaping PINK position is near 80.
- MACD lines still GREEN, position lines is ABOVE the HISTOGRAM, but the HISTOGRAM start to SHAPE FALL GREEN (light green) and the BACKGROUND still TEAL / GREEN.
- Position CANDLES NEAR WHITE line, NEAR TEAL CLOUD, and lagging span (red line) STILL ON the area candle. (it used to be confirmed with the golden moment).
III.3.G. False Signals, or It could be a Golden Moment (better to see it on TF 15 or bigger):
- Near line 20 or 80 and yellow background = When Stoch RSI have the char R / H on color label, that's means divergence or hidden divergence for buy / sell position, if you not see this label that's means just a standard confirmation for buy / sell depends on where the Stoch RSI line if near 20 that's means buy, near 80 means sell
============================================================================
IV. How to OPEN position:
-------------------------
IV.1. Bullish
IV.1.A. Trendlines Boll Ichi S1 by Gammaprod
- The candles above the green cloud.
- Lagging span (red line) above the candles.
- then open buy near yellow line (the first option) / blue line (the second option) (always confirm the position with two other indicators below).
IV.1.B. MACD Volume S2 by Gammaprod
- Teal or Green background.
- The lines is shaped or shaping green.
- Better if at the green histogram.
IV.1.C. Stoch RSI Divs Zone S3 by Gammaprod
- Teal or Green background.
- The lines is shaping green.
- Better if on the bottom (at a range 20).
IV.2. Bearish
IV.2.A. Trendlines Boll Ichi S1 by Gammaprod
- The candles below the purple cloud.
- Lagging span (red line) below the candles.
- then open buy near yellow line (the first option) / white line (the second option) (always confirm the position with two other indicators below).
IV.2.B. MACD Volume S2 by Gammaprod
- Pink or purple background.
- The lines are shaped or shaping green.
- Better if at the pink histogram.
IV.2.C. Stoch RSI Divs Zone S3 by Gammaprod
- Pink or purple background.
- The lines are shaping pink.
- Better if the line on the top (at a range 80).
IV.3. Consolidation
IV.3.A. Trendlines Boll Ichi S1 by Gammaprod
- The candles on the cloud (green or purple).
- Lagging span (red line) on the candles.
- then open buy near the white or blue line (always confirm the position with two other indicators below).
IV.3.B. MACD Volume S2 by Gammaprod
- Changing the background.
- The line is near the middle line.
- Have small Histogram.
IV.3.C. Stoch RSI Divs Zone S3 by Gammaprod
- Mix background specially on a timeframe 15m or more.
- The line move fast up and down.
- Better if on the bottom or the top of the lines (at a range 20 or 80).
============================================================================
>> The secret ingredient is comparing the timeframe :
The example scalping (Timeframe 1m, 5m and 15m)
- TF 1m is for making an open position.
- TF 5m is for making a judgement of the trend market.
- TF 15m is to confirm that judgement from TF 5m, be careful if it not similar then it used to be a consolidation or the beginning of the reversal.
There's a lot a way to open the position than above information that i gave it to you, but consider there are a limit chars on this column, I hope it will help your trading and make a more profit on it.

Disclosure of 'MACD-Total' indicator (MACD-T)hello?
Traders, welcome.
If you "follow", you can always get new information quickly.
Please also click "Like".
Have a good day.
-------------------------------------
A trend indicator has been added to the previously published MACD-Price indicator.
The added MS-Signal indicator is an indicator for viewing the trend and the strength of the trend.
Trading with a trend line is not easy.
Therefore, various MA lines or slanted lines drawn on the chart are used to see the flow of the chart.
Therefore, it is not recommended to trade with the added MS-Signal indicator as support and resistance points.
A trade requires support and resistance points.
To mark support and resistance points, you need a point or section on the horizontal line.
Therefore, it is necessary to utilize the 'Buy/Sell' indicator corresponding to the previously disclosed MACD-Price indicator.
(1W chart)
The long horizontal point of the 'Buy/Sell' indicator serves as support and resistance.
It is possible to check in which section the trend reversal has changed by displaying the MS-Signal indicator.
(1D chart)
A move has emerged to show a reversal of the trend by breaking above the MS-Signal indicator.
Therefore, the MS-Signal indicator is about to change from a downtrend to an uptrend.
I numbered the horizontal line of the 'Buy/Sell' indicator.
The length is different in the order of No. 2 > No. 1 > No. 3.
Since horizontal line 2 is the longest, it indicates that support and resistance play the greatest role.
If you check the support at the first horizontal point, it can be interpreted that there is a high possibility of receiving resistance at the second horizontal point.
However, if you find support at the 2nd horizontal point, you can see that it will go up significantly with 3rd position.
Trading with indicators allows you to make quick choices and decisions.
However, more important than the use of indicators is your own trading strategy.
in other words,
- How much investment will you proceed with the purchase?
- How to proceed with installment purchases
- At what point will the Stop Loss be done?
- How long will the investment period be?
- Is it a long-term investment or a short-term investment?
As listed above, the most important trading strategy for trading should be established.
When conducting a trade, ignoring the above list and thinking about where to buy and where to sell is like sailing in the dark.
We disclose the indicators in the hope that it will become a faster and more objective indicator for trading with the trading strategy you have established.
thank you
------------------------------------------------------------ -----------------------------------------------------

Resistance/Support Indicator - FontiramisuIndicator showing resistances and support, based on pivots location
When a new pivot location is near from a resistance/support the latter gains weight.
You can modify multiple parameters :
Nb Max res/sup : Define the number max res/sup to keep in our res/sup history array. The greater it is the older bar index will be taken.
Nb show res/sup : Define the number of res/sup to be drawn.
Min weight shown : Define min res/sup weight to be shown. Weight is used to measure strengh of res/sup.
% range stack : Define price percentage change required to stack a pivot into an existing res/sup. Default is 0.015 = 1.5%.
Pivots are calculated with deviation parameter to validate with more precision.
Fontilab Library is used to code this indicator.

fontilabLibrary "fontilab"
Provides function's indicators for pivot - trend - resistance.
pivots(src, lenght, isHigh) Detecting pivot points (and returning price + bar index.
Parameters:
src : The chart we analyse.
lenght : Used for the calcul.
isHigh : lookging for high if true, low otherwise.
Returns: The bar index and the price of the pivot.
calcDevThreshold(tresholdMultiplier, closePrice) Calculate deviation threshold for identifying major swings.
Parameters:
tresholdMultiplier : Usefull to equilibrate the calculate.
closePrice : Close price of the chart wanted.
Returns: The deviation threshold.
calcDev(basePrice, price) Custom function for calculating price deviation for validating large moves.
Parameters:
basePrice : The reference price.
price : The price tested.
Returns: The deviation.
pivotFoundWithLines(dev, isHigh, index, price, dev_threshold, isHighLast, pLast, iLast, lineLast) Detecting pivots that meet our deviation criteria.
Parameters:
dev : The deviation wanted.
isHigh : The type of pivot tested (high or low).
index : The Index of the pivot tested.
price : The chart price wanted.
dev_threshold : The deviation treshold.
isHighLast : The type of last pivot.
pLast : The pivot price last.
iLast : Index of the last pivot.
lineLast : The lst line.
Returns: The Line and bool is pivot High.
getDeviationPivots(thresholdMultiplier, depth, lineLast, isHighLast, iLast, pLast, deleteLines, closePrice, highPrice, lowPrice) Get pivot that meet our deviation criteria.
Parameters:
thresholdMultiplier : The treshold multiplier.
depth : The depth to calculate pivot.
lineLast : The last line.
isHighLast : The type of last pivot
iLast : Index of the last pivot.
pLast : The pivot price last.
deleteLines : If the line are draw or not.
closePrice : The chart close price.
highPrice : The chart high price.
lowPrice : The chart low price.
Returns: All pivot the informations.
getElIntArrayFromEnd() Get the last element of an int array.
getElFloatArrayFromEnd() Get the last element of an float array.
getElBoolArrayFromEnd() Get the last element of a bool array.
isTrendContinuation(isTrendUp, arrayBounds, lastPrice, precision) Check if last price is between bounds array.
Parameters:
isTrendUp : Is actual trend up.
arrayBounds : The trend array.
lastPrice : The pivot Price that just be found.
precision : The percent we add to actual bounds to validate a move.
Returns: na if price is between bounds, true if continuation, false if not.
getTrendPivots(trendBarIndexes, trendPrices, trendPricesIsHigh, interBarIndexes, interPrices, interPricesIsHigh, isTrendHesitate, isTrendUp, trendPrecision, pLast, iLast, isHighLast) Function to update array and trend related to pivot trend interpretation.
Parameters:
trendBarIndexes : The array trend bar index.
trendPrices : The array trend price.
trendPricesIsHigh : The array trend is high.
interBarIndexes : The array inter bar index.
interPrices : The array inter price.
interPricesIsHigh : The array inter ishigh.
isTrendHesitate : The actual status of is trend hesitate.
isTrendUp : The actual status of is trend up.
trendPrecision : The var precision to add in "iscontinuation" function.
pLast : The last pivot price.
iLast : The last pivot bar index.
isHighLast : The last pivot "isHigh".
Returns: trend & inter arrays, is trend hesitate, is trend up.
drawBoundLines(startIndex, startPrice, endIndex, endPrice, breakingPivotIndex, breakingPivotPrice, isTrendUp) Draw bounds and breaking line of the trend.
Parameters:
startIndex : Index of the first bound line.
startPrice : Price of first bound line.
endIndex : Index of second bound line.
endPrice : price of second bound line.
breakingPivotIndex : The breaking line index.
breakingPivotPrice : The breaking line price.
isTrendUp : The actual status of the trend.
Returns: The lines bounds and breaking line.

Take profit Multi timeframeRepublish:
Take profit Multi timeframe:
In this scipts, I build risk-reward system managemant. You can take profit in two way: percent or at resistant in higher timeframe or both.
Strategy in this scripts, I use Wave trend indicator as example strategy.

ATR and IV Volatility TableThis is a volatility tool designed to get the daily bottom and top values calculated using a daily ATR and IV values.
ATR values can be calculated directly, however for IV I recommend to take the values from external sources for the asset that you want to trade.
Regarding of the usage, I always recommend to go at the end of the previous close day of the candle(with replay function) or beginning of the daily open candle and get the expected values for movements.
For example for 26April for SPX, we have an ATR of 77 points and the close of the candle was 4296.
So based on ATR for 27 April our TOP is going to be 4296 + 77 , while our BOT is going to be 4296-77
At the same time lets assume the IV for today is going to be around 25% -> this is translated to 25 / (sqrt (252)) = 1.57 aprox
So based on IV our TOP is going to be 4296 + 4296 * 0.0157 , while our BOT is going to be 4296 - 4296 * 0.0157
I found out from my calculations that 80-85% of the times these bot and top points act as an amazing support and resistence points for day trading, so I fully recommend you to start including them into your analysis.
If you have any questions let me know !

Donchian Channels ModDONCHIAN FIBONACCI MODD VERSION
This indicator is based on a Donchian Channel with Fibonacci zones based on high and lows of certain period . As one can see it clearly identifies the trend and it only turns aqua when its above a spefic fib level and turns red when below specfic fib level , this help traders by not talking long or short position while its in no trade zone when the candle turns gray .This works on ALL TIMEFRAME & ANY SEGMENT
Aqua candle= Super Bullish
Red candle= Super Bearish
Gray Candle= NO TRADE ZONE (can take long or short in retracement coz the stop loss will be minimum )
Long condition = When the candle turns lime one can place the SL at the Low of the band and keep trailing , at time the trend is still long and candle turns gray one can re entry long just at support and place the SL just below the band .
Short condition = When the candle turns red one can place the SL at the High of the band and keep trailing, at time the trend is still short and candle turns gray one can re entry short just at the resistance and place the SL just below the band .
Hope this be helpful for my trading view family !
God Bless !

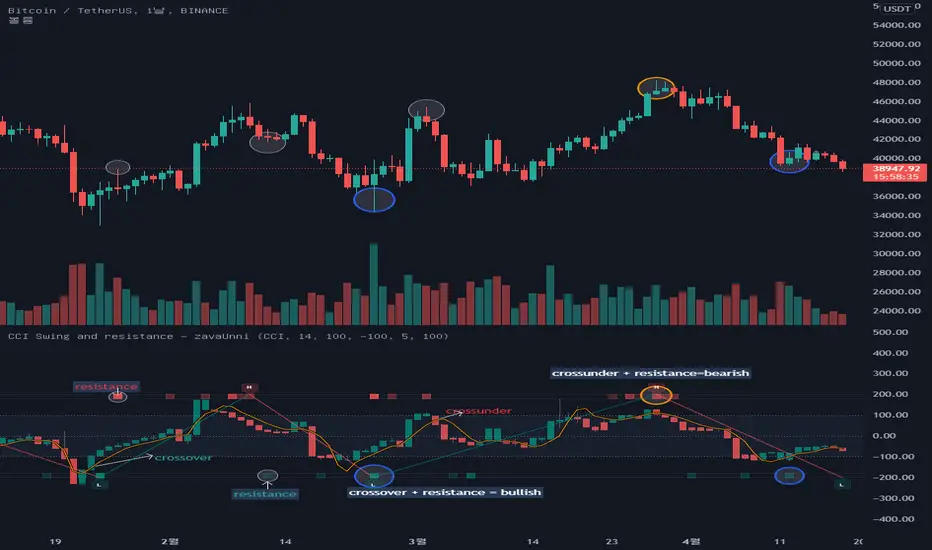
CCI Swing and resistance [zavaUnni] The candles you see on this indicator is the value open price, closing price, high, and low is converted to a selected index value.
Select from selectable settings: rsi , cci , mfi , or stochstic
The default indicator is set to cci .
O_ = ta. cci (open,i_length)
H_ = ta. cci (high,i_length)
L_ = ta. cci (low,i_length)
C_ = ta. cci (close,i_length)
Like the close, open, high, low price, the MA value is converted to the selected index and displayed as a yellow line
short_A = ta. sma (close, short_lenA)
short = ta. cci (short_A,i_length2)
The MA length can be converted from the set value and is defaulted to 5 days.
If C_ is above short, it looks like a teal color, and if C_ is below, it looks like a red color.
-High and low -
When the selected index reaches the oversold value, it finds a high value, and when it reaches the oversold value, it finds a low value.
Oversold and overbought values can be changed in the setting, and the default setting is 100 and -100.
The default setting is recommended unless otherwise noted.
The method of finding the low value is to find the lowest value (var) when the index crosses from 100 to reach -100, until it rises to 100.
The same is true of finding high values.
It was marked with a teal color when going from oversold to oversold, and red color when going down from oversold to oversold.
-os, ob and resistances-
The bar at the top and bottom of the index shows resistance, over-buying, and over-selling values
Over-buying and over-selling values are hidden, so you can change them to be seen if necessary.
1. The volume is large, but if the change rate of candlestic(spred_rate) is not large, resistance has occurred.
2. If thespred_rate is excessively large compared to the volume , oversold or oversold occurs.
Based on the above two basic theories, we created the following formula to derive the strength of the resistance.
Resistance Index = spred_rate / volume
We find the average value of the resistance Index,
If the spred_rate is higher than the predicted value, it is oversold or oversold.
If the spred_rate value is lower than the predicted value, the resistance was derived as the issuance signal.
The larger the deviation from the predicted value, the higher the saturation.
The presence of bright red can be seen as a result of greater resistance.
The same goes for over-buying and over-selling prices
The brighter the gray, the more spread without trading volume , and it can be judged that it is not a true bull or a true bear.
resistances and divergence[zavaUnni]
Select from selectable settings: rsi, cci, mfi, or stochstic
The default indicator is set to cci.
When you select an indicator in Settings, you can see the diversity that occurs in that indicator.
Resistance fills the histogram in yellow; the stronger the resistance, the higher the saturation.
If the volume is large but the change rate of candlestic(spred_rate) is not large, it means resistance has occurred.
It is a method of finding anomalies in the spred_rate and volume relationship.
After obtaining the accumulated spred_raterelative to the accumulatedvolume value,
we calculated that the larger the difference is, the larger the resistance value.
The formula with the resistanc
a_sma = ta.cum(spred_rate)/ta.cum(volume)
ifpricebull = open+(open*a_sma * volume)
ifpricebear = open-(open*a_sma * volume)
bullD = close>ifpricebull or closeifpricebull or close

PercentagefromEMAEMA (Exponential moving average) often acts as dynamic support and resistance and trend detector and the further price is away from ema the more it has chance to reverse, hence percentage levels gives a range to exit your trades.
*choose your favourite timeframe and EMA length , alter percentages as you wish to generate Take profit levels
thank you..
Happy Trading.
