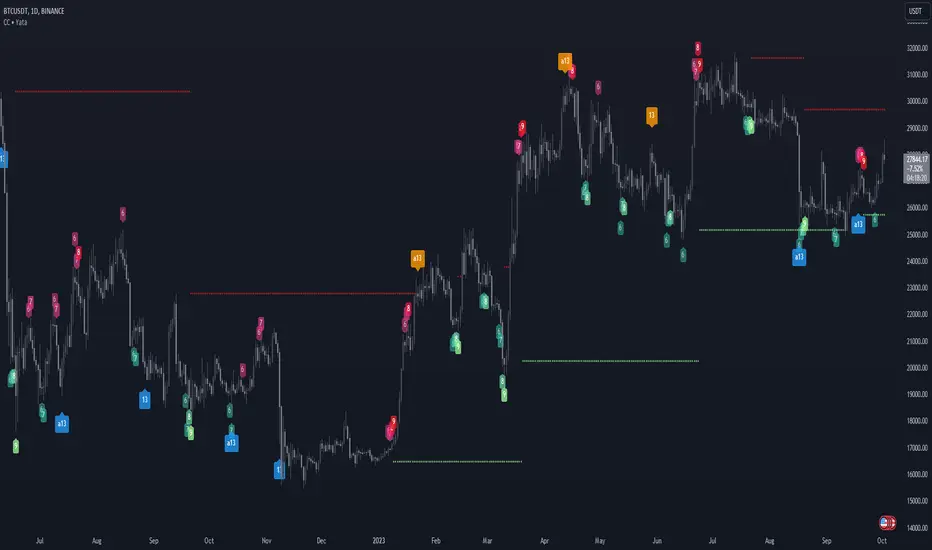
Trend Reversal System with SR levelsHello All,
This is the Trend Reversal System with Support/Resistance levels script. long time ago I published it as closed source but now I upgraded it and and published as open-source with a different name. I hope it would be useful for you all while trading/analyzing.
The script has some parts in it: Setup, Count, SR levels, Risk levels & Targets . Now lets check them:
Setup Part: it has two part, Buy or Sell Setup. one of them can be active only. Buy setup: if current close checks if current is lower/equal than the close of the 5. bar. if yes then the script increases number of buy setup. and if it reaches 9 then the script checks if current low is lower/equal than the lows of last 3. and 4. bars, or if the low of the last bar is lower/equal than the lows of last 3. and 4. bars. if yes then the script increases the buy setup by 1. if these conditions met then it puts the label 'S' , same for Sell setup. S labels on both setup are potential reversals.
Count Part: If buy or sell setup reaches the 9 then Count part starts from 1. lets see buy count: If current close is lower/equal than the low of the 3. bar and buy count is lower than 12 or low of the bar 13 is less than or equal to the close of bar 8 then buy count increase or it's completed. if it's completed then the script puts C label, and it's potential reversal. of course there are some conditions that can cancel the count buy/sell or recycle/restart.
By using Setup and Count levels the script can show Support/Resistance Levels, Risk levels & Targets. SR levels are potential reversal levels.
Lets see some example screenshots:
Support/Resistance levels:
Potential Reversal levels and how setup/counts are shown:
Count part can recycle and the script shows it as 'R' , ( you can see the conditions for Recycle in the script ):
Count can be cancelled and and it's shown as 'x'
If the scripts find 9 on Setup or 13 on Count then it checks if it's a good level to buy/sell and if it decides it's good level then it shows TRSSetup Buy/Sell or TRSCount Buy/Sell and also shows the target. in following example the script checks and decide it's a good level to take long position. it can be aggressive or conservative, Conservative is recommended.
Enjoy!
Reversal

Deviations from ARL (DARL)Similar to Bollinger Bands, this indicator uses standard deviations but from Adaptive Rebound Lines (See: 'ARL').
The adaptiveness of the 'ARL' is further affected by volatility and helps greatly in spotting the possible strength and direction of rebounds.
All this information is presented with minimal lag thanks to the rebound qualities of the 'ARL' adapting to market volatility.
----- HOW TO USE IT -----
1) Use with 1h time frame.
2) Smaller width typically means that price will be moving is smaller movements.
3) Small price movements while the width is increasing typically means that a large price move will occur soon.
4) Larger width typically means that price will be moving in larger movements.
5) Very large width with sideways price typically means that the price will have a bias towards the center.
Note: A V-Offset of 1 is also a good setting alternative for this indicator.
----- HOW THIS INDICATOR IS ORIGINAL; WHAT IT DOES AND HOW IT DOES IT -----
This indicator has an original, unique ability in anticipating the strength and direction of a price rebound while at the same time showing the bias of the rebound with minimal lag.
It does this by letting the adaptive qualities of the 'ARL' be affected by market volatility, not just by price movement alone.
----- VERSION -----
This indicator is not a variation, replacement, or presentation of the 'ARL' or the 'ARL' Bands -- it merely derives its base calculations for standard deviations from the 'ARL'.
However, this indicator affects the calculations of the standard 'ARL' with volatility and creates a new, unique calculation.
It thus presents a totally different context for price action.
A standard 'ARL' helps in finding possible rebounds but it does not help in finding the strength of them or the directional bias of a rebound.
This is because a standard 'ARL' is more negligent of market volatility and adapts to price movement alone.
In contrast, this indicator does help in anticipating the strength and direction of the rebound because it adapts deviations from an 'ARL' to market volatility.
Therefore, the lines cannot be adjusted individually but in pairs and only further from their respective, mirroring lines.

Sushi Trend [HG]🍣 The Sushi Roll, a trading concept conceived at a restaurant by Mark Fisher.
While the indicator itself goes by Sushi Trend, it is completely backed by the idea of Mark Fisher's Sushi Roll Reversal Pattern. No, it has nothing to do with raw fish, it just so happens that somebody was ordering sushi during the discussion of the idea, and that's how it got its name.
📝 Origin
First mentioned in his book, The Logical Trader --- the idea of the Sushi Roll is to serve as an early warning system to identify reversals in the market. Fisher defines the pattern as a series of 10 bars, split into two different sections, seen as 5 and 5. In order for the pattern to be emitted, the 5 bars to the right must completely engulf the 5 bars to the left. It's not a super complex system and is in fact extremely simple to grasp.
📈 Supertrend Similarities
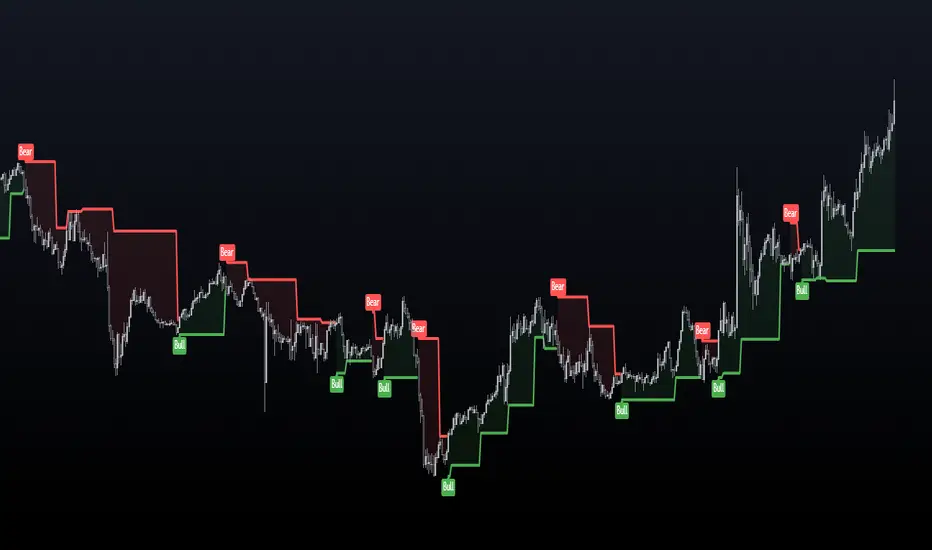
Instead of displaying the pattern in the way Fisher meant for it to be portrayed (as seen in the photo above), I instead turned it into an indicator similar to that of Supertrend while also inheriting the same concepts from the pattern. I did this because the pattern itself has inconsistencies which can be quite noticeable when trading with it after a while. For example, these patterns can occur even during consolidating periods, and even though the pattern is meant to be recognized during trending markets, the engulfing bars can sometimes be left with indecisive directions.
➡️ The Result
Here is the result, visualized to be better in a trending format. (The indicator will not contain the boxes.)
While Fisher does mention the pattern to include 10 bars, you can actually use this pattern with any number of bars. At the end of the day, it's a concept derived from a discussion at a Japanese restaurant, and a pattern that has been around for years that has seen results. Due to this, I added an input option to control the series of bars for right-bar engulf detection.
To reassure the meaning of the pattern --> "A series of 10 bars" means 5 left bars and 5 right bars. So if you want to check if 5 right bars are engulfing the previous 5 bars (as seen in the photo above), you would want to select 5 in the input settings.
You can learn more about it from the following links
Market Reversals and the Sushi Roll Technique
The Logical Trader
Rainbow Collection - BlueSlopes are an increasingly key concept in Technical Analysis. The most basic type is to calculate them on the prices, but also on technical indicators such as moving averages and the RSI.
In technical analysis, you generally use the RSI to detect imminent reversal moves within a range. In the case of the Blue indicator, we are calculating the slope of the market price and then calculating the RSI of that slope in order to detect instances of reversal.
The Blue indicator is therefore used as follows:
* A bullish signal is generated whenever the 21-period RSI of the 21-period market slope surpasses 30 after having been below it but remains below 35.
*A bearish signal is generated whenever the 21-period RSI of the 21-period market slope breaks 70 after having been above it but remains above 65.
The aim of the Blue indicator is to capture reversals as early as possible through a combination of slopes and entry techniques.

Rainbow Collection - VioletMoving averages come in all shapes and types. The most basic type is the simple moving average which is simply the sum divided by the quantity. Therefore, the simple moving average is the sum of the values divided by their number.
In technical analysis, you generally use moving averages to understand the underlying trend and to find trading signals. In the case of the Violet indicator, we are using a Hull moving average which is a special variation based on different weights to minimize lag.
The Violet indicator is therefore used as follows:
* A bullish signal is generated whenever the close price surpasses the 20-period Hull moving average while the previous close prices from periods were all below their respective Hull moving average of the period.
*A bearish signal is generated whenever the close price breaks the 20-period Hull moving average while the previous close prices from periods were all above their respective Hull moving average of the period.
The aim of the Violet indicator is to capture reversals as early as possible through a combination of lagged conditions based on the Fibonacci sequence.

Reversal PointsHi , in this script i tried to find reversal points on big trends. For this purpose i have used Supertrend and Donchian channels. I combined both in a single indicator for finding reversal points. I am suggesting for using higher time frames like 4 hours or 1 day. It will be work in lower time frames too. But the signals will be less reliable than higher timeframes. Here is settings in this script:
New low sensitiity : this setting for donchian channels lookback. Bigger value result as less signals.
Atr Period: Period for Atr , it is for supertrend indicator in it.
Source: Source for supertrend indicator.
Atr Multiplier : Atr multiplier setting for Supertrend. Bigger value will be result as less signals.
Good luck.
Enes.

Return Abnormality Score [SpiritualHealer117]The Return Abnormality Score indicator is designed to help traders identify potential reversals in price by detecting abnormal daily returns beyond a certain significance level. The indicator uses a normal cumulative distribution function to calculate the probability of the daily return and flags it when it exceeds the specified significance level.
Traders can use this indicator by monitoring the abnormality score. If the daily return is negative, the probability is multiplied by a negative number. Therefore, if the abnormality score goes above the positive threshold, it suggests that the price is oversold, while if it goes below the negative threshold, it indicates that the price is overbought. It can also be helpful for spotting bear or bull traps due to their irregular behavior.
Depending on the trader's preference, the indicator can be smoothed or unsmoothed.
This indicator should be paired with other technical analysis tools like SSL Hybrid for trend confirmation, and proper risk management strategies.

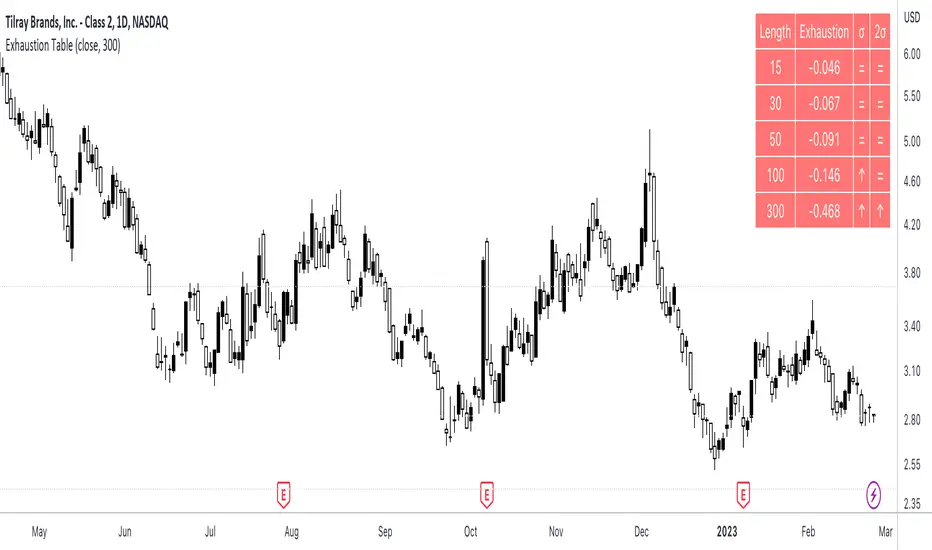
Exhaustion Table [SpiritualHealer117]A simple indicator in a table format, is effective for determining when an individual stock or cryptocurrency is oversold or overbought.
Using the indicator
In the column "2σ" , up arrows indicate that the asset is very overbought , down arrows indicate that an asset is very oversold , and an equals sign indicates that the indicator is neutral.
In the column "σ" , up arrows indicate that the asset is overbought , down arrows indicate that an asset is oversold , and an equals sign indicates that the indicator is neutral.
What indicator is
The indicator shows the exhaustion (percentage gap between the closing price and a moving average) at 5 given lengths, 15, 30, 50, 100, and 300. It compares that to two thresholds for exhaustion: one standard deviation out and one two standard deviations out.
Swing Levels and Liquidity - By LeviathanThis script will plot pivot points (swing highs and lows) in the form of lines, boxes or labels to help you identify market structure, “liquidity” areas, swing failure patterns, etc. You are also able to see the volume traded at each pivot point, which will help you compare their significance.
Bars Left-Right
A pivot high (swing high) is a bar in a series of bars that has a higher value than the bars around it and a pivot low (swing low) is a bar in a series of bars that has a lower value than the bars surrounding it. The Bars Left and Bars Right parameters are used to define the number of bars on the left and right sides of a pivot point that the function should consider when identifying pivot highs and lows in a time series. For example, if Bars Left is set to 5 and Bars Right is set to 6, the function will look for a pivot point by comparing the value of the current bar with the values of the 5 bars to its left and the 6 bars to its right. If the value of the current bar is higher than all of these bars, it is considered a pivot high point. These parameter can be used to adjust the sensitivity of the script (lowering the Bars Left and Bars Right parameters will give you more swing points and increasing the Bars Left and Bars Right parameters will give you fewer swing points).
”Show Boxes” - This will draw a box above the swing high and a box below the swing low to help you visualise a large area of interest around swing points. Additional box types and the width of the box can be adjusted in Appearance settings below.
”Show Lines” - This will draw a horizontal line at the level of each swing high and swing low.
”Show Labels” - This will plot a circle at the high point of each swing high and at the low point of each swing low.
”Show Volume” - This will display the amount of volume traded in a given swing point candle. It can help you identify the significance of a given swing point by comparing it to the volumes of other swing points.
”Extend Until Filled” - This will extend the swing point levels until they are mitigated by the price. Turning it off will continue plotting the levels just a few more bars after a swing point occurs.
”Appearance” - You can show/hide swing points, choose the colors of labels, lines and boxes, choose the size and positioning of the text, choose line and box appearance (adjust the Box Width when switching between timeframes!) and more.
More updates coming soon (MTF, more data…)

Fibonacci Levels Based on Supertrend [By MUQWISHI]A “ Fibonacci Levels Based on Supertrend ” indicator is supertrend indicator planned with Fibonacci retracements levels. Fibonacci retracements provides a sequence of levels starting from 0% to 100% in addition to extension levels. 0% is measured to be the initial Supertrend line, and 100% is the previous Supertrend line where it has been broken by candle. This tool could be valuable in terms of managing trades by setting targets and reducing the risk in the trend direction.
█ OVERVIEW
█ INDICATOR SETTINGS
Please let me know if you have any questions.
Thank you.

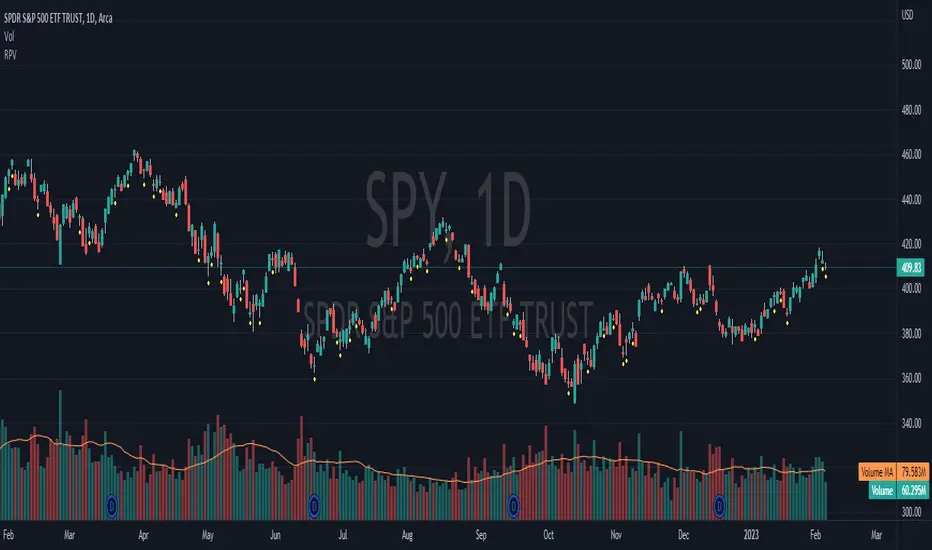
Relative Price Volume
Relative Price Volume is an indicator which shows anomalies between price and volume on a chart over a given period. The goal is to identify potential reversal and/consolidation areas for price as it relates to volume. It is a simple variation of a Volume at Price indicators. It can also be used to mark potential support and resistance lines on the chart as the areas it signals is where the price battles are waged.
Settings:
Period = length for which to calculate average candle body and average volume
Long Factor = relative size multiplier to determine if a candle is larger than average or if volume is higher than average
Short Factor = relative size multiplier to determine if a candle is smaller than average or if volume is lower than average
Anomaly Conditions
1. If a candle is larger than average and volume is lower than average, then this is an anomaly, and we should be on alert for a change in momentum.
2. if a candle is smaller than average and volume is higher than average, then this too is an anomaly and should put us on alert.
The indicator will draw a cross on the chart indicating the candle is that is flashing the warning that the run is done and a potential consolidation and/or reversal is pending. Used in conjunction with support and resistance levels this could signal a time to enter or exit a trade.
The default size factors considers a candle or volume:
1. Larger than average if it is 60% or more (.6) larger than average.
2. Smaller than average if it is 40% or less (.4) smaller than average.
Hope this helps! Happy trading!
PinBar Detector [Mr_Zed]Pinbar Detector is a technical analysis tool designed to detect Pinbar patterns in financial markets. Pinbars are reversal patterns that indicate a potential change in trend.
This indicator is based on an existing Pinbar detector in MQ4/5 format, originally developed by "earnforex".
The PineScript version is written to work in TradingView, and can be applied to any chart to identify Pinbar formations. The indicator uses specific criteria to identify Pinbars, such as the length of the wick and the relationship between the wick and the body of the candlestick. By displaying the Pinbars on the chart, traders can make informed decisions about entering or exiting trades based on their analysis of the market's potential trend reversal.
enjoy !

GRIDBOT Scalper by nnamWhat is this Indicator used for?
Made specifically for GRID Bots
note: before continuing... this indicator works on any timeframe, but it WORKS BEST ON THE 15 MINUTE TIMEFRAME
Straters and Forex Master Pattern Value Line Traders use this to help determine when the price could reverse.
This indicator is a scalping indicator that produces signals when a "potential" reversal in price is indicated. When the price moves UP and a Potential Bearish Reversal Signal occurs, traders can use this signal as a potential SHORT entry signal for their Short Grid Bot. The process is the same in reverse. After a sustained move down, a Potential Bullish Signal can be used by the trader as a potential LONG entry signal for their GridBot.
As shown in the screenshot below, lines develop on the chart (either RED or GREEN) indicating that a sustained move in one direction is currently occurring; however, there is no potential reversal signal plotted (this means that price action is currently moving in one direction only).
As shown in the screenshot below, lines can be used as a stop-loss after entering the GRIDbot. (usually, by this time, the Grid Bot is in Profit as it usually moves in the opposite direction first)
What this Indicator Does
The GRIDBOT Scalper provides information regarding potential reversals in the market after a sustained movement in one direction (either Bullish or Bearish).
The indicator is based on PRICE-ACTION ONLY and does not take into account the current state of the market (Bullish or Bearish).
Once the price moves in a particular direction for at least 14 bars , a line appears as shown in a previous screenshot. Once the price stops moving in that direction and begins moving in the opposite direction - and after a sustained run - a "signal" appears alerting the trader that a "potential" reversal could be on the horizon soon.
If price moves in one direction and plots both a line and a signal and then begins moving back in the other direction in a sustained manner, the original signal will remain even when a NEW line begins forming (the original line will disappear). (see below) This line will continue to move as the price continues to move. Not until a signal plots on the chart is the potential reversal forming. THE LINE DOES NOT SIGNAL A REVERSAL . Some traders, however, use this information to "ride the wave UP or DOWN" and exit their positions once the signal prints.
As shown below, optional input settings allow the trader to set the line at CLOSE or HIGH/LOW of the candle preceding the potential reversal.
It is suggested to use Close instead of High or Low but the setting allows one to use either.
As shown in the screenshot below, it is typical on LOWER TIME FRAMES to see the price pass the signal line. The Indicator works best on the 15 minute timeframe, as it gives the trader time to make the decisions required as the volatility is less on the 15 minute chart vs the 1 minute or 5 minute charts.
If you have any questions or suggestions for this indicator, please join our Discord. We offer free training on this Indicator on our Discord Server.

Consecutive Candles lite | Multi Timeframe
Choose to display numbers from 6, 7, 8 or only 9, showing a colored dot until the last number is reached to reduce the clutter
Support and resistance
Customizable labels, several styles are available
Identifies turning point in the trending price of an asset or an index.

Consecutive Candles | Multi Timeframe
Display all numbers or choose from 6, 7, 8 and 9 to reduce the clutter
Support and resistance
Customizable labels, several styles are available
Identifies turning point in the trending price of an asset or an index.
Trendly
╭━━━━╮╱╱╱╱╱╱╱╱╭┳╮
┃╭╮╭╮┃╱╱╱╱╱╱╱╱┃┃┃
╰╯┃┃┣┻┳━━┳━╮╭━╯┃┃╭╮╱╭╮
╱╱┃┃┃╭┫┃━┫╭╮┫╭╮┃┃┃┃╱┃┃
╱╱┃┃┃┃┃┃━┫┃┃┃╰╯┃╰┫╰━╯┃
╱╱╰╯╰╯╰━━┻╯╰┻━━┻━┻━╮╭╯
╱╱╱╱╱╱╱╱╱╱╱╱╱╱╱╱╱╭━╯┃
╱╱╱╱╱╱╱╱╱╱╱╱╱╱╱╱╱╰━━╯
About the script:
This script is an easy-to-use trend indicator, which is based on another popular indicator called "Supertrend" . The basic idea is very simple, i.e. to compute Average True Range(ATR) and use that as the basis for trend detection. The key difference lies in a custom trend detection method, that computes trends across different timeframes and projects them in a table view. The script also tries to improve the behaviour of the existing indicator by highlighting flat regions on the chart, indicating sideways market or potential trend reversals.
How to use it:
You can use it just like any other indicator, add it to your chart and start analysing market trends. Results can be interpreted as follows.
Indicator output is currently made up of two main components:
>> Trend Table:
Appears at the bottom right of your screen
Contains trend indicator for 9 different timeframes
Timeframes can be adjusted using indicator settings panel
Green Up Arrow --> Up Trend
Red Down Arrow --> Down Trend
>> Enhanced Supertrend:
Shows up as a line plot on the chart
Green line indicates up trend
Red line indicates down trend
White regions indicates slow moving markets or a potential trend reversal
Indicator can be used on any timeframe, it provides a view of current and historical market trend
Can be used as an indicator for entering/exiting trades
Can be used to build custom trading strategies

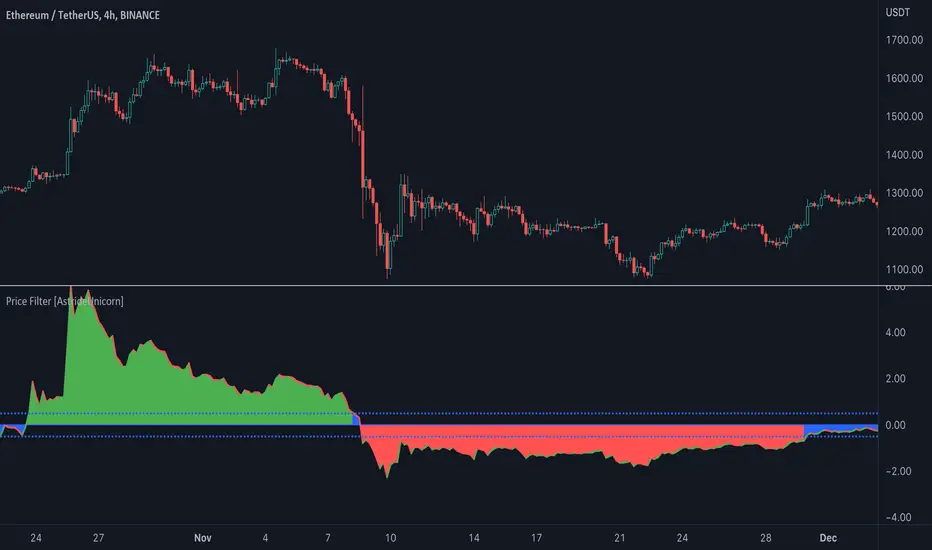
Price Filter [AstrideUnicorn]The indicator calculates a fast price filter based on the closing price of the underlying asset. Overall, it is intended to provide a fast, reliable way to detect trend direction and confirm trend strength, using statistical measures of price movements.
The algorithm was adapted from Marcus Schmidberger's (2018) article "High Frequency Trading with the MSCI World ETF". It demeans the price time series using the long-term average and then normalizes it with the long-term standard deviation. The resulting time series is then compared to specified thresholds to determine the trend direction.
HOW TO USE
The indicator surface is colored green if the price is trending upwards and red if the price is trending downwards. If the indicator outline is the opposite color of the indicator surface, it indicates that the price is moving against the trend and the current trend may be losing strength.
If the 'Use threshold' setting is enabled, the indicator will be colored blue if its value is within the range defined by the upper and lower thresholds. This indicates that the price is trending sideways, or that the current trend is losing strength.
SETTNGS
Length - the length of the long-term average used to calculate the price filter. Recommended range 20 - 200. The sensitivity of the indicator increases as the value becomes smaller, allowing it to detect smaller price moves and swings earlier.
Threshold - the threshold value used to detect trend direction.
Use threshold - a boolean (true/false) input that determines whether to use the threshold value for confirmation.
Musashi_Fractal_Dimension === Musashi-Fractal-Dimension ===
This tool is part of my research on the fractal nature of the markets and understanding the relation between fractal dimension and chaos theory.
To take full advantage of this indicator, you need to incorporate some principles and concepts:
- Traditional Technical Analysis is linear and Euclidean, which makes very difficult its modeling.
- Linear techniques cannot quantify non-linear behavior
- Is it possible to measure accurately a wave or the surface of a mountain with a simple ruler?
- Fractals quantify what Euclidean Geometry can’t, they measure chaos, as they identify order in apparent randomness.
- Remember: Chaos is order disguised as randomness.
- Chaos is the study of unstable aperiodic behavior in deterministic non-linear dynamic systems
- Order and randomness can coexist, allowing predictability.
- There is a reason why Fractal Dimension was invented, we had no way of measuring fractal-based structures.
- Benoit Mandelbrot used to explain it by asking: How do we measure the coast of Great Britain?
- An easy way of getting the need of a dimension in between is looking at the Koch snowflake.
- Market prices tend to seek natural levels of ranges of balance. These levels can be described as attractors and are determinant.
Fractal Dimension Index ('FDI')
Determines the persistence or anti-persistence of a market.
- A persistent market follows a market trend. An anti-persistent market results in substantial volatility around the trend (with a low r2), and is more vulnerable to price reversals
- An easy way to see this is to think that fractal dimension measures what is in between mainstream dimensions. These are:
- One dimension: a line
- Two dimensions: a square
- Three dimensions: a cube.
--> This will hint you that at certain moment, if the market has a Fractal Dimension of 1.25 (which is low), the market is behaving more “line-like”, while if the market has a high Fractal Dimension, it could be interpreted as “square-like”.
- 'FDI' is trend agnostic, which means that doesn't consider trend. This makes it super useful as gives you clean information about the market without trying to include trend stuff.
Question: If we have a game where you must choose between two options.
1. a horizontal line
2. a vertical line.
Each iteration a Horizontal Line or a Square will appear as continuation of a figure. If it that iteration shows a square and you bet vertical you win, same as if it is horizontal and it is a line.
- Wouldn’t be useful to know that Fractal dimension is 1.8? This will hint square. In the markets you can use 'FD' to filter mean-reversal signals like Bollinger bands, stochastics, Regular RSI divergences, etc.
- Wouldn’t be useful to know that Fractal dimension is 1.2? This will hint Line. In the markets you can use 'FD' to confirm trend following strategies like Moving averages, MACD, Hidden RSI divergences.
Calculation method:
Fractal dimension is obtained from the ‘hurst exponent’.
'FDI' = 2 - 'Hurst Exponent'
Musashi version of the Classic 'OG' Fractal Dimension Index ('FDI')
- By default, you get 3 fast 'FDI's (11,12,13) + 1 Slow 'FDI' (21), their interaction gives useful information.
- Fast 'FDI' cross will give you gray or red dots while Slow 'FDI' cross with the slowest of the fast 'FDI's will give white and orange dots. This are great to early spot trend beginnings or trend ends.
- A baseline (purple) is also provided, this is calculated using a 21 period Bollinger bands with 1.618 'SD', once calculated, you just take midpoint, this is the 'TDI's (Traders Dynamic Index) way. The indicator will print purple dots when Slow 'FDI' and baseline crosses, I see them as Short-Term cycle changes.
- Negative slope 'FDI' means trending asset.
- Positive most of the times hints correction, but if it got overextended it might hint a rocket-shot.
TDI Ranges:
- 'FDI' between 1.0≤ 'FDI' ≤1.4 will confirm trend following continuation signals.
- 'FDI' between 1.6≥ 'FDI' ≥2.0 will confirm reversal signals.
- 'FDI' == 1.5 hints a random unpredictable market.
Fractal Attractors
- As you must know, fractals tend orbit certain spots, this are named Attractors, this happens with any fractal behavior. The market of course also shows them, in form of Support & Resistance, Supply Demand, etc. It’s obvious they are there, but now we understand that they’re not linear, as the market is fractal, so simple trendline might not be the best tool to model this.
- I’ve noticed that when the Musashi version of the 'FDI' indicator start making a cluster of multicolor dots, this end up being an attractor, I tend to draw a rectangle as that area as price tend to come back (I still researching here).
Extra useful stuff
- Momentum / speed: Included by checking RSI Study in the indicator properties. This will add two RSI’s (9 and a 7 periods) plus a baseline calculated same way as explained for 'FDI'. This gives accurate short-term trends. It also includes RSI divergences (regular and hidden), deactivate with a simple check in the RSI section of the properties.
- BBWP (Bollinger Bands with Percentile): Efficient way of visualizing volatility as the percentile of Bollinger bands expansion. This line varies color from Iced blue when low volatility and magma red when high. By default, comes with the High vols deactivated for better view of 'FDI' and RSI while all studies are included. DDWP is trend agnostic, just like 'FDI', which make it very clean at providing information.
- Ultra Slow 'FDI': I noticed that while using BBWP and RSI, the indicator gets overcrowded, so there is the possibility of adding only one 'FDI' + its baseline.
Final Note: I’ve shown you few ways of using this indicator, please backtest before using in real trading. As you know trading is more about risk and trade management than the strategy used. This still a work in progress, I really hope you find value out of it. I use it combination with a tool named “Musashi_Katana” (also found in TradingView).
Best!
Musashi

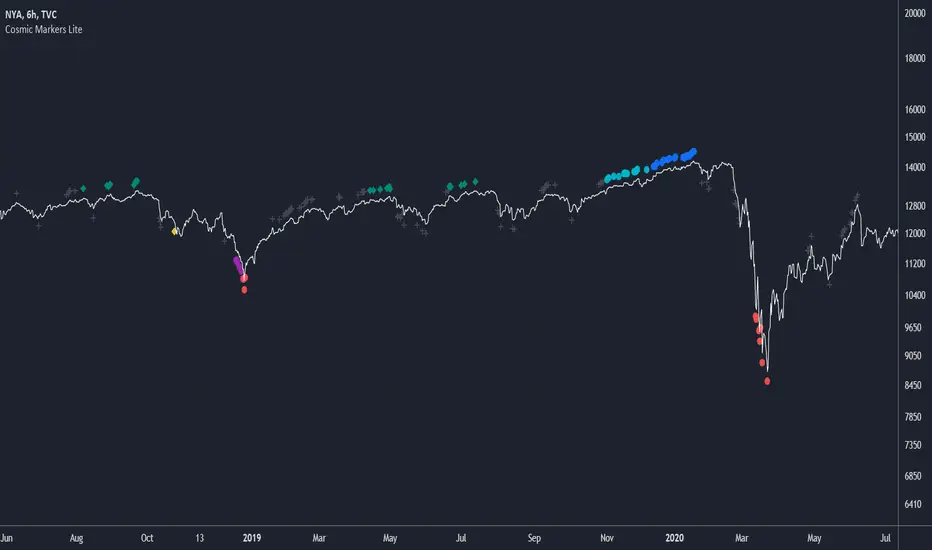
Cosmic Markers LiteThis marker-only indicator traces highest and lowest bars using 5 different periods (the first 3 in aggregation and the rest as is) for a total of 10 support and resistance signals of varying strength. Use Cosmic Markers Lite on its own or add on top of existing chart patterns or other line indicators.
MTF Commodity Oddity Index (CCI+)MTF Commodity Oddity Index (CCI+)
This chart overlay indicator is based upon the Commodity Channel Index (CCI) and can signal multiple triple-timeframe CCI overbought and oversold confluences directly onto your chart, intended for use as a confluence either for reversal trade entries, or potential trade exits, indicating where price may be probable to reverse.
Features include:
- Primary set of fully configurable triple-timeframe overbought and oversold signals, indicating where 3 selected timeframes are all overbought or all oversold at the same time. Enabled by default.
- Secondary set of fully configurable triple-timeframe overbought and oversold signals, indicating where 3 selected timeframes are all overbought or all oversold at the same time. Enabled by default.
- Optional drawing of background colours and/or ribbon seen at bottom of the chart image.
- The default primary MTF #1 timeframes are set to 1 minute, 5 minute and 15 minute. These are highly suitable for low timeframe scalpers trading on < 5m charts, and can often pin point price reversals.
- The default Secondary MTF #2 timeframes are set to 15 minute, 30 minute and 120 minute. These are suitable for both low timeframe scalpers and considerably higher timeframe traders.
- Independent alerts for MTF #1 and MTF #2 triple-timeframe confluences, including options for alerting MTF overbought and MTF oversold individually, as well as an option for alerting either overbought or oversold in a single combined alert.
- Also includes standard configurable CCI options, including CC length and source type.
Note: The features listed above are accurate at the time of publishing but maybe updated or added to in future.
A similar MTF CCI indicator is also available as a panel indicator here .
This indicator is based upon the original MTF Fantastic Stochastic (FS+) available here .
What is the Commodity Channel Index (CCI)?
Investopedia has described the popular oscillator as follows:
“The Commodity Channel Index (CCI) is a momentum-based oscillator used to help determine when an investment vehicle is reaching a condition of being overbought or oversold.
Developed by Donald Lambert, this technical indicator assesses price trend direction and strength, allowing traders to determine if they want to enter or exit a trade, refrain from taking a trade, or add to an existing position. In this way, the indicator can be used to provide trade signals when it acts in a certain way.”
You can read more about the CCI , its use cases and calculations here .
How do traders use overbought and oversold levels in their trading?
The oversold level, that is traditionally when the CCI is above the 100 level is typically interpreted as being 'overbought', and below the -100 level is typically considered 'oversold'. Traders will often use the CCI at an overbought level as a confluence for entry into a short position, and the CCI at an oversold level as a confluence for an entry into a long position. These levels do not mean that price will necessarily reverse at those levels in a reliable way, however. This is why this version of the CCI employs the triple timeframe overbought and oversold confluence, in an attempt to add a more confluence and reliability to this usage of the CCI . While traditionally, the overbought and oversold levels are below -100 for oversold, and above 100 for overbought, the default threshold settings of this indicator have been increased to provide fewer, stronger signals, especially suited to the low timeframes and highly volatile assets.

Q-TrendQ-Trend is an multipurpose indicatorm that can be used for swing- and trend-trading equally on any timeframe (non-volatile markets are better for this thing).
Settings:
Trend period - used to calculate trend line in the special moments(will explain below);
ATR Multiplier - changes sensitivity. The higher the multiplier = the more sensitive it is.
Also option to smooth source data (helps get cleaner signals, as always).
How to use?
Signals are given on the chart. Also ou can use trend line as S/R line.
The idea behind:
Terms:
SRС = Source
TL = trend line;
MP = ATR multiplier;
ATR = ATR :)
TL = (highest of source P-bars back + lowest of source P-bars back) / 2
Epsilon = MP * ATR
I was thinking for a week about combining volatility and relation between highest and lowest price point. That why I called indicator Q-Trend = Quantitative Trend , as I was trying to think about price in a mathematical way.
Okay, time to go philosophical:
1) TL is shows good price trend, but as it is slow enough and not enough informative, we need add additional conditions to produce signals.
2) Okay, so what can we add as conditions? We need to take volatility into account, as it is crucial in the moments of market uncertainty. So let's use ATR (Average True Range) somehow. My idea is that if SRC breaks TL + ATR , then it means that there will be upmove and we update our TL . Analogically for SRC breaking TL - ATR (breaks are crosses of TL +- ATR lines) .
Conclusion:
- if SRC breaks TL + ATR , it is a BUY signal and update of trend line;
- if SRC breaks TL - ATR , it is a SELL signal and update of trend line;
I think that such indicator already exisits on TradingView, as I've already saw something similar, but long ago, so please don't report, if such thing already exists.
But if not, then I hope, that you will gain some profits with Q-Trend :)
I will continue my work on this thing, so stay tuned.
Trade with your own risks and have your profits!
Wish you all the best!
- Tarasenko Fyodor

FieryTrading: Buy The Dip - Sell The RipDear Tradingview community,
Today I want to share a very powerful, yet easy to use indicator with you. The indicator will find local tops or bottoms and will help you determine when it's a good time to trade a potential reversal.
How does it work?
The indicator makes use of the RSI to detect extremities and waits until the RSI reverses. Furthermore, a long-term moving average is used to determine whether we're in bullish or bearish market conditions. In bullish conditions the indicator will only go long, in bearish conditions the indicator will only go short.
How do I use it?
Favorite the indicator and apply it to your chart! You can add an alert to the indicator to receive a message once it has detected a good point for a reversal trade.
The indicator can be used on all assets and on all timeframes. Personally, I've found the 1 - 4 hourly timeframes to yield the best results.
Good luck!

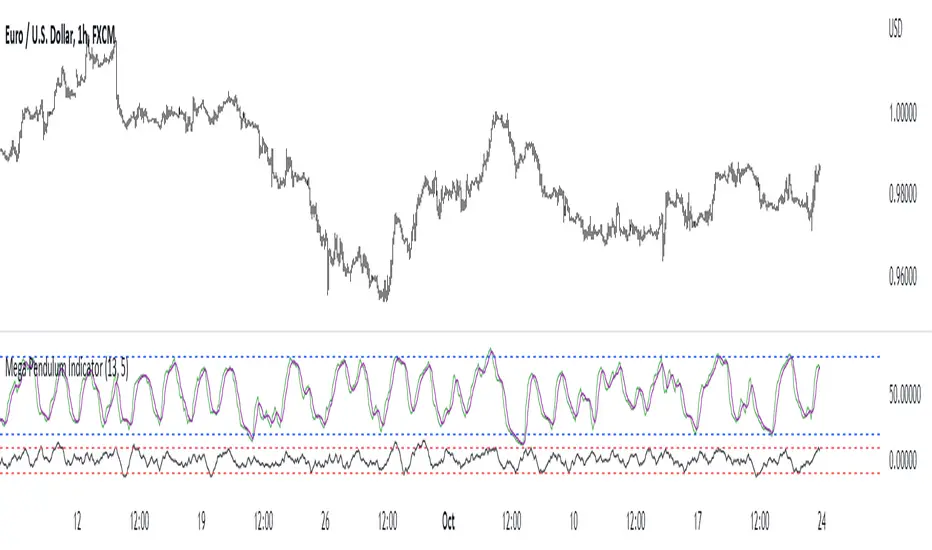
Mega Pendulum IndicatorThe MPI (Mega Pendulum Indicator) is a fusion between the Pendulum Indicator and the Swing Indicator and is used with specific trading rules.
The MPI is a semi-bounded oscillator comprised of two lines. The first bounded line is the Pendulum Indicator which oscillates between 0 and 100 but generally oscillates between 20 and 80. The second semi-bounded line is the Swing Indicator which generally oscillates between -10 and 10.
The conditions for trading the Mega Pendulum Indicator are as follows:
* Buy: Whenever the Pendulum indicator crosses over its signal line (a 5-period moving average) and at the same time, the Swing Indicator must cross over -10 after having been below it.
* Sell: Whenever the Pendulum indicator crosses below its signal line (a 5-period moving average) and at the same time, the Swing Indicator must cross under -10 after having been above it.