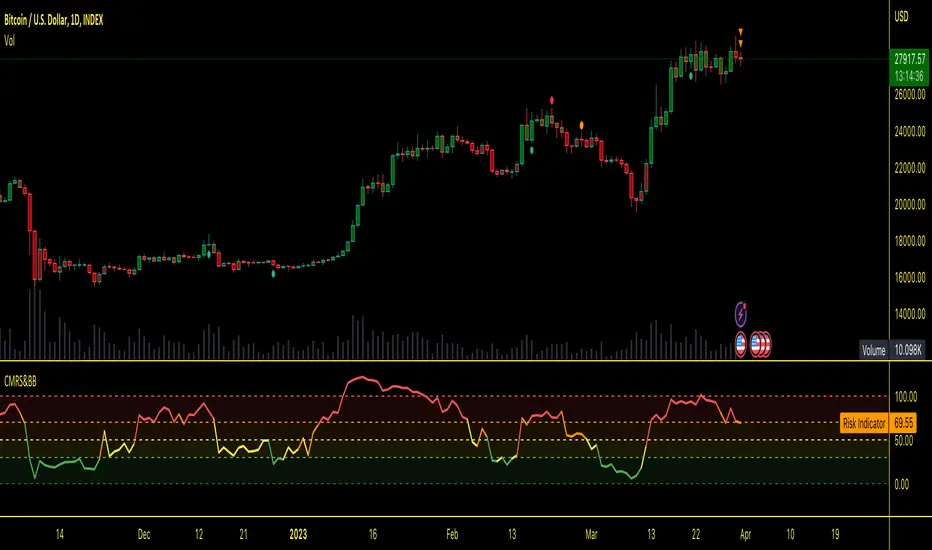
Market RiskThis Pine Script defines an indicator called "Custom Market Risk, Sentiment & Bollinger Bands Indicator" with the short title "CMRS&BB". The indicator calculates risk, sentiment, and Bollinger Bands Percent based on technical indicators and user inputs.
The risk calculation is based on the difference between the current close price and the previous close price, and the average gain and loss over a specified period are calculated. The relative strength index is then calculated by dividing the average gain by the average loss. The risk is calculated using a formula that involves the relative strength index.
The sentiment calculation is based on three technical indicators, and the sentiment score is calculated as the average of the signals generated by these indicators. The sentiment is considered positive if the sentiment score is greater than 0.
The Bollinger Bands Percent is calculated based on the length and multiplier inputs, the moving average, and the standard deviation of the close price. The upper and lower bands are calculated based on the basis and deviation. The Bollinger Bands Percent is then calculated as the ratio of the difference between the close price and the lower band to the difference between the upper and lower bands.
The combined signal is calculated by adding the risk, sentiment score multiplied by a factor, and Bollinger Bands Percent multiplied by a factor. The risk levels are color-coded based on the combined signal, and the corresponding color-coded risk levels are plotted. The horizontal lines and fills representing the risk levels are also plotted. The candle color is set based on the sentiment, where green represents positive sentiment, and red represents negative sentiment.
It is important to note that this script is not intended to provide specific buy or sell signals. However, green color-coded risk levels may indicate a possible buy moment, while red color-coded risk levels may indicate a possible sell moment. It is recommended to perform additional analysis and consider other factors before making any trading decisions.
Risk!!!
Mason’s Line IndicatorThe Macon Strategy is an idea conceived by Didier Darcet , co-founder of Gavekal Intelligence Software. Inspired by the Water Level, an instrument used by masons to check the horizontality or verticality of a wall. This method aims to measure the psychology of financial markets and determine if the market is balanced or tilting towards an unfavorable side, focusing on the behavioral risk of markets rather than economic or political factors.
The strategy examines the satisfaction and frustration of investors based on the distance between the low and high points of the market over a period of one year. Investor satisfaction is influenced by the current price of the index and the path taken to reach that price. The distance to the low point provides satisfaction, while the distance to the high point generates frustration. The balance between the two dictates investors’ desire to hold or sell their positions.
To refine the strategy, it is important to consider the opinion of a group of investors rather than just one individual. The members of a hypothetical investor club invest successively throughout the past year. The overall satisfaction of the market on a given day is a democratic expression of all participants.
If the overall satisfaction is below 50%, investors are frustrated and sell their positions. If it is above, they are satisfied and hold their positions. The position of the group of investors relative to the high and low points represents the position of the air bubble in the water level. Market performance is measured day by day based on participant satisfaction or dissatisfaction.
In conclusion, memory, emotions, and decision-making ability are closely linked, and their interaction influences investment decisions. The Macon Strategy highlights the importance of the behavioral dimension in understanding financial market dynamics. By studying investor behavior through this strategy, it is possible to better anticipate market trends and make more informed investment decisions.
Presentation of the Mason’s Line Indicator:
The main strategy of this indicator is to measure the average satisfaction of investors based on the position of an imaginary air bubble in a tube delimited by the market’s highs and lows over a given period. After calculating the satisfaction level, it is then normalized between 0 and 1, and a moving average can be used to visualize trends.
Key features:
Calculation of highs and lows over a user-defined period.
Determination of the position of the air bubble in the tube based on the closing price.
Calculation of the average satisfaction of investors over a selected period.
Normalization of the average satisfaction between 0 and 1.
Visualization of normalized or non-normalized average satisfaction levels, as well as their corresponding moving averages.
User parameters:
Period for min and max (days) : Sets the period over which highs and lows will be calculated (1 to 365 days).
Period for average satisfaction (days) : Determines the period over which the average satisfaction of investors will be calculated (1 to 365 days).
Period for SMA : Sets the period of the simple moving average used to smooth the data (1 to 1000 days).
Bubble_value : Adjustment of the air bubble value, ranging from 0 to 1, in increments of 0.025.
Normalized average satisfaction : Option to choose whether to display the normalized or non-normalized average satisfaction.
Please note that the Mason’s Line Indicator is not a guarantee of future market performance and should be used in conjunction with proper risk management. Always ensure that you have a thorough understanding of the indicator’s methodology and its limitations before making any investment decisions. Additionally, past performance is not indicative of future results.

Alpha Cloud Algo Risk Reward CalculatorAlpha Cloud Algo Risk Reward Calculation Usage
This indicator helps users manage their positions by allowing them to set customizable take profit and stop loss levels. It helps investors better understand the risk and reward levels of their positions.
Indicator Settings:
Language: Choose the language of the indicator (currently only Turkish is available).
Position Type: Choose either a long or short position option.
Entry Price: Enter the price at which the position will be opened.
Risk Percentage (%): Specify the percentage you are willing to risk in the trade.
Take Profit Type: Choose an option to determine your take profit level as a ratio or price.
Take Profit Value: Enter your take profit level (depending on whether it is a ratio or price type).
Stop Loss Type: Choose an option to determine your stop loss level as a ratio or price.
Stop Loss Value: Enter your stop loss level (depending on whether it is a ratio or price type).
Leverage: Enter the amount of leverage you will use in the trade.
Investment Amount ($): Enter the amount of investment you have allocated for the trade.
Main Capital ($): Enter the amount of your available main capital.
Usage of the Indicator:
After filling in the indicator settings, the take profit and stop loss levels and labels will appear on the chart. The labels also show the amount of risk and reward, in addition to the levels.
The Stop Loss label contains the following information:
Stop Loss level
Total loss amount (in dollars)
Percentage risked (as a percentage of your main capital)
This indicator is designed to speed up the decision-making process and help investors more effectively evaluate potential risks. It allows investors to apply risk management strategies more effectively while trading.
Turkish Language
Alpha Cloud Algo Risk Reward Hesaplama Kullanımı
Bu gösterge, kullanıcıların pozisyonlarını yönetmelerine yardımcı olmak amacıyla özelleştirilebilir kar al ve stop loss seviyeleri belirlemelerini sağlar. Gösterge, yatırımcıların pozisyonlarındaki risk ve ödül seviyelerini daha iyi anlamalarına yardımcı olur.
Göstergenin Ayarları:
Dil: Göstergenin dilini seçin (şu anda sadece Türkçe mevcuttur).
Pozisyon Türü: Uzun (Long) veya kısa (Short) pozisyon seçeneklerinden birini belirleyin.
Giriş Fiyatı: Pozisyonun açılacağı fiyatı girin.
Risk Oranı (%): İşlemde riske atmak istediğiniz yüzdeyi belirleyin.
Kar Al Tipi: Kar al seviyenizi oran veya fiyat olarak belirlemek için seçeneklerden birini seçin.
Kar Al Değeri: Kar al seviyenizi girin (oran veya fiyat türüne bağlı olarak).
Stop Loss Tipi: Stop loss seviyenizi oran veya fiyat olarak belirlemek için seçeneklerden birini seçin.
Stop Loss Değeri: Stop loss seviyenizi girin (oran veya fiyat türüne bağlı olarak).
Kaldıraç: İşlemde kullanacağınız kaldıraç miktarını girin.
Yatırım Miktarı ($): İşlem için ayırdığınız yatırım miktarını girin.
Ana Para ($): Kullanılabilir ana paranızın miktarını girin.
Göstergenin Kullanımı:
Göstergenin ayarlarını doldurduktan sonra, grafik üzerinde belirtilen kar al ve stop loss seviyeleri ile etiketler görünecektir. Etiketler, seviyelerin yanı sıra risk ve ödül miktarlarını da gösterir.
Stop Loss etiketi aşağıdaki bilgileri içerir:
Stop Loss seviyesi
Toplam kayıp miktarı (dolar cinsinden)
Riske atılan yüzde (ana paranızın yüzdesi olarak)
Bu gösterge, yatırımcıların karar verme sürecini hızlandırmalarına ve potansiyel riskleri daha iyi değerlendirmelerine yardımcı olmak için tasarlanmıştır. Yatırımcıların, işlem yaparken risk yönetimi stratejilerini daha etkin bir şekilde uygulamalarına olanak tanır.

Modified Mannarino Market Risk Indicator MMMRI MMRIModified Mannarino Market Risk Indicator MMMRI was developed by "Nobody Special Finance" as an enhancement to the original MMRI developed by Gregory Mannarino. The original and modified version were created as a way to gauge current level of risk in the market. This published indicator includes both versions along with ability to customize the symbols, denominators, and ratio factors that are used within their formulas. Additional options have been included to colorize the candles, plot, and level fills, as well as the option to show or hide a table containing the realtime values for both versions, along with the current dollar strength and 10Y yield.
Levels of market risk are denoted by dashed lines which represent the following levels: 0-50 slight risk, 50-100 low risk, 100-200 moderate risk, 200-300 high risk, 300+ extreme risk. The plot displays whichever of the following two formulas has been selected in the indicator settings, the default choice has been set to MMMRI:
MMRI = (USD Strength * USD Interest Rate) / 1.61
MMMRI = (Debt / GDP) * (USD Strength * USD Interest Rate) / 1.61
NOTICE: This is an example script and not meant to be used as an actual strategy. By using this script or any portion thereof, you acknowledge that you have read and understood that this is for research purposes only and I am not responsible for any financial losses you may incur by using this script!

Short Term Bubble RiskThis risk indicator uses the extension of the closing price to the 20W SMA and displays a color-coded risk oscillator. The higher the oscillator is, the greater the short-term risk and vice-versa. This indicator has historically worked well for estimating the short-term risk of Bitcoin and Ethereum on a weekly timeframe.

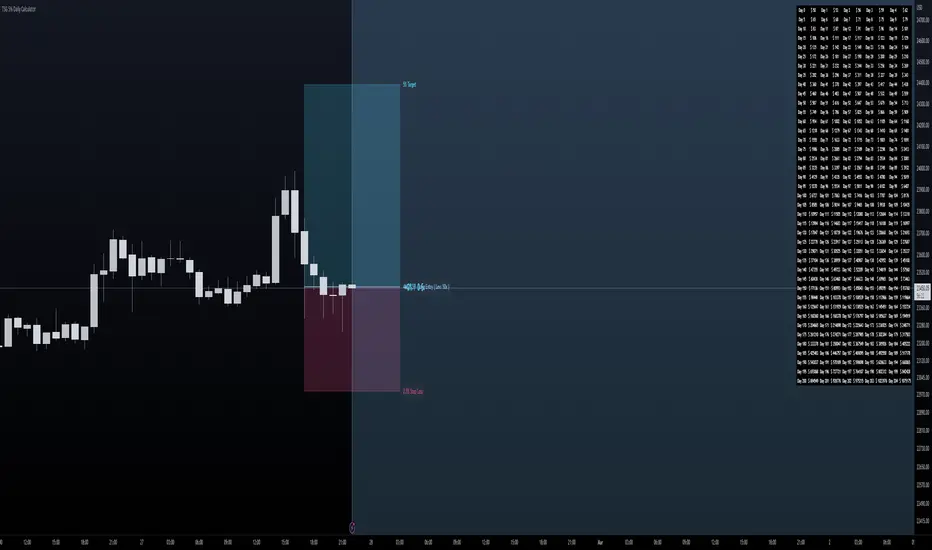
TSG 5% Daily CalculatorThis is a calculator I've created to help visualize Target and Risk Levels based on leverage use to trade crypto.
How to use it ?
Basic Use:
- Set the Direction of your trade - either Long or Short
- Set the Leverage you use in your trade - it is crutial to define the risk and target levels
- Set the Risk Amount you want to risk (in %) of your total balance ( Advised 2-3% )
- Set the Target Amount you want to profit at the target (the idea of this is 5% daily, so 5%).
- Set Entry Price if you have opened a position, and you will visually see your progress. Otherwise the levels will be adjusted to the Close of the candle.
Additions:
- Set your Initial Balance - to help you visualize on the Table your progress
- Set your Current Balance - for visualization purposes on ongoing trades and on the Table
- Entry Date - Advised to set it when you open a trade - you will be tracking the progress of your trade since the candle on which you opened it
- Show Table - to show the table of 5% daily and the target it is set on per day
- Table Size - Set table to be small or normal
- Together with the Table you have a big blue area behind that ends on the day you will become a Millionaire based on the Initial Balance, Current balance and Target % in your inputs
RISK MANAGEMENTHi dear Traders,
Here I would present you my 'Risk Management' tool which is based on your buy orders, trading fees and your desired benefit.
Easily, fulfill the price and volume of each entries. Add to this, you can prepare the info about your next proposed entries, just let them not check at first and by meeting the prices then active the check-box beside it.
Two line will be presented on your candle-plot, one of the indicate the place that without any lose/win you can exit and also the desired exit position by considering user defined benefit.
Use it for free but please do not forget to boost the script.
Best regards and happy trading.
Shakib

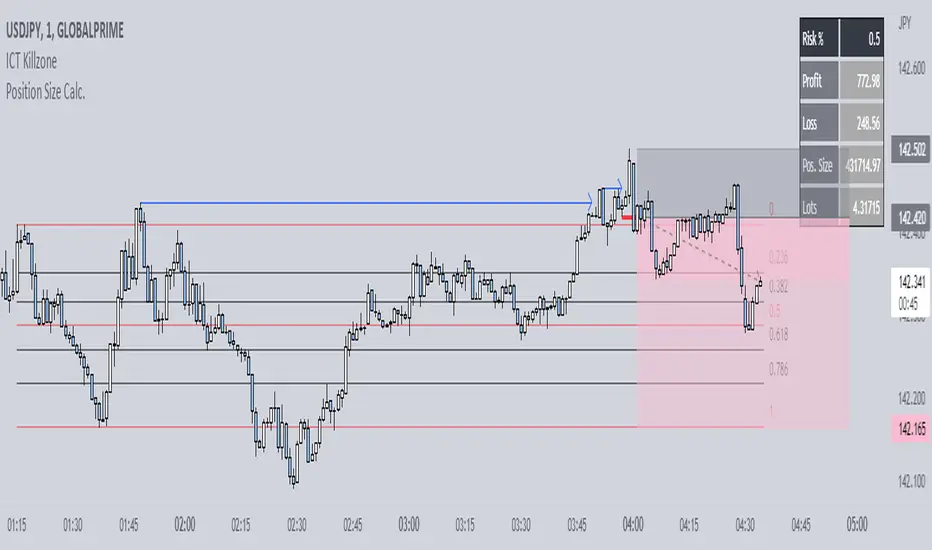
Position Tools [Lot,Profit,Loss,Entry,RR,Balance][Mir Nader]This indicator is the advanced version of the position tool in Trading View. When I opened a trade in Metatrader, I had to switch between the MetaTrader and Trading View programs for the amount of profit or loss, that's why I thought of writing an indicator that shows the exact amount of profit, loss, size and other values of the open trade. It came to my mind.
Also, when you use the reply section for backtesting, this indicator helps you to use all the necessary information in each Trade to accurately calculate Trades.
To enter, it is enough to specify the three entry points, target and stop loss according to the message that is displayed to you, so that all the necessary information will be displayed for you.
Well, let's get to the main explanation about how the indicator works :
The indicator consists of two parts :
1 - the calculation table
2 - trade on the chart
Calculation table
This table shows the exact calculations of your trade live.
As you can see, this table consists of 10 sections, which I will describe each.
1 - Your trade entry point on the chart
2 - Your Stop Loss point along with the loss Pip amount
3 - Your Take Profit point along with the Profit Pip amount
4- The fourth part of the table, which is the most important part in my view, shows your current profit amount according to the risk percentage and your Broker Commission per Lot you have defined for Trade, and according to the balance, risk, Tp and Sl value, just like a Risk Management. It suggests the volume of your input based on the lot.
5 - Show the percentage change of the main market according to your trade live
6 - Display the value of Risk to Reward both according to Target Profit and live
7 - This section and the next section of the table show the amount of profit live according to the amount of the lot determined by you and without the risk of the transaction.
8 - Display the current amount of your balance according to whether the trade is in profit or loss
trade on the chart
The second part of the indicator includes the events that are being displayed on your chart
This section supports three types of display modes for buying or selling trades.
The first condition of your trade is that the price has not yet reached the entry point.
The second state is your trade that has not yet hit your target or stop
And the third state of your trade is that your target or stop has been hit.
Further Details :
I am still working on many conditions to add to the indicator and this will take more time.
For example, showing RR live on the chart after each touch has been added for buying Trade but this part is still problematic for selling Trade In the picture below, you can see that your Trade has already passed 3R profit
I have placed three labels next to each Trade for you so that you can see the values of Tp, Stop and Live without needing a table. These values will soon be visible with more options.
All calculations with precise mathematical formulas for accurate performance have been done by myself.
I will be at your service soon with more updates, I will be happy if you send me your suggestions to improve the indicator.

Basic Position Calculator (BPC)In trading, proper position sizing is essential to managing risk and maximizing returns. The script provided is a Basic Position Calculator that allows traders to quickly and easily calculate their position size, stop loss, take profit, and risk reward ratio for a given trade.
The script starts by defining several inputs for the user to customize the calculations. The first input is the "Account Size", which specifies the total amount of funds available for the trade. The next input is "Risk Amount %", which is the percentage of the account size that the trader is willing to risk per trade. The "Stop Loss" input specifies the maximum amount of loss that the trader is willing to accept, while the "Reward" input is the desired profit target for the trade. Finally, there is a "Position" input that allows the user to specify where on the chart the table of calculations will be displayed.
The script then calculates the position size, stop loss, take profit and risk reward ratio using the user-specified inputs. The position size is calculated by dividing the risk amount by the stop loss. The stop loss is calculated by multiplying the stop loss percentage by the close price, and the take profit is calculated by multiplying the stop loss percentage by the close price and the reward. Risk-reward ratio is the ratio of amount of profit potential to the amount of risk in a trade.
The script then creates a table and displays the calculated values on the chart at the specified location. The table includes the following information: account size, position size, account risk %, stop loss, stop loss %, take profit, take profit % and risk reward ratio. This allows the trader to quickly and easily see all the key calculations for their trade in one place.
Overall, the Basic Position Calculator script is a valuable tool for any trader looking to quickly and easily calculate their position size, stop loss, take profit, and risk reward ratio for a given trade. The ability to customize the inputs and display the calculations on the chart makes it a useful and user-friendly tool for managing risk and maximizing returns.

Super 8 - 30M BTCWelcome to Super 8, the ultimate automatic trading script for Pine!
This bad boy is designed to go both long and short, and it's equipped with all the tools you need to maximize your profits. Whether you're looking to take profit, set a trailing stop, or protect yourself with a stop loss, Super 8 has you covered.
But that's not all! Super 8 is also loaded with 8 powerful indicators to help you make informed decisions. We've got the EMA, ADX, SAR, MACD, VOLUME, BOLLINGER BANDS, DONCHIAN, and ATR all working together to give you the best possible trading experience.
And if you want to take it to the next level, Super 8 also has a feature that lets you use stepped entries in normal mode or incremental 1,2,3,... to improve your average price. Plus, if you're using trailing stop, you can activate the Backtest precision to use lower timeframes.
But what's in a name? Super 8 is called that because it's just that... super! It's tailored specifically for the OKX:BTCUSDT.P pair, so you know you're getting the best possible results. it's highly adjustable and can be used with any other pair. So no matter what market you're trading in, Super 8 has got you covered.
So if you want to level up your trading game, give Super 8 a try. You won't be disappointed.
Certain Risks of Live Algorithmic Trading:
Backtesting Cannot Assure Actual Results.
The relevant market might fail or behave unexpectedly.
Your broker may experience failures in its infrastructure, fail to execute your orders in a correct or timely fashion or reject your orders.
The system you use for generating trading orders, communicating those orders to your broker, and receiving queries and trading results from your broker may fail.
Time lag at various point in live trading might cause unexpected behavior.
The systems of third parties in addition to those of the provider from which we obtain various services, your broker, and the applicable securities market may fail or malfunction.

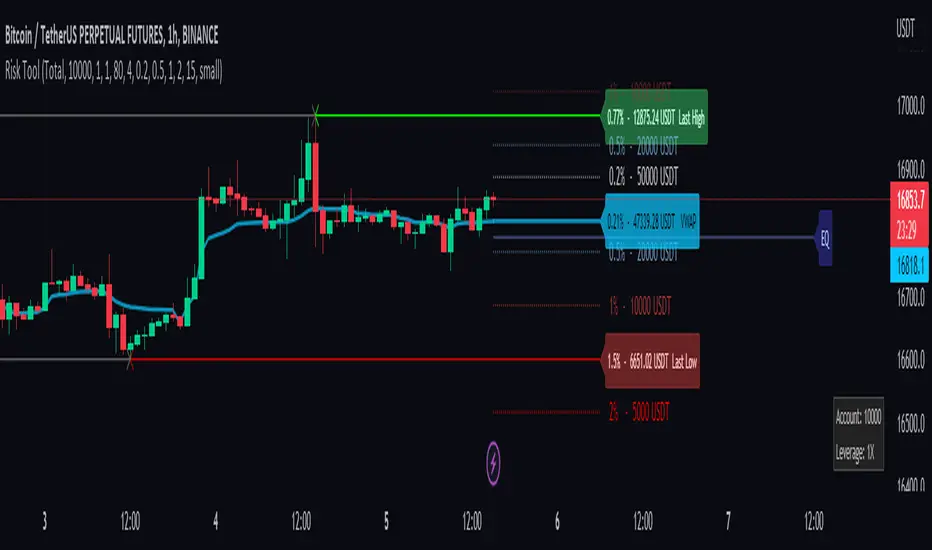
Risk Management ToolThis tool is a good way to get quick position sizing. No need to use your calculator and find that your price asset is already out of your range.
It works best with Cryptocurrencies Exchange way to manage position size calculation.
Really useful when scalping. This tool tracks the last high and low following your custom lookback bars number. It also follows the VWAP level.
You also have 4 custom ranges around the current price with the calculated position size. You set the desired percentage distance from the current price and you get the position size you need.
1. You choose the type of order
2. Account balance
3. Leverage if you use the cost base orders type
4. Amount to risk
and you get real-time risk management.
Position Size ToolUpdated - Version 2
This tool is used to calculate the size of a trade.
Settings - Type in total account size and % of capital that can be risked on each trade.
The table will display:
Column 1 - Stop placement based on low, mid or high value of the current candle.
Column 2 - Percent risk on the trade.
Column 3 - Amount of shares that can be traded (calculated from account size, risk and selected stop placement).
Green color is intended for long position, stop at the low of the candle.
Red color is intended for short position, stop at the high of the candle.
Middle value can shift between either color since its measured from open to close.

FBMAEN:
TradingView indicator for FBMA strategy
People oftem ask: “Dmitry, BABA, TSLA, AAPL flies like a rocket! Well, what are we buying!?” - And I say no, the price does not act like a straight rocket upwards or downwards, instead it breathes, inhales moving away from the moving average and exhales returning to it, so we will wait for the first pullback and buy exactly at the value of the moving average.
Your new paradigm: wait for the stock to pull back to the moving average rather than chasing the price
And one more thing... Remember, you don't want to buy a stock when it's going down, you'll start to have doubts. it's against human nature to go long when the price is falling, but that's why this strategy works so well. We buy on the price rollback (pullback to the moving average), but we DO IT WHILE FOLLOWING THE TREND.
The biggest consequence of this strategy, my author's FBMA strategy and this is a game changer (results are in the comments).
So, let's dive into FBMA indicator settings:
Main settings
ATR Period — Period of intergrated ATR Indicator(shows ATR in a small dashboard);
Settings of Moving Averages
Sign Moving Averages? — shows values of moving averages near their lines on the chart;
Fix MAs' signatures overlapping? — automatically MAs' signatures overlapping (specifically for SMAs and EMAs!) ;
Fix MAs' signatures overlapping between SMAs and EMAs? — automatically group overlapping between EMAs' and SMAs' signatures;
Min distance between MAs' signatures (in % of ATR) — minimal distance between MAs' signatures that indicator will push away MAs' signatures from each other if they are overlapped;
Dashboard
Dashboard position — position of dashboard on the chart ( 9 options ).
Settings of MAs
Source;
Period;
Option for showing EMA and/or SMA of chosen period and source;
Line colour ;
Signature colour .
Addons
Show data by selected timeframe? — shows difference of current price opening and opening a "timeframe" time ago;
Shows MAs only if asset has grown by selected growth % in selected timeframe?
Growth, % — percent, which asset has to gain in order for MAs to be plotted;
Timeframe — frequency with which price's current and previous opening are being will be compared;
Show analog MAs' signatures? — shows MAs' value in a small table;
Show cloud between 1st and 2nd MAs? — shows cloud for both EMAs and SMAs simultaneously).
Price Action
This settings are intuitively understandable
Feel free to leave your questions or suggestions in the comments!
* Price Action-section was taken from ChrisMoody's CM_Price_Action and rebuilt.
RU:
Индикатор TradingView для стратегии ПООС
Мне часто пишут в личку: “Дмитрий, BABA, TSLA , AAPL летит ракетой! Ну что покупаем!?”- А я говорю нет, цена не летит по прямой ракетой вверх, она дышит, делает вдохи отдаляясь от скользящей и выдохи возвращаясь к ней, поэтому мы дождёмся первого пуллбэка и купим точно на значении скользящей
Ваша новая парадигма: ждать акцию на пуллбэке к скользящей по тренду, а не гнаться за ценой
И ещё… Помните, вы не захотите покупать акцию в момент, когда она падает, вы начнете сомневаться т.к. это против человеческой природы заходить в лонг при падении цены, но именно поэтому эта стратегия работает так эффективно, т.к. мы покупаем на откате цены (пуллбэке к скользящей), но ПО ТРЕНДУ
Самое большее следствие из этой стратегии, моя авторская стратегия ПООС и это гейм-чейнджер (результаты в комментариях).
Итак, давайте посмотрим сами настройки индикатора:
Основные настройки
ATR Period — период интегрированного индикатора ATR (показывает ATR на небольшой панели);
Настройки скользящих средних
Sign Moving Averages? — показывает значения скользящих средних рядом с их линиями на графике;
Исправить перекрытие сигнатур МА? — автоматически сигнатуры СС перекрываются (специально для SMA и EMA!) ;
Исправить перекрытие сигнатур МА между SMA и EMA? — автоматически группировать перекрытие между сигнатурами EMA и SMA;
Минимальное расстояние между сигнатурами скользящих средних (в % от ATR) — минимальное расстояние между сигнатурами скользящих средних, при котором индикатор будет отталкивать сигнатуры скользящих средних друг от друга, если они перекрываются;
Панель управления
Dashboard position — положение таблицы на графике ( 9 вариантов ).
Настройки МА
Source;
Период;
Опция отображения EMA и/или SMA выбранного периода и source;
Цвет линии ;
Цвет подписи .
Дополнения
Показать данные по выбранному таймфрейму? — показывает разницу текущей цены открытия и цены открытия в прошлом, по времени равному величины параметра "Таймфрейм";
Показывает MA только в том случае, если актив вырос на выбранный % роста за выбранный период времени?
Прирост, % — процент, на который актив должен набраться, чтобы скользящие средние были построены;
Таймфрейм — частота, с которой будет сравниваться текущее и предыдущее открытие цены;
Показать сигнатуры аналоговых МА? — показывает значение МА в небольшой таблице;
Показать облако между 1-й и 2-й скользящими средними? — показывает облако для EMA и SMA одновременно).
Price Action
Эти настройки будут интуитивно понятны
Оставляете свои вопросы и предложения в комментариях, всё учтём!
* Price Action-section was taken from ChrisMoody's CM_Price_Action and rebuilt.

Turtle Money ManagementThe Turtle Trading approach* is a trend following system that uses volatility for position size. *(Richard Dennis & William Eckhardt )
Turtle traders use the N unit system for risk management, which has its own advantages. This indicator offers beginners a simple interface that uses the same logic. Using ATR (Average True Range) to measure volatility.
The indicator shows the suggested position size and stop-loss price. You need to activate position line to see how it behaved in the past. Information about the Turtle system shows that it works in a daily candle. Intraday candles can be misleading (for ATR) because of this indicator use daily ATR by default. I leave the choice to you.
Limits recommended by Turtle Traders
-
Single Trade % 2 Maximum risk
Single Market % 4 Maximum risk
Closely Correlated Markets % 6 Maximum risk
Loosely Correlated Markets % 10 Maximum risk
Single Direction – Long or Short % 12 Maximum risk

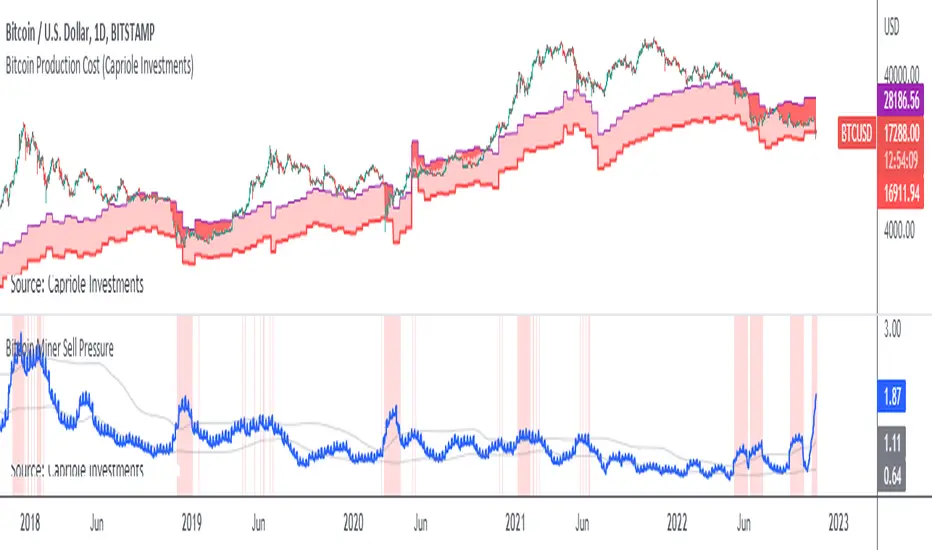
Bitcoin Miner Sell PressureBitcoin miners are in pain and now (November 2022) selling more than they have in almost 5 years!
Introducing: Bitcoin Miner Sell Pressure.
A free, open-source indicator which tracks on-chain data to highlight when Bitcoin miners are selling more of their reserves than usual.
The indicator tracks the ratio of on-chain miner Bitcoin outflows to miner Bitcoin reserves.
- Higher = more selling than usual
- Lower = less selling than usual
- Red = extraordinary sell pressure
Today , it's red.
What can we see now ?
Miners are not great at treasury management. They tend to sell most when they are losing money (like today). But there have been times when they sold well into high profit, such as into the 2017 $20K top and in early 2021 when Bitcoin breached $40K.
Bitcoin Miner Sell Pressure identifies industry stress, excess and miner capitulation.
Unsurprisingly, there is a high correlation with Bitcoin Production Cost; giving strong confluence to both.
In some instances, BMSP spots capitulation before Hash Ribbons. Such as today!
Parametric VaRValue at Risk can also be computed parametrically using a method known as variance/co-variance VaR. This method allows you to simulate a range of possibilities based on historical return distribution properties rather than actual return values. It's actually more accurate even though it assumes a normal distribution especially when not much data is available

Trend & atr day & calcHi!
Why for what and how in this script?
At the time of publication the script consists of three modules, it may increase in the future.
1. Bottom left corner : daytime ATR module
(idea and basis of the author's script - ???)
- The size of the daily ATR based on 14 bars;
- intraday ATR progress;
- colour indication of the progress status, for easier visual perception (green < 70%, yellow 70-90 and red over 90% of ATR)
By evaluating the progress of the daily ATR, it is possible to suggest and expedient to enter/exit/hold a trade.
2. Top right: trend module
The trend is calculated based on Bill Williams' alligator indicator
- trend status on specified timeframes for the current ticker;
- colour indication for visual perception (green - growing trend, yellow - alligator is sleeping, red - downtrend)
Do not forget that the alligator is based on moving averages with the resulting consequences.
Its purpose is to assess the state of the trend on other ticker TFs, without additional actions (switching to another screen or TF)
3. In the bottom left corner - risk and position calculator
(based on an idea of the risk calculator by @andrei.bunulu)
It helps to determine the advisability of entering the trade and also what size position to enter into the trade, within money management strategy chosen.
- The calculator works in two directions: long deal and short deal (short deal calculation is enabled by check-box in settings)
- two calculation methods:
a. based on the set stop loss % (default is 0.3%), in this mode the stop and takeout level is automatically calculated (default is 1 / 3).
b. by entering the desired price levels (entry, stop and take profit points)
To make this work correctly please do not forget to choose the type of calculation (% or price) in the settings, and the currency symbol (for visual representation in the results).
The calculator can take into account the set commissions and spreads.
When hovering over the module - tooltips are displayed.
Each module can be enabled / disabled in the settings.
The size and arrangement of the modules is made for joint use with the script - "Abnormal Bar".
/// а по-русски это так ///
Привет!
Зачем для чего и как в этом скрипте?
На момент публикации скрипт состоит из трех модулей, возможно в будущем увеличится.
1. В левом нижнем углу : модуль дневного ATR
(идея и основа скрипт автора - ???)
- размер дневной ATR на основании 14 баров;
- прогресс ATR внутри дня;
- цветовая индикация состояния прогресса, для более простого визуального восприятия (зеленый < 70%, желтый 70-90 и красный более 90% ATR)
Оценивая прогресс дневного ATR, можно предположить и целесообразности входа / выхода / удержания из сделки.
2. В правом верхнем углу: модуль тренда
Тренд рассчитывается на основе индикатора - аллигатор Билла Вильямса
- состояние тренда на указанных таймфреймах для текущего тикера;
- цветовая индикация для визуального восприятия (зеленый - растущий тренд, желтый - аллигатор спит, красный - нисходящий тренд)
Не забываем, что аллигатор построен на основе скользящих средних с вытекающими последствиями.
Назначение - оценить состояние тренда на других ТФ тикера, без дополнительных действий (переключения на другой экран или ТФ)
3. В нижнем левом углу - калькулятор рисков и позиции
(на основе идеи калькулятора аuthor: @andrei.bunulu)
Помогает определить целесообразность входа в сделку, а также каким размером позиции входить в сделку, в рамках выбранной стратегии мани менеджмента.
- калькулятор работает в два направления: длинная и короткая сделка (расчет по короткой включается в настройках чек-боксом)
- два варианта расчета:
а. на основании установленного % стоп лосса (по-умолчанию 0,3%), при этом режиме происходит автоматический расчет уровня стопа и тейка (по умолчанию 1 / 3).
b. путем ввода данных желаемых уровней цены (точки входа, стопа и тейк профита)
Для корректной работы не забываем в настройках выбирать тип расчета (% или цена), а также символ валюты (для визуального отображения в итогах).
Калькулятор может учитывать установленный размер комиссий и спреда.
При наведении на модуль - отображаются подсказки.
Каждый модуль можно включить / выключить в настройках.
Размер и расположение модулей сделано для совместного использования со скриптом - "Abnormal Bar"

Profit Bands [Loxx]Profit Bands is a supplementary indicator to be used with Loxx's backtests and combination indicators that use volatility-based take profits and stop loss. This indicator includes two types of volatility: Average True Range and True Range Double. Additional volatility sources will be added in the future. The lines painted on the screen are multiples of ATR for Take Profits and Stoploss for Long/Short positions that you can change in the settings. 3 Take Profits and 1 Stoploss is supported. You can turn on/off each UI element. Position size is determined by calculating the size of an investment where you'd lose only X% of your balance if the Stoploss is hit. You can enter your total balance available to trade and the desired % risk you'd be willing to lose at SL. Typically this number is 1-2% of total balance per trade.
Always remember to wait for bar close on a signal to and then peg this indicator to 1 bar backward to fix the price levels the then seed the exact levels you'll use for Take Profits and Stoploss. This indicator will match exactly the levels in other indicators in Loxx's scripts such as Kaleidoscope. You would overlay this script over any other script that uses volatility stops to see where to place your TPs and SL

BETABETA (β) value is a risk index, which is used to measure the price fluctuations of individual stocks or mutual funds relative to the entire stock market.
The higher the β value, the greater the volatility of the stock phase on the performance evaluation benchmark, and vice versa.
When β = 1, it means that the income and risks of the stock are consistent with the income and risks of the broader market; when β> 1, it means that the stock income and risk are greater than the income and risk of the broader market index.
Our Beta calculation method is the same as finance.yahoo.com, markets.ft.com, zacks.com and cnbc.com .
Default Beta setting is data over a 5 Years (Monthly) period and base value of 1.0 is S&P 500 Index.

VIX - SKEW DivergenceThe CBOE VIX is a well-known index representing market expectations for volatility over the next 30 days.
The CBOE SKEW is an index reflecting the perceived tail risk over the next 30 days.
When the SKEW rises over a certain level (~140/150), that means investors are hedging their exposure with options, because they are worried about an incoming market crash or a "black swan". If that happens when the VIX is very low and apparently there is no uncertainty, this can warn of a sudden change in direction of the market. You will see for yourself that an increasing divergence often anticipates a sharp fall of leading stock indexes, usually within two to four months.
This is probably not very relevant for the short-term trader but mid/long-term traders and market analysts may find it useful to clearly visualize the extent of the distance between the VIX and the SKEW. For that reason, I wrote this highly customizable script with which you can plot the two indexes and fill the space within them with a color gradient to highlight the maximum and minimum divergence. Additionally, you can fill the beneath VIX area with four different colors. It is also possible to plot the divergence value itself, so if you want you can draw trendlines and support/resistance levels on it.
Please note that the divergence per se doesn't predict anything and it's meant to be used synergistically with other technical analysis tools.
More informations here:
www.cboe.com
www.cboe.com

Value At Risk Channel [AstrideUnicorn]The Value at Risk Channel (VaR Channel) is a trading indicator designed to help traders control the level of risk exposure in their positions. The user can select a time period and a probability value, and the indicator will plot the upper and lower limits that the price can reach during the selected time period with the given probability.
CONCEPTS
The indicator is based on the Value at Risk (VaR) calculation. VaR is an important metric in risk management that quantifies the degree of potential financial loss within a position, portfolio or company over a specific period of time. It is widely used by financial institutions like banks and investment companies to forecast the extent and likelihood of potential losses in their portfolios.
We use the so-called “historical method” to compute VaR. The algorithm looks at the history of past returns and creates a histogram that represents the statistical distribution of past returns. Assuming that the returns follow a normal distribution, one can assign a probability to each value of return. The probability of a specific return value is determined by the distribution percentile to which it belongs.
HOW TO USE
Let’s assume you want to plot the upper and lower limits that price will reach within 4 hours with 5% probability. To do this, go to the indicator Settings tab and set the Timeframe parameter to "4 hours'' and the Probability parameter to 5.0.
You can use the indicator to set your Stop-Loss at the price level where it will trigger with low probability. And what's more, you can measure and control the probability of triggering.
You can also see how likely it is that the price will reach your Take-Profit within a specific period of time. For example, you expect your target level to be reached within a week. To determine this probability, set the Timeframe parameter to "1 week" and adjust the Probability parameter so that the upper or lower limit of your VaR channel is close to your Take-Profit level. The resulting Probability parameter value will show the probability of reaching your target in the expected time.
The indicator can be a useful tool for measuring and managing risk, as well as for developing and fine-tuning trading strategies. If you find other uses for the indicator, feel free to share them in the comments!
SETTINGS
Timeframe - sets the time period, during which the price can reach the upper or lower bound of the VaR channel with the probability, set by the Probability parameter.
Probability - specifies the probability with which the price can reach the upper or lower bound of the VaR channel during the time period specified by the Timeframe parameter.
Window - specifies the length of history (number of historical bars) used for VaR calculation.

Position Size Calc. (Minimalist)This is a simplified position size calculator in the form of a table.
The reason I published this script is because all other position size calculator scripts try to provide way too much when it should be much simpler, position in strange areas of the chart and leave unwanted chart pollution.
This is a bare-bones functional table that takes your risk level, entry, stop and take profit as inputs, and calculates your loss, profit and required position size for your chosen risk level as a result.
Inspired by a table type position size calculator made by DojiEmoji design/color-wise. Functionally different however.
I hope you find this script useful and include it on your trading journey.
Eurobond CurveABOUT
Dynamically plots 3 no. forward EUROBOND curves. When the curves converge (or worse crossover) there is higher risk of financial uncertainty and potential market correction.
The Eurobond Curves work in a similar way to treasury "yield curve inversion"; except the EUROBOND curves can signal much earlier than Treasuries therefore providing a leading indicator.
The indicator looks the the "near" (next year EUROBOND), "mid" (EUROBOND 2 years out) and "far" (EUROBOND 5 years out) to assess for crossovers.
When the "near" and "mid" curves crossover the "far" curve, concerning economic conditions are developing and it may be a good idea to reduce risk exposure to markets.
LIMITATIONS
The EUROBOND curve crossover events are rare, and this indicator uses data back to 2005 (using approximately 25 TradingView security functions). Given there are relatively few crossover events, the reliability of this indicator should be considered low. Nonetheless, there is decent alignment with treasury yield curve inversions in the 20 year period assessed. Given treasury yield curve inversions have predicted every recession for the last 70 years, we still think the EUROBOND Curves are a useful datapoint to monitor into the future and provide confluence to other risk management strategies.
