Position size FX and CryptoThis indicator I am using to calculate the position size to order for Forex and Crypto Future
Risk!!!

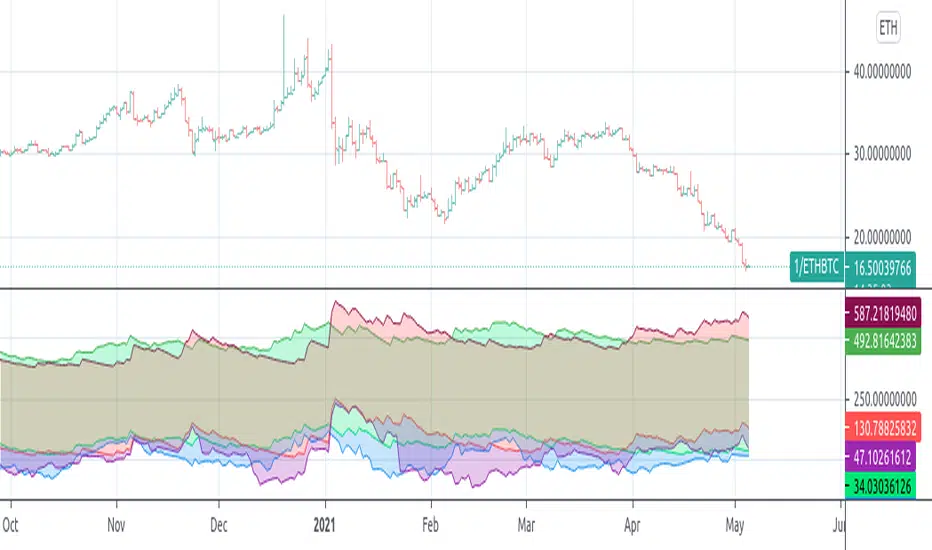
Risk adjusted returns data (volatility optimised)RAR - risk adjusted returns. This methodology could be helpful in portfolio creation and position size risk management. We can set our own preference of risk tolerance via the X variable which is the exponent of volatility in our calculations. This gives an unlimited set of example portfolios on a given time-frame that can be sorted from return oriented to volatility reduction oriented as X increases. RARs are to be compared against eachother.

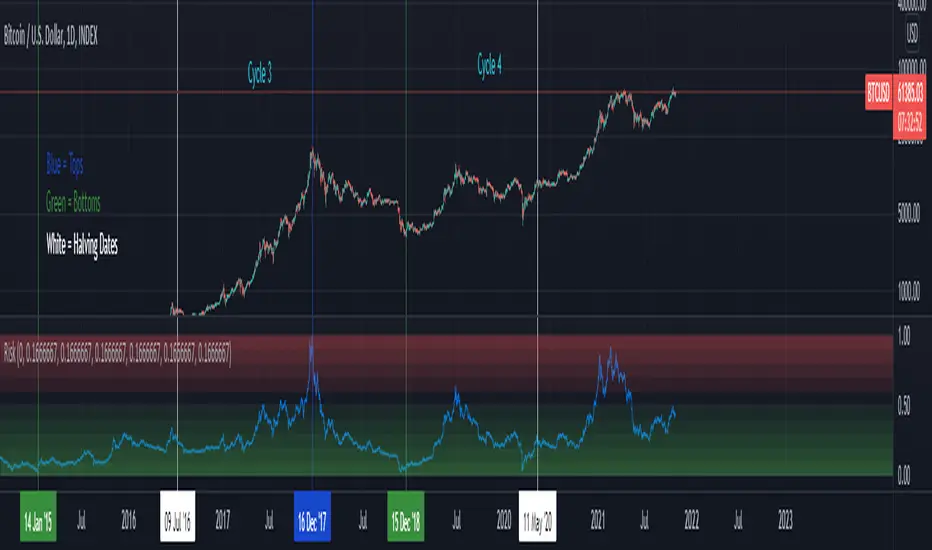
BTCUSD Risk Oscillator- To be used with the BTCUSD All Time History Index (on the daily)
- Estimates the current risk of BTCUSD
- The risk model oscillates between 0 and 1 (0 is the lowest risk, 1 is the highest)
- Historically, buying when the risk is low and selling when the risk is high yields good ROI
- User inputs generally do not need to be changed, they are used to create integers for the normalization process
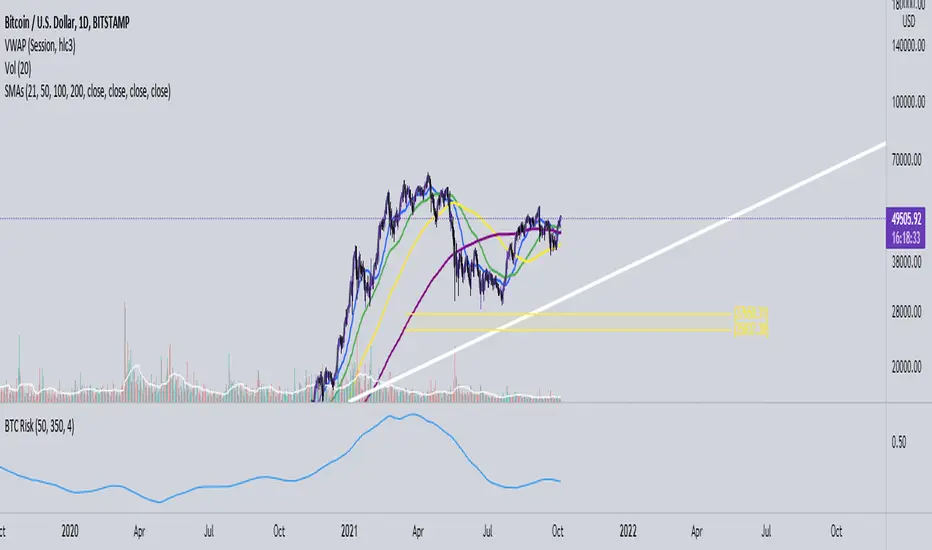
cowen risk indexThis is my attempt at remaking the cowen risk index. It's definitely not correct, but should give a rough estimate of where his indicator is at. I am taking the price divided by the 400sma to get an oscillator, then we need to account for diminishing returns so I just made an exponentially increasing variable and mutliplying that by the oscillator value. Then I normalized the data as best as I could. Not sure exactly how to do that so if anyone has any suggestions, please let me know.
This only works on the daily and weekly timeframe. You will need to edit the code if you want to have it work for other timeframes.

Bjorgum AutoTrailOne Time Trade Risk Management
Incorporating the new interactive feature, this script is meant as a one time trailing stop for the active trader to manage positional risk of an ongoing trade. As a crypto trader or Fx trader, many may find themselves in a position late into the evening, or perhaps daily life is calling while a trade progresses in their favor. Adding a trailing stop to a position thats trending can help to keep you in the trade and lock in gains if things turn around when you are unable to react.
To use the trail, the user would add the script to the chart. Once added, a set of crosshairs will appear allowing the user to choose a point to begin. Often choosing to start a trail from a swing high/ low can be an ideal option. This tends to provide some protection for a stop by placing it under support for a long trade or above resistance for a short trade.
Price based trail
The trail will automatically plot and the offset is a factor of the distance from price action selected by the crosshairs. If placed above price action the script will plot a short trail, if placed below it will trail for a long position.
Additionally, there are several other trail types other than price based. There is also percent based, which offsets the trail as a percent from close. A hard stop is placed at the cross hair value, then once the distance is exceeded by the percentage specified, the trail begins.
There are 2 more volatility based trails. There is a PSAR trail which can provide quicker and tighter stops that accelerate with the trend locking in gains faster, and an ATR trail that keeps a distance from price action as a function of volatility. Volatility levels can be adjusted from the menu.
Volatility based trail (ATR)
Volatility based trail (PSAR)
Lastly, within the code for more the more technical savvy, is some starting setups for string alerts to be sent to exchanges via 3rd party or custom API applications. Some string manipulation is required for specific providers to meet their requirements, but there is some building block alerts that will take the ticker symbol, recognize the asset your trading (Fx, Crypto, etc) and take input quantity or exchange names from the settings via inputs.
Complex strings can be built to perform almost any trade related task when to comes to alerts via web hook. A little setup this way with some technology to back your system can mean a semi-automated half man, half machine setup that actually manages your trail stop while you cannot. For those that don’t go this far, there is some basic alert functionality that well trigger when a trail is hit so you can react and make a decision.
Please note that for now, interactive mode is engaged only when the script is added to the chart. Additional stops, or for adjustments to be made it is best to add a new version. Also as real trades could be at play managing an actual position, alerts are designed to go off only once to ensure no duplicate orders are sent meaning alerts are not reoccurring. Once an alert is triggered, a new trail is to be set up.
A modified version of the TradingView built in SAR equation was used in this script. To provide the value of the SAR on the stop candle, it was necessary to alter the equation to extract this value as the regular SAR “flips” at this point. Thank you to TradingView for supplying access to the built in formula so that this SAR could behave the same as the built-in function outside of these alterations
Example of SAR value maintained in trigger candle
Cheers and happy trading.

Bitcoin Risk Indicator (Daily)This indicator calculates the risk of buying and selling BTC, if the risk is reaching the upper boundaries of 0.8 to 1 then BTC is either getting close to a market cycle top or is far over extended.
If BTC is below 0.4 then this inidicates the least amount of Risk to buy BTC.
Mavara Market Mood"Mavara Market Mood" is a fundamental-based Indicator that shows the overall mood of the financial markets.
When people are willing to buy USD as a reserve currency against other instruments and feel uncertain and don't want to risk their trades, the Market Mood is Risk-OFF.
Conversely, When the traders are optimistic about the economic situation and are willing to sell USD against other instruments, the Market Mood is Risk-ON.
While DXY is trending up and US500 is trending down, the indicator shows a risk-OFF mood with red and refers to the traders' eagerness to make riskier trades.
While DXY is trending down and US500 is trending up, the indicator shows a risk-ON mood with green and refers to the traders' reluctance to make riskier trades.
When you find the histogram below zero, the market is on a high-risk-Off mode. Conversely, When you find the histogram above zero, the market is in a high-risk-ON mood.
In summary, you can buy USDCAD in a risk-OFF mood and sell it in the risk-on mood.

Risk Management Tool [LuxAlgo]Good money management is one of the fundamental pillars of successful trading. With this indicator, we propose a simple way to manage trading positions. This tool shows Profit & Loss (P&L), suggests position size given a certain risk, sets stop losses and take profit levels using fixed price value/percentage/ATR/Range, and can also determine entries from crosses with technical indicators which is particularly handy if you don't want to set an entry manually.
1. Settings
Position Type: Determines if the position should be a "Long" or "Short".
Account Size: Determines the total capital of the trading account.
Risk: The maximum risk amount for a trade. Can be set as a percentage of the account size or as a fixed amount.
Entry Price: Determines the entry price of the position.
Entry From Cross: When enabled, allows to set the entry price where a cross with an external source was produced.
1.1 Stop Loss/Take Profit
Take Profit: Determines the take profit level, which can be determined by a value or percentage.
Stop Loss: Determines the stop loss level, which can be determined by a value or percentage.
2. Usage
One of the main usages of position management tools is to determine the position size to allocate given a specific risk amount and stop-loss. 2% of your capital is often recommended as a risk amount.
Our tool allows setting stop losses and take profits with different methods.
The ATR method sets the stop loss/take profit one ATR away from the entry price, with the ATR period being determined in the drop-down menu next to the selected methods. The range method works similarly but instead of using the ATR, we use a rolling range with a period determined in the drop-down menu next to the selected methods as well.
Unlike the available position management tool on TradingView, the entry can be determined from a cross between the price an an external source. The image above shows entries from the Volatility Stop indicator. This is particularly useful if you set positions based on trailing stops.

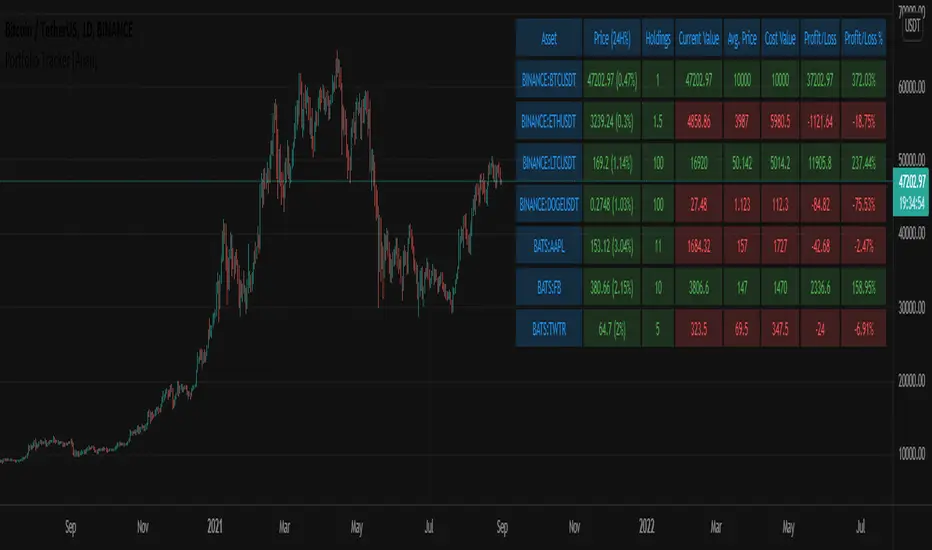
Portfolio Tracker [Anan]█ OVERVIEW
A simple Portfolio Tracker to track your Profit/Loss for any ticker in any market (stock, futures, index, forex, crypto, fund, dr.).
You just need to input (Asset / Quantity / Avg. Buy/Sell Price) and the script will calculate everything.
Also, you can use it for paper trading, or even what-if cases..
█ FEATURES
- Up to 10 positions
- Track your position real-time price and 24H change %
- Calculate your position current value
- Calculate your position cost value
- Calculate Profit/Loss
- Calculate Profit/Loss %
- Change every color in the table as you like.
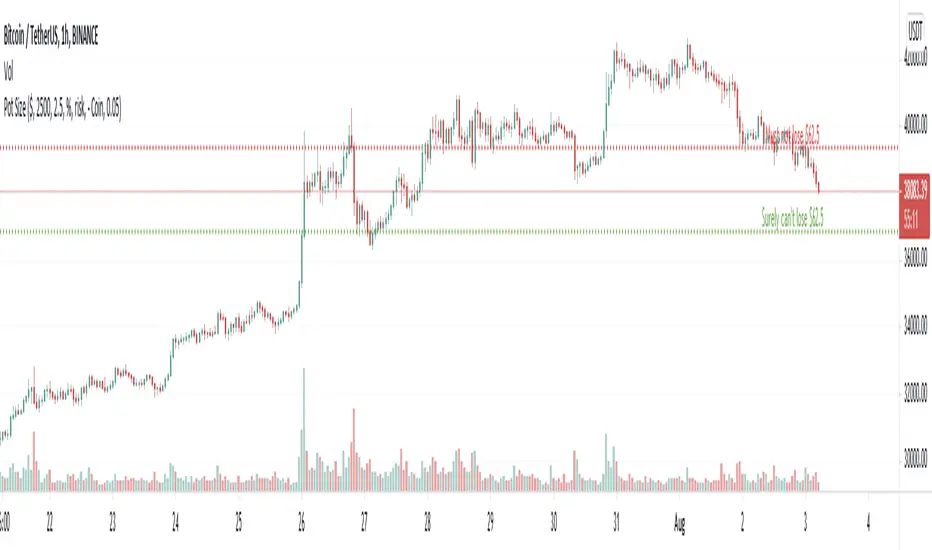
Pot SizeA little FREE script - which may help people set their trade size and stop levels for bitcoin trades.
NOTE :- This script conveys information that requires "indicator arguments" to be turned on.
TO USE :- To adjust to your requirements, click the cog wheel next to the indicator, and adjust "POT SIZE" (how much dollar you have), "RISK %" (the percentage of your dollar portfolio you would like to risk on this trade) and "BITCOIN AMOUNT" - until the short and long 'stop' lines are in the right place in your estimation, for a stop loss that represents the risk you want in relation to the current price for this trade.
The script takes its reference from the closing price; and doesn't include calculations for spread, fees, true range, and volatility etc. That is left open for anyone to add that if they wish. Anyone using this has to make their own adjustments for such considerations not being in this script and therefore make their own compensations.
Anyone wanting to change anything (because values don't go far enough for you) but doesn't know pinescript, can change the numbers next to "defval", "minval", "maxval", and "step" to their suiting in the script itself.
If you use this, you have to work out for yourself if it is useful for you or not. If you depend on it, you must have your own confidence that the calculations in it are acceptable and correct for your use, and you should check yourself and seek advice before trusting it. I convey no confidence in these calculations or this script, and they must be assumed to be acceptable by you if you use it.
Thanks
M
money managementthis indicator has been designed to make your calculations easier and faster.
you can use this indicator to set tp and sl prices based on your entry price, balance,risk and leverage.
it has been designed only for cryptocurrency market and it is not recommended to use it in other markets!
1- enter your balance in the setting of the indicator.
2- enter risk percentage of your balance.
3- enter your sl percentage.
4- enter your tp percentage.
5- set your leverage if you are trading in futures market.
6- and at last set your entry price.
your position size both in spot market and futures market and the exact price of tp and sl , will be shown top right of the screen.
caution: before using this indicator in real market, please make sure that you understand this indicator's behavior and test it.
--------------------------------------------------------------------
این اندیکاتور برای تسریع محاسبات مدیریت سرمایه و سهولت رعایت آن طراحی شده است.
شما میتوانید با وارد کردن پارامترهاقیمت ورودی، سرمایه کل، ریسک و اهرم، قیمت حد سود و ضرر خود را محاسبه کنید.
همچنین اندازه حجم معاملات شما توسط این اندیکاتور محاسبه خواهد شد.
این اندیکاتور برای بازار کریپتوکارنسی طراحی شده است و استفاده از آن در سایر بازارها پیشنهاد نمیشود.
از بخش تنظیمات اندیکاتورمراحل زیر را انجام دهید:
1- میزان سرمایه خود را در قسمت بالانس وارد کنید
2- میزان ریسک سرمایه در هر معامله را مشخص کنید (به درصد)
3- میزان حد ضرر خود را مشخص کنید (به درصد)
4- میزان حد سود خود را مشخص کنید (به درصد)
5- عدد اهرم خود را وارد کنید
6- قیمت ورود به معامله را وارد کنید
توجه: قبل از استفاده این اندیکاتور در بازار لایو لطفا آن را تست کنید و از کارکرد صحیح آن با مدیریت سرمایه خود اطمینان حاصل فرمایید.

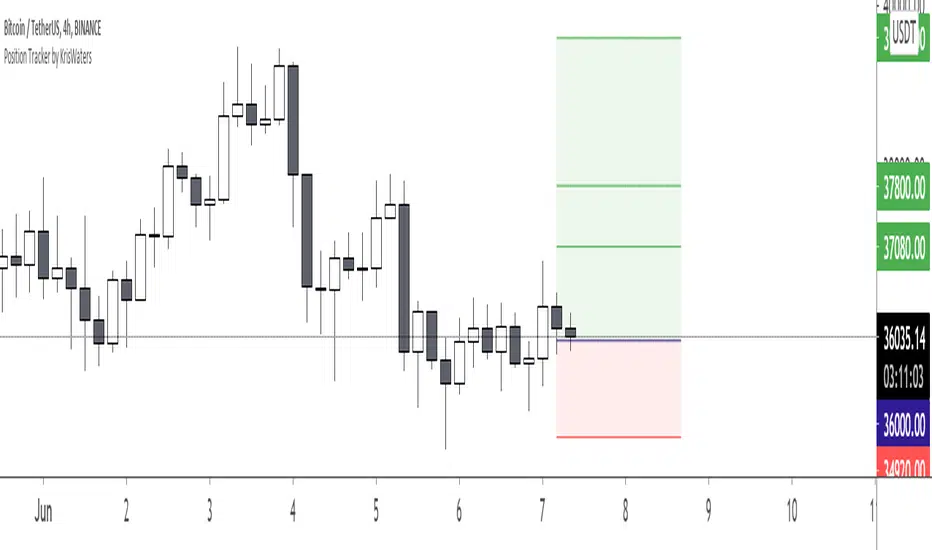
Position Tracker by KrisWatersPosition tracker helps you to know "Stop" and "Take Profit" prices with provided "Entry Price" data. You can use on Long and Short setups.
Position calcCurrent script was created to help faster calculate possible gain or loss from a furure trade. Making money management a bit simpler, by changing values you can adjust proper trade leverage and see possible target values

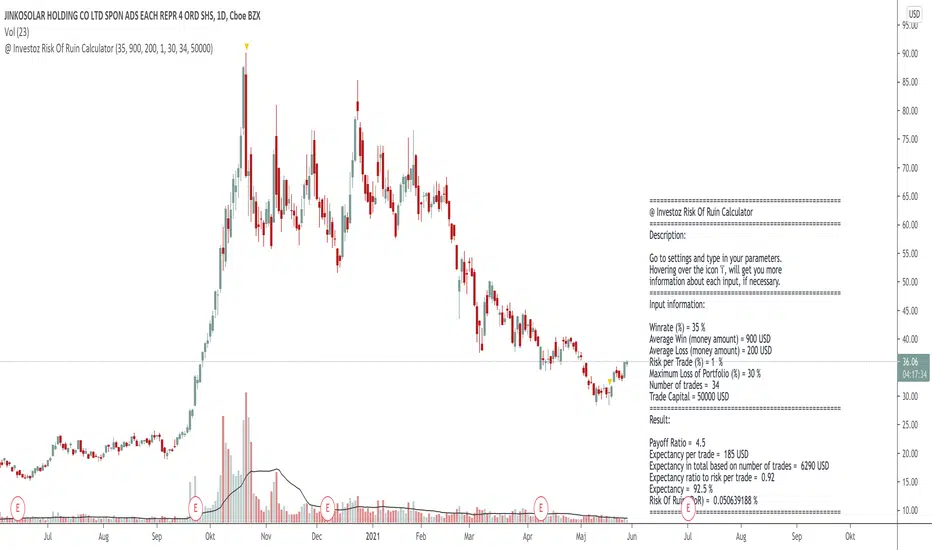
@ Investoz Risk Of Ruin CalculatorWhat is risk of ruin?
The risk of ruin is a statistical concept that matches the probability that you reach the point where it is no longer possible to recover the losses or continue. Please note that this is not the total capital in your account, as you should NEVER risk 100% of your capital.
Ideally, you should be prepared to risk 25-30% of your account as a MAXIMUM breakpoint before you need to stop trading. If that maximum is reached, review your trading plan for new goals and risk settings to determine if you can continue trading and then develop a new plan. You should never have a drawdown of 50% or more, because then you have to get 100% return, just for breaking even!
Considering that new traders are highly risk averse and have no idea of how much risk they can afford to take for each trade, they most likely end up blowing up their account. They probably did not wanted to see it as a possibility, just saw the opportunity to earn money.
Therefore, risk management is one of the key points a trader need to know well, to avoid reaching our point of destruction. This is what allows you to survive and stay in the game in order to have a greater chance of making money in the markets. Every trader must therefore calculate their chances of reaching this drawdown level. Simply put, the more you risk per trade, the more you increase the risk of destruction. So the easiest way to avoid the risk of ruin is to risk only a small portion of your account on each trade. Risk should never exceed 1-2% of the account per trade (preferably less) otherwise that path to point of destruction is where you are heading.
It is obviously not possible for a trader to make money without taking some risk, but it is imperative that he / she knows what his / her risk is and that he / she is prepared to take it. If a trader is not willing to take risks on his / her trading account, trading is not for him / her, it's that simple.
How the Risk Of Ruin Calculator works
You need to know a few things before you can use this calculator. You need to manually go to the indicator settings and make a few inputs over following:
(If you use a pine script strategy, you have all the info you need. Go to "Strategy Tester" and then "Performance Summary").
Inputs
Win rate = How profitable your strategy is in % terms.
Average win = Average winning trade, in money terms.
Average loss = Average losing trade, in money terms.
Risk per trade = How much risk of your portfolio you take at each trade.
Maximum Loss Of Portfolio = What is the total percentage loss of your portfolio that you can afford to risk before you stop trading.
Trade Capital = The total sum of your current trade capital.
Outputs
Payoff ratio = The payoff ratio is simply the system's average profit per trade divided by the average loss per trade.
Expectancy = Is the win rate of the strategy divided by payoff ratio.
Risk of ruin ( RoR ) = Risk of ruin is the probability of a strategy losing money, to the point where it is no longer possible to recover the losses or continue.
=============================================================================================================================================================
DISCLAIMER
Any data and information is provided 'as is' solely for informational purposes, and is not intended for trading purposes or advice. Past performance is not indicative of future results.
Educate yourself on the risks associated with trading, and seek advice from an independent financial or tax advisor if you have any questions.
=============================================================================================================================================================
Heisenberg's Uncertainty BandsHeisenberg's Uncertainty Bands:
This is a volatility indicator to determine and visualize the uncertainty in a securities' price.
In quantum mechanics, the uncertainty principle (also known as Heisenberg's uncertainty principle) is any of a variety of mathematical inequalities asserting a fundamental limit to the accuracy with which the values for certain pairs of physical quantities of a particle, such as position, x, and momentum, p, can be predicted from initial conditions.
It plots a Kalman filter average of the bars inside a higher timeframe bar, to attempt to find the most frequent price in that bar's timespan. To plot what is effectively a MA using POC (IvanLabrie's code, credits to the author).
It derives momentum from relative momentum, yielding results more sensitive to changes.
Then it uses Heisenberg's uncertainty principle to find an uncertainty range, and uses it as the channel distance from the POC MA, meaning price is likely to fluctuate within that range.
Since uncertainty must be greater than h/2, adding fib levels will make it a useful indicator. Essentially they are pseudo-Fibonacci Bollinger Bands, which uses a different calculation.
Benefits:
Prices fluctuate, and it can be helpful to visualize price as a range, rather than a single point or line. This visualization can help in managing risk, determining entries and exits, and prevent losing one's position due to price fluctuations during a trend.
If we use a particle model, the uncertainty principle dictates that it is impossible to predict the price within a range. This is a good model for risk management!
Usage:
There are 5 Fibonacci ratio outer bands that can be turned on or off according to user's preference.
Recommended that the length inputs should be increased in higher timeframes, to visualize trends, shorter timeframes should have lower lengths.
GLHF
- DPT

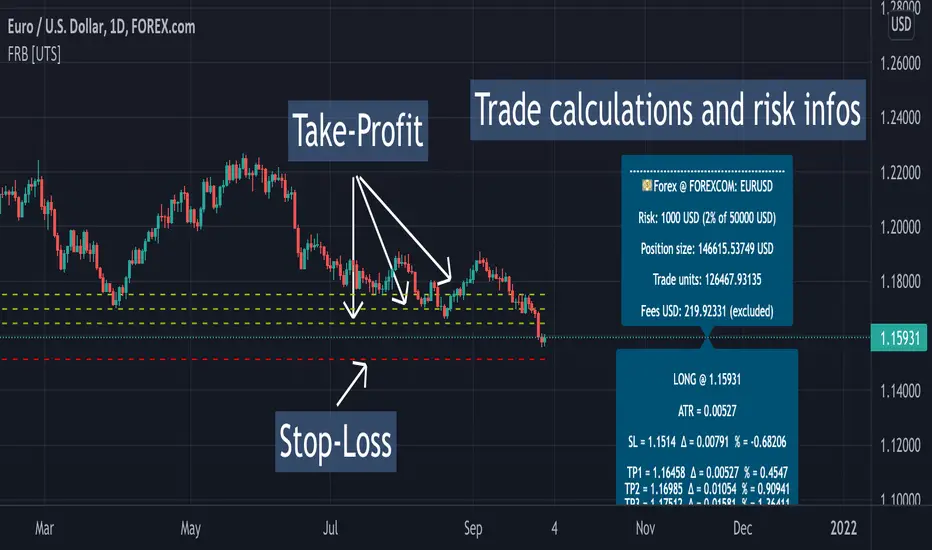
Forex Risk Buddy - Lite: Position Size, SL & TP System [UTS]Forex Risk Buddy - Lite
Position Size, Stop Loss & Take Profit System
The ultimate system to calculate trading risk on forex markets.
The 'Lite' version is limited to the EUR/USD forex trading pair.
💵 Forex
Position Sizing
De-risk possible drawdown by calculating a proper position size.
Define your risk percent based on your net value
Freely define your account currency
Trade any asset by the customizable Base / Quote currency factor
Calculate trading fees
Show all information on a customizable data screen
Stop Loss
Minimize trade risk by calculating your stop-loss.
Percent, Value and Delta display from current price
ATR based (Average True Range, modifiable)
Custom SL value possible
Adjustable
Two visual representations on chart
Automatically and real-time calculated on screen
Take Profit
Multiple take-profit levels to ensure not giving back to the market.
Up to 3 take profit levels to define
ATR based (Average True Range, modifiable)
Custom TP values possible
Easily customizable
Two visual representations on chart
Automatically and real-time calculated on screen
Currencies
Choose an account currency and calculate your risk for every trading pair.
USD
EUR
GBP
AUD
CAD
CHF
HKD
JPY
NOK
NZD
RUB
SEK
SGD
TRY
ZAR
BTC (crypto)
ETH (crypto)
USDT (crypto)
BUSD (crypto)
USDC (crypto)
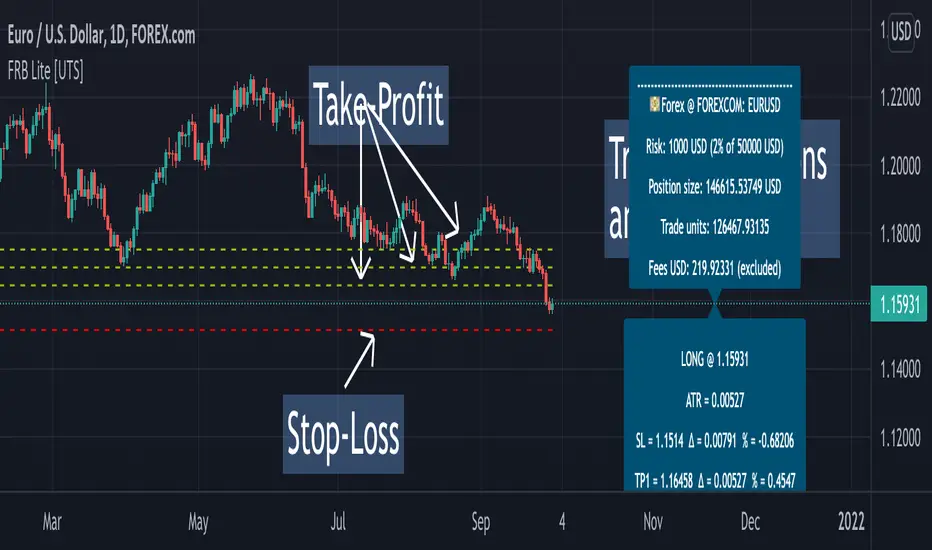
Forex Risk Buddy: Position Size, SL & TP System [UTS]Forex Risk Buddy
Position Size, Stop Loss & Take Profit System
The ultimate system to calculate trading risk on forex markets.
💵 Forex
Position Sizing
De-risk possible drawdown by calculating a proper position size.
Define your risk percent based on your net value
Freely define your account currency
Trade any asset by the customizable Base / Quote currency factor
Calculate trading fees
Show all information on a customizable data screen
Stop Loss
Minimize trade risk by calculating your stop-loss.
Percent, Value and Delta display from current price
ATR based (Average True Range, modifiable)
Custom SL value possible
Adjustable
Two visual representations on chart
Automatically and real-time calculated on screen
Take Profit
Multiple take-profit levels to ensure not giving back to the market.
Up to 3 take profit levels to define
ATR based (Average True Range, modifiable)
Custom TP values possible
Easily customizable
Two visual representations on chart
Automatically and real-time calculated on screen
Currencies
Choose an account currency and calculate your risk for every trading pair.
USD
EUR
GBP
AUD
CAD
CHF
HKD
JPY
NOK
NZD
RUB
SEK
SGD
TRY
ZAR
BTC (crypto)
ETH (crypto)
USDT (crypto)
BUSD (crypto)
USDC (crypto)
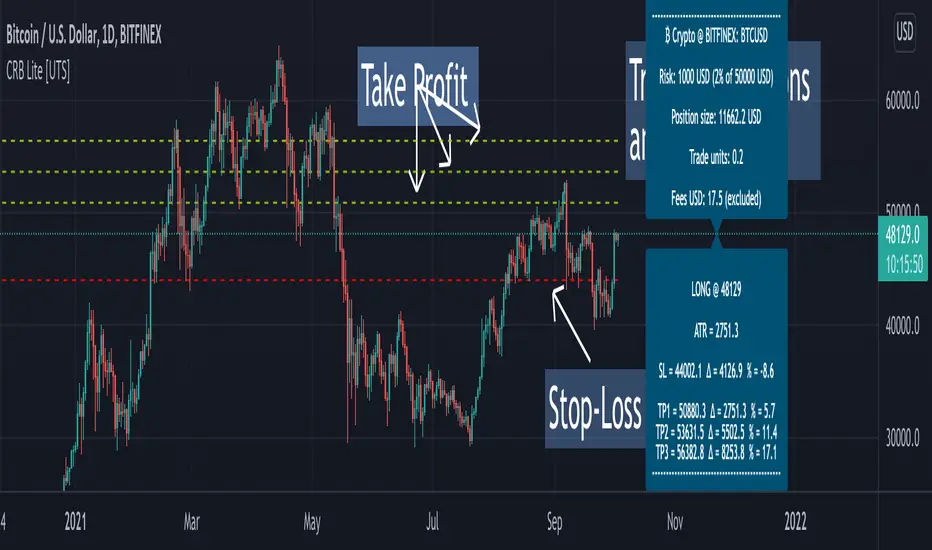
Crypto Risk Buddy - Lite: Position Size, SL & TP System [UTS]
Crypto Risk Buddy - Lite
Position Size, Stop Loss & Take Profit System
The ultimate system to calculate trading risk on crypto assets.
The 'Lite' version is limited to BTC as base currency.
₿ Cyptocurrencies
Position Sizing
De-risk possible drawdown by calculating a proper position size.
Define your risk percent based on your net value
Freely define your account currency
Trade any asset by the customizable Base / Quote currency factor
Calculate trading fees
Show all information on a customizable data screen
Stop Loss
Minimize trade risk by calculating your stop-loss.
Percent, Value and Delta display from current price
ATR based (Average True Range, modifiable)
Custom SL value possible
Adjustable
Two visual representations on chart
Automatically and real-time calculated on screen
Take Profit
Multiple take-profit levels to ensure not giving back to the market.
Up to 3 take profit levels to define
ATR based (Average True Range, modifiable)
Custom TP values possible
Easily customizable
Two visual representations on chart
Automatically and real-time calculated on screen
Currencies
Choose an account currency and calculate your risk for every trading pair.
USD
EUR
GBP
AUD
CAD
CHF
HKD
JPY
NOK
NZD
RUB
SEK
SGD
TRY
ZAR
BTC (crypto)
ETH (crypto)
USDT (crypto)
BUSD (crypto)
USDC (crypto)
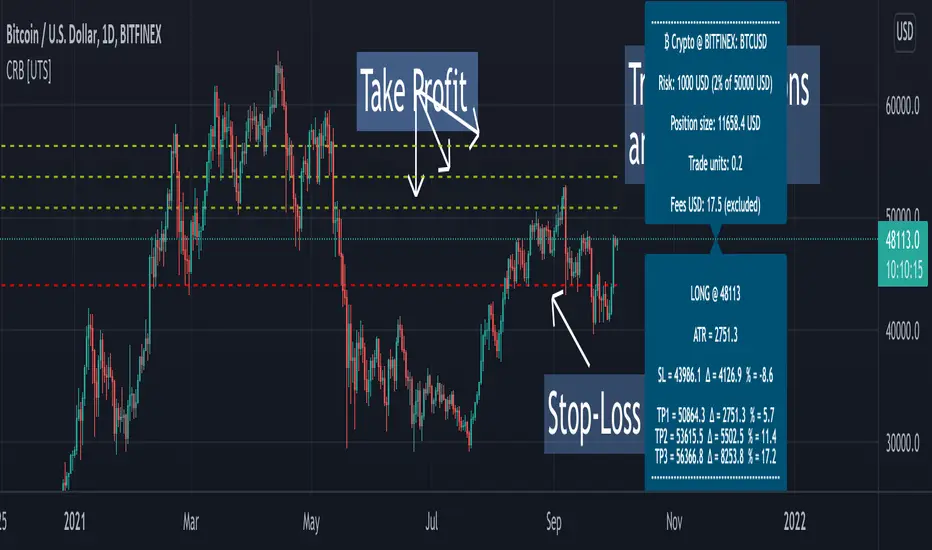
Crypto Risk Buddy: Position Size, SL & TP System [UTS]
Crypto Risk Buddy
Position Size, Stop Loss & Take Profit System
The ultimate system to calculate trading risk on crypto assets.
₿ Cyptocurrencies
Position Sizing
De-risk possible drawdown by calculating a proper position size.
Define your risk percent based on your net value
Freely define your account currency
Trade any asset by the customizable Base / Quote currency factor
Calculate trading fees
Show all information on a customizable data screen
Stop Loss
Minimize trade risk by calculatig your stop-loss.
Percent, Value and Delta display from current price
ATR based (Average True Range, modifiable)
Custom SL value possible
Adjustable
Two visual representations on chart
Automatically and real-time calculated on screen
Take Profit
Multiple take-profit levels to ensure not giving back to the market.
Up to 3 take profit levels to define
ATR based (Average True Range, modifiable)
Custom TP values possible
Easily customizable
Two visual representations on chart
Automatically and real-time calculated on screen
Currencies
Choose an account currency and calculate your risk for every trading pair.
USD
EUR
GBP
AUD
CAD
CHF
HKD
JPY
NOK
NZD
RUB
SEK
SGD
TRY
ZAR
BTC (crypto)
ETH (crypto)
USDT (crypto)
BUSD (crypto)
USDC (crypto)
Risk calculatorBy providing Entry Price (EP), Cut Loss level (CL), Take Profit Level(TP) and Risk (Amount of money willing to lose), this calculator will automatically suggest the capital you should allocate according to risk and amount of unit.

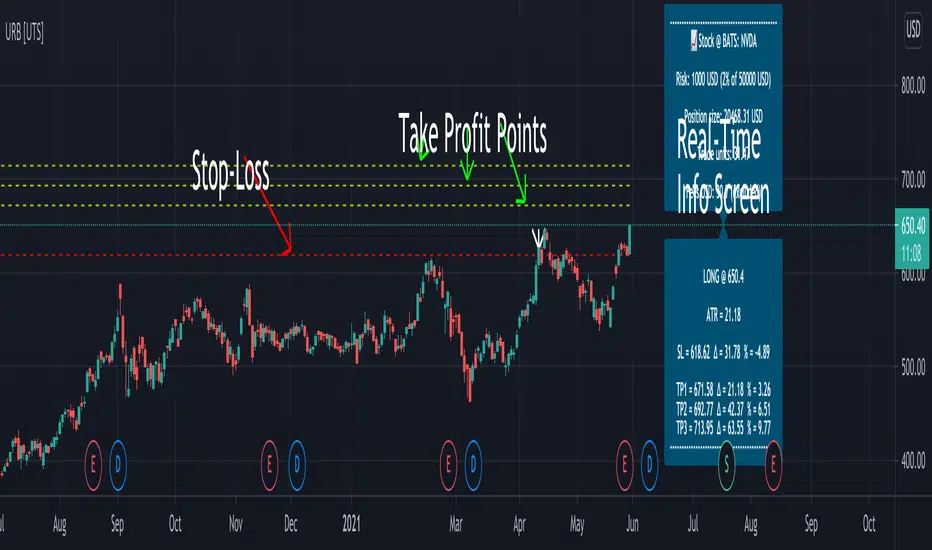
Uber Risk Buddy: Position Size, SL & TP System [UTS]
Uber Risk Buddy
Position Size, Stop Loss & Take Profit System
The ultimate system to calculate trading risk on any asset e.g.:
💰 Futures
₿ Cyptocurrencies
💵 Forex
📈 Stocks
📉 Fund
🗂️ Indices
Position Sizing
De-risk possible drawdown by calculating a proper position size:
Define your risk percent based on your net value
Freely define your account currency (Base currency)
Trade any asset by the customisable Base/ Quote currency factor
Optional trading fee calculation
Show all information on a customisable data screen
Stop Loss
Minimise trade risk by calculating your stop-loss:
Percent, Value and Delta display from current price
ATR based (Average True Range, modifiable)
Adjustable
Two visual representations on chart
Automatically and real-time calculated on screen
Take Profit
Multiple take-profit levels to ensure not giving back to the market.
Up to 3 take profit levels to define
ATR based (Average True Range, modifiable)
Easily customisable
Two visual representations on chart
Automatically and real-time calculated on screen
Indicator Access: 1 week trial available (DM for access)
Annualised Price Volatility %Annualised Price Volatility in percent, also called Instrument Risk, as outlined by Rob Carver in his excellent books, 'Systematic Trading' and 'Leveraged Trading'.
This is written for those who have read one of his books and want to use this tool on TradingView.
Trend strength, oscillators, and volume indicators are all the rage. Finding a great setup is, of course, key. You've decided to go long. Great!
But how much is your capital at risk?
How does that compare with your level of risk tolerance?
When trading, it's key to understand just how risky a certain instrument is. An uptrend is an uptrend, but is it at an annualised volatility of 2% per year or 500% per year? If it's the former, I know I can put a good chunk of capital into trading it. But if its the latter, I don't want to put so much money at risk. Volatility is rarely in a straight line. It's usually up and down.
I won't give the whole game away. To find out more about how to use this concept of risk, I'd highly recommend the books 'Leveraged Trading' and 'Systematic Trading' by Rob Carver.
Do you have any thoughts, ideas, or questions? Let me know in the comments or send me a message! I'd be glad to help you out.
