Position Sizing CalculatorThis is an intuitive risk management tool with a minimalist design.
This calculator will determine your position size per trade, profit, loss, risk/reward ratio and leverage if any.
It will calculate your leverage if you are trading financial instruments e.g. Mini Futures , Turbo Warrants etc. that have a financing level.
Tip: Use this as a complement to the Long/Short Position tool.
Provide the following inputs to get a calculation:
- Position type
- Account balance
- Risk per trade percentage
- Financing level (if any for leveraged instruments), else let it be 0
- Entry price
- Target price
- Stopp loss price
You can also choose the color of the output text, its background and position in the chart window.
Enjoy!
Riskreward

Position Size Calc. (Risk Management Tool)Programmed this tool to help prevent overtrading.
Example of application:
Suppose you want to trade ETHUSDT on a 1 minute chart and you are only willing to risk $10 in one single trade. This way, if you get stopped out, then you will only lose $10. Say you are using ATR based stop loss at 2x current ATR to set the initial stop. All these variables are now fixed, so you must make an adjustment to the size of your position.
Quick illustration: Tolerable loss per trade is $10 , the current ATR of ETHUSDT is $4.06, the size of your stop is $8.12 (4.06*2), then your position size should be 1.2 ETH ($10/$8.12).
This script will constantly monitor the current ATR and display the optimal position size on chart. Tolerable loss (aka "Risk amount") is defined by user in settings. Lines showing the size of SL and TPs on chart are optional, it was added to the script to help users draw the long/short position measuring tools built into TradingView.
Other notes: Always consider market liquidity, size of bid-ask spreads, and the possibilities of gap ups/downs. It can never be guaranteed that stop market/limit orders will get filled at desirable prices. Actual stop losses might differ.

Zeal Trade HelperOnce you have mastered a trading strategy, risk management is the most important aspect of trading that will enable and long and successful trading career. The Zeal Trade Helper is based on Van Tharp's theory of R. It provides an immediate visual trading plan, as well as sizing parameters for trading equity and options (.25 and .50 deltas) based on a number of inputs to help you avoid needing to do quick mental math in the moment of taking a trade.
HOW TO USE
- First, you will need to input your R value. To find your R value, divide your **average green day** by the **average number of trades you take in a day**. Once you have this number, enter it into the "Your R Value" field in the indicator settings.
- The indicator settings then provides you with 5 different setup entries. When you have your watchlist ready for the day, simply go through and choose the specific stock, enter your entry price, stop loss, target, and setup type (build, short, bounce, or reject).
OUTPUTS
**Trading Plan**
The indicator will display a visual trading plan based on the inputs you entered on each individual stock's chart. The trading plan will have a green box and red box to represent your entry, target, and stop loss.
**Risk Parameters**
The indicator will also display text outlining what your risk parameters and sizing should be for the trade based on your R value. You will see 3 different lines: the first line showing the number of shares you can trade, the second line showing the number of option contracts you can trade at .50 delta, and the third line showing the number of option contracts you can trade at .25 delta. For reference, at the money options are .50 deltas. Even if you aren't trading exactly .50 or .25 deltas, these values will still help as a frame of reference in the moment of putting on the trade.
**Note that you can toggle the appearance of either of these outputs by checking/un-checking the boxes next to "Display trading plan" and "Display risk parameters" in the indicator settings.
Examples:
1. "**240 shares with $1.25 risk**" means you can take 240 shares and risk $1.25 on the share's price based on your R value
2. "**4.8 Cons @ .50 delta with $0.62 risk**" means you can take either 4 or 5 at the money option contracts and risk $0.62 **on the option contract's value** based on your R value
3. "**9.8 Cons @ .50 delta with $0.31 risk**" means you can take either 9 or 10 option contracts that have a .25 delta (a bit out of the money) and risk $0.31 **on the option contract's value** based on your R value
Happy Trading!

SignalsThis script allows you to calculate position size, and future profit, loses.
- You can add 3 target values and 1 stop loss
- Optionally you can display table, position it as you like, and see risk ratio
Plans:
- add profit loss to the labels

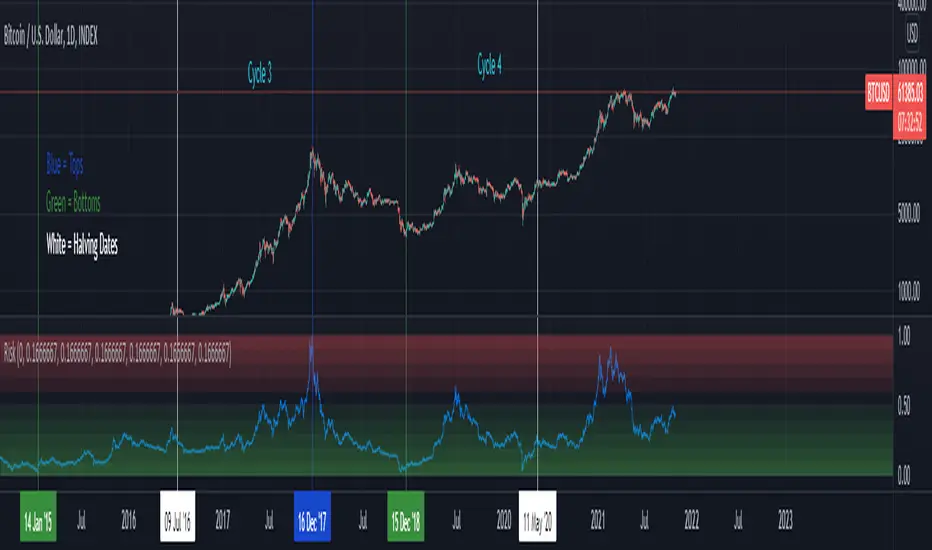
BTC Risk Metric - Estimates the risk of BTC price versus the USD
- To be used on the daily timeframe
- Works best on a BTC pair that has a lot of bars, e.g. The Bitcoin All Time History Index
- 0 is the lowest risk, 1 is the highest risk
- Historically, buying when the risk was low and selling when the risk was high would have yielded good ROI
- The risk bands are 0.1 in width and are highlighted on the plot
Typical Strategy:
- weighted DCA into the market when risk <0.5, do nothing between 0.5-0.6 and weighted DCA out of the market when risk >0.6
- x = buy amount per DCA interval
- y = 1/10th total BTC held by the user
- if 0 ≤ Risk < 0.1 then buy 5x
- if 0.1 ≤ Risk < 0.2 then buy 4x
- if 0.2 ≤ Risk < 0.3 then buy 3x
- if 0.3 ≤ Risk < 0.4 then buy 2x
- if 0.4 ≤ Risk < 0.5 then buy x
- if 0.5 ≤ Risk < 0.6 then do nothing
- if 0.6 ≤ Risk < 0.7 then sell y
- if 0.7 ≤ Risk < 0.8 then sell 2y
- if 0.8 ≤ Risk < 0.9 then sell 3y
- if 0.9 ≤ Risk ≤ 1.0 then sell 4y

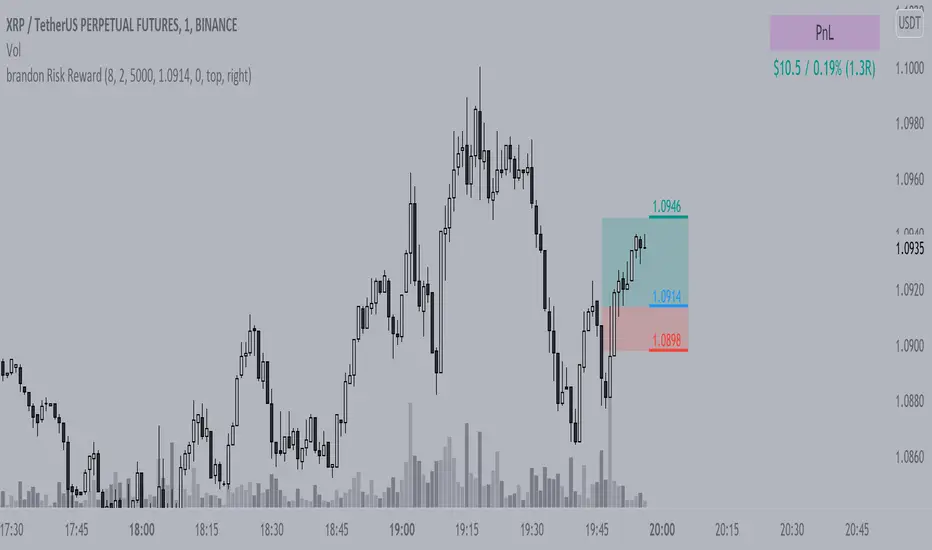
Brandon Risk RewardIndicator to track a position and its PnL, defined risk and reward given by share size and average price
BTCUSD Risk Oscillator- To be used with the BTCUSD All Time History Index (on the daily)
- Estimates the current risk of BTCUSD
- The risk model oscillates between 0 and 1 (0 is the lowest risk, 1 is the highest)
- Historically, buying when the risk is low and selling when the risk is high yields good ROI
- User inputs generally do not need to be changed, they are used to create integers for the normalization process
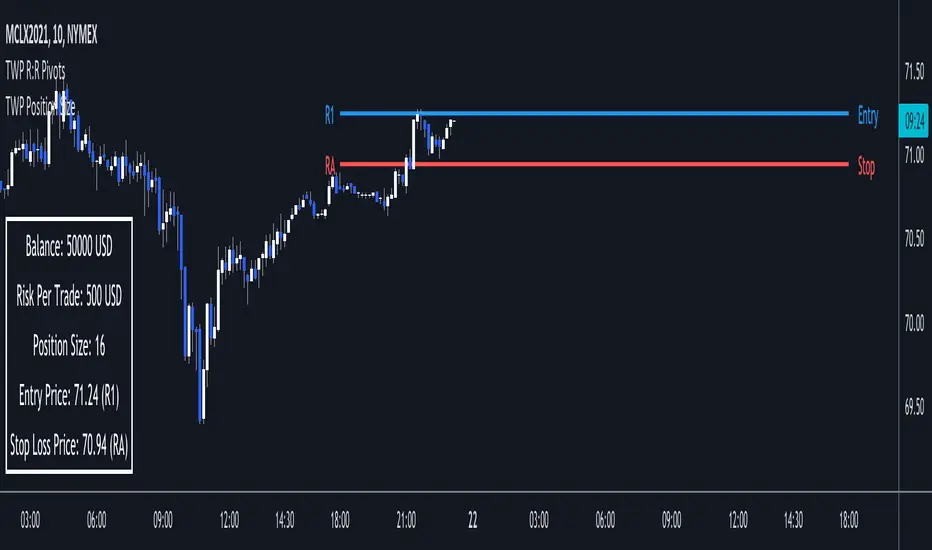
TWP Position Size Display█ OVERVIEW
Proper position sizing can significant alter your returns from a positive or negative perspective. Being aware of how much size you should put on per trade can help you in the heat of the trading moment and from blowing your account. This script sheds light on that by displaying your account balance, risk per trade, proper position size per trade relative to the pivot point entry level, entry & stop loss price levels and adjoining pivot point labels. This is a companion tool to be used in conjunction with the Automatic Risk to Reward Pivots and/or Standard Fibonacci Pivot Points.
█ FEATURES
1 — Trade Settings
• Trade bias - long or short
• Entry choice - static or dynamic
• Manual entry choice
2 — Account Settings
• Account Balance
• Account leverage
• Account currency
3 — Risk Settings
• Risk per trade (%)
4 — Text
• Size selection
• Color selection
5 — Display
• Frame color selection
• Display position selection
█ HOW TO USE
• Start your trading session by entering in your account balance into the setting and update after every trade it completed
• Set your risk per trade %
• You are ready to trade in a risk adjusted manner
█ NOTES
• The power of this tool is in its persistent placement on the screen. It is key to know where your account is at. This limit can be played with when dealing with larger values. For instance lets say your daily risk is 100k well you don't want to blow all of that in a day so you can set your risk higher than the usual retailer and still stay within your risk limits.
• The risk to reward pivots is the battery pack behind the indicator because the risk % is based on the trade setups from the pivot points.
Risk Management Tool [LuxAlgo]Good money management is one of the fundamental pillars of successful trading. With this indicator, we propose a simple way to manage trading positions. This tool shows Profit & Loss (P&L), suggests position size given a certain risk, sets stop losses and take profit levels using fixed price value/percentage/ATR/Range, and can also determine entries from crosses with technical indicators which is particularly handy if you don't want to set an entry manually.
1. Settings
Position Type: Determines if the position should be a "Long" or "Short".
Account Size: Determines the total capital of the trading account.
Risk: The maximum risk amount for a trade. Can be set as a percentage of the account size or as a fixed amount.
Entry Price: Determines the entry price of the position.
Entry From Cross: When enabled, allows to set the entry price where a cross with an external source was produced.
1.1 Stop Loss/Take Profit
Take Profit: Determines the take profit level, which can be determined by a value or percentage.
Stop Loss: Determines the stop loss level, which can be determined by a value or percentage.
2. Usage
One of the main usages of position management tools is to determine the position size to allocate given a specific risk amount and stop-loss. 2% of your capital is often recommended as a risk amount.
Our tool allows setting stop losses and take profits with different methods.
The ATR method sets the stop loss/take profit one ATR away from the entry price, with the ATR period being determined in the drop-down menu next to the selected methods. The range method works similarly but instead of using the ATR, we use a rolling range with a period determined in the drop-down menu next to the selected methods as well.
Unlike the available position management tool on TradingView, the entry can be determined from a cross between the price an an external source. The image above shows entries from the Volatility Stop indicator. This is particularly useful if you set positions based on trailing stops.

Position Sizing TableThe Position Sizing Table is a simple, clean table designed to calculate shares per trade based on total capital.

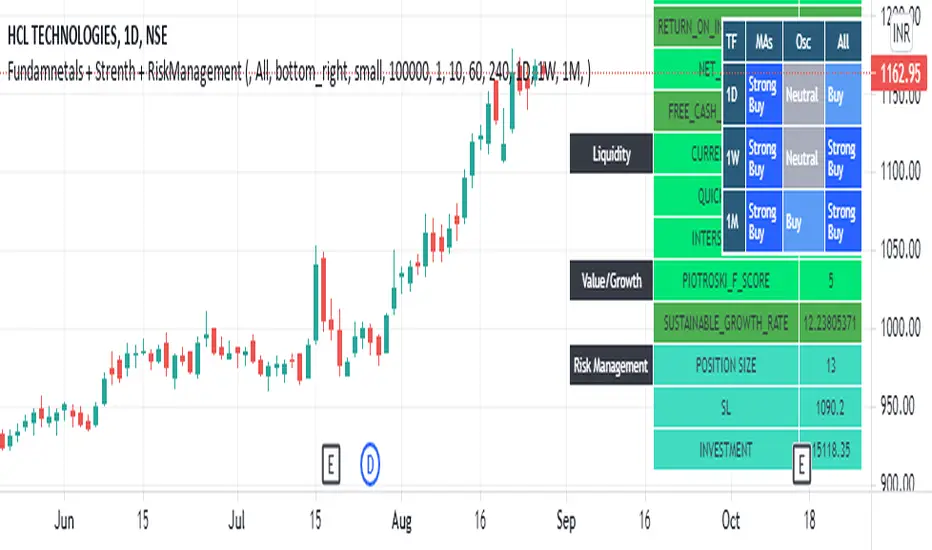
Fundamnetals + Strength + RiskManagementCreated indicator to help investors by providing fundamental, technical and Risk Management information on screen for better decision making
you can see
Fundamentals
- Solvency,
- Liquidity
- Growth,
- Profitability
- Patrioski Score
- Altman Z-Score
Technicals
- MAs
- Oscillators
Risk Management
- Position Size
- Stop Loss
- Total Investment
money managementthis indicator has been designed to make your calculations easier and faster.
you can use this indicator to set tp and sl prices based on your entry price, balance,risk and leverage.
it has been designed only for cryptocurrency market and it is not recommended to use it in other markets!
1- enter your balance in the setting of the indicator.
2- enter risk percentage of your balance.
3- enter your sl percentage.
4- enter your tp percentage.
5- set your leverage if you are trading in futures market.
6- and at last set your entry price.
your position size both in spot market and futures market and the exact price of tp and sl , will be shown top right of the screen.
caution: before using this indicator in real market, please make sure that you understand this indicator's behavior and test it.
--------------------------------------------------------------------
این اندیکاتور برای تسریع محاسبات مدیریت سرمایه و سهولت رعایت آن طراحی شده است.
شما میتوانید با وارد کردن پارامترهاقیمت ورودی، سرمایه کل، ریسک و اهرم، قیمت حد سود و ضرر خود را محاسبه کنید.
همچنین اندازه حجم معاملات شما توسط این اندیکاتور محاسبه خواهد شد.
این اندیکاتور برای بازار کریپتوکارنسی طراحی شده است و استفاده از آن در سایر بازارها پیشنهاد نمیشود.
از بخش تنظیمات اندیکاتورمراحل زیر را انجام دهید:
1- میزان سرمایه خود را در قسمت بالانس وارد کنید
2- میزان ریسک سرمایه در هر معامله را مشخص کنید (به درصد)
3- میزان حد ضرر خود را مشخص کنید (به درصد)
4- میزان حد سود خود را مشخص کنید (به درصد)
5- عدد اهرم خود را وارد کنید
6- قیمت ورود به معامله را وارد کنید
توجه: قبل از استفاده این اندیکاتور در بازار لایو لطفا آن را تست کنید و از کارکرد صحیح آن با مدیریت سرمایه خود اطمینان حاصل فرمایید.

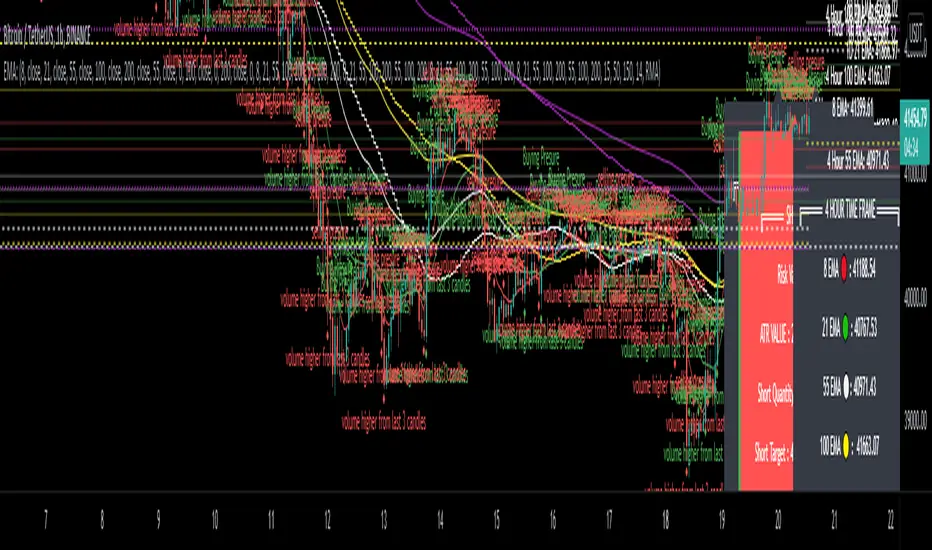
EMA - MA 21/55/100/200 with Horizontal Lines and LabelsThis indicator will help you to get dynamic support lines of EMA 21,55,100,200 and MA 55,100,200. You can get the Price of EMA And MA in Labels also.
SOLID LINES - 4 HOUR
DOTTED LINES - 1 DAY
DASHED LINE - 1 HOUR
Hope It will help you.
Trade with your own risk. I am not liable for any loss and profit based on this indicator.
Thank you.
Position calcCurrent script was created to help faster calculate possible gain or loss from a furure trade. Making money management a bit simpler, by changing values you can adjust proper trade leverage and see possible target values

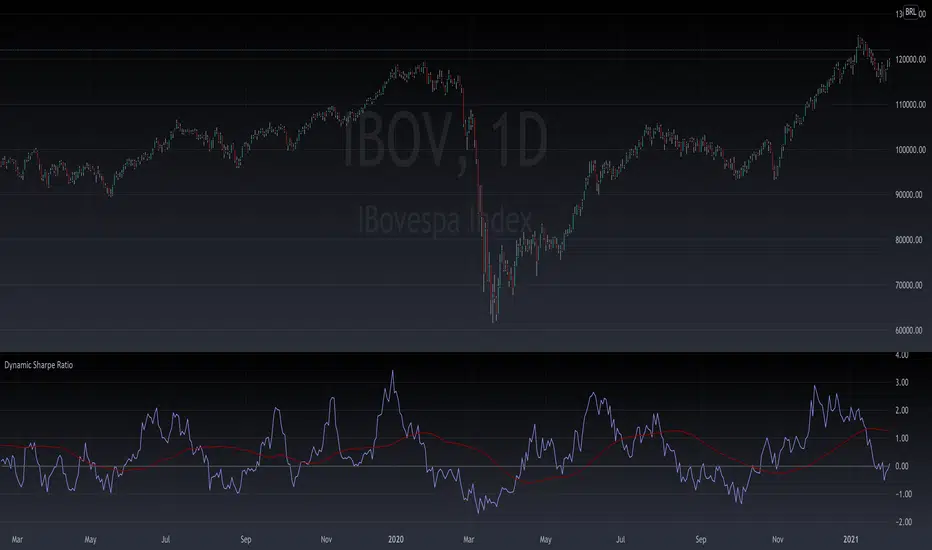
Intra Sharpe RatioThis script calculates sharpe ratio in runtime. Useful for intraday decisions when you need confirmation about the risk/reward of the asset. Enjoy!
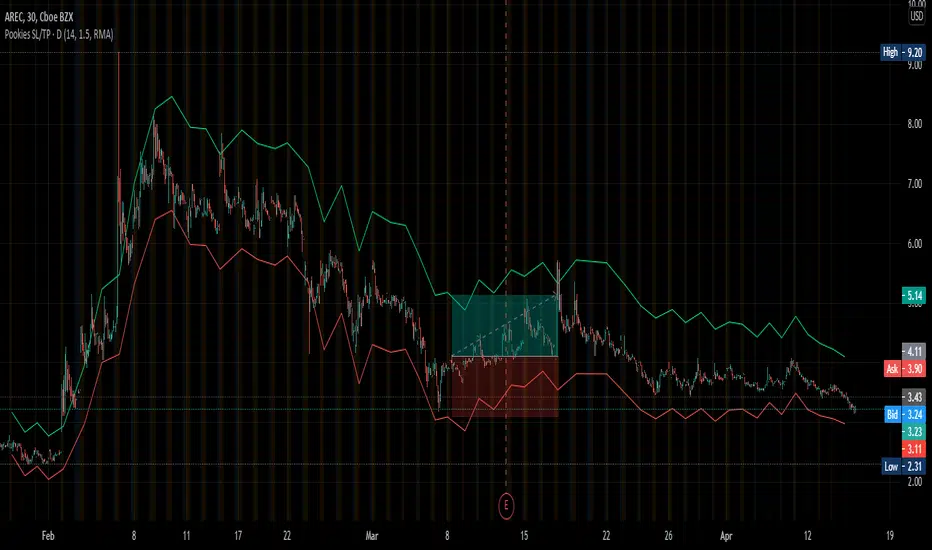
Pookies SL/TP LinesThis indicator calculates Stop-loss and Take-profit limits and plots them on the chart based on the daily ATR value for a given instrument.
The Stop-loss is calculated at the current close price minus 1x ATR and is plotted as a red line by default.
The Take-profit is calculated at the current close price plus 1.5x ATR and is plotted as a green line by default.
The colors for each line can be changed, as well as the default ATR values (length, smoothing).
To use:
When you see a long or short signal (your own preference), enter your position and set your take-profit and stop-loss limits at the current red/green lines, based on whatever Risk-Reward you've set it to.
This is also helpful in determining whether or not a trade offers enough potential to risk prior to entering the trade.
When the lines are far apart, the ATR is high. When the lines are close together, the ATR is low. This can be used to determine volatility and allow traders to buy during consolidation and sell into strength.
Thank you.
CUT MY LOSSESS - Levereged Stop loss + R / R ratio checker Hello traders!
We have heard many times that keep your losses small and allow your profits to grow. But what happens is that we often make the mistake of doing high-margin trades that we cannot afford to lose. The main reason for this problem, in my opinion, is the rush to open a position and not paying attention to how much acceptable loss in each trade is for us? Is our stop loss point compatible with the loss we are willing to accept?
Many of the losses we incur are not due to our erroneous analysis but to the wrong trading strategy, miscalculation of Stop Loss and failure to calculate the Risk/Reward for each trade. At least for most novice traders, these mistakes happen .
This script does not have complicated logic and is designed only as a help for those who are not interested in working with calculators !! I hope that sometimes that we are very excited to buy, looking at this script can give us a serious flip to avoid risk .
This is a basic script that helps us to intuitively check our stop loss in according to our leverage and to guess the approximate risk/reward of our trade. This script assumes that you always trade with half of your total capital. It is also assumed that you routinely use up to ten percent of your capital for each trade. Therefore, the first variable in this script is the amount of tolerable loss in each trade for you, which is set to 25% by default. So if you follow the previous assumptions, each trade will endanger 2.5% of your capital.
Since not all analyzes are ever accurate, we need to enter into positions that have good Risk/Reward ratio, so that even if half of our analysis fails, we will profitable. Therefore, the second variable in this script is the acceptable Risk/Reward ratio for us, which is set to 1:4 by default.
Also, to check the efficiency of the stop-loss with different trading leverage, I add five leverage by default from 1 to 5 as lines on the side of your stop-loss point.
LeV A (Lowest Leverage-WHITE): 1 by default
LeV B (AQUA): 2 by default
LeV C (YELLOW): 3 by default
LeV D (ORANGE): 4 by default
LeV E (Highest Leverage-RED):5 by default
You can change all these leverages and Acceptable margin loss and R/R ratio according to your needs.
You can also hide the leverage lines you are not dealing with through the script settings .
You will also see lines on the side of your target point to check your risk/reward ,so you can approximate your target according to your trading leverage and the risk/reward you accept. you can also hide these R/R lines from the setting.
Important Note: This script is not designed to give you a stop loss point or take profit point.
To find these points, you must use technical analysis methods , and then use this script to check the coordination of these points with your trading strategy.
Using the script is simple, but I will try to explain it with a few examples.

Volume calculationHello friends
First let me say that my English is poor and I am using Google Translator 😬🙃🙃🙃
Secondly, this indicator is open source and its use is allowed in its indicator, but in order to play it, my name must be mentioned.
Well, let's go to the description of the indicator :
This indicator gives you the amount of purchasing volume in relation to the capital, the risk you trade and the stop loss.
And shows you the LRP
I hope you use the indicator well
Your pocket is full of money
Let me say that I am Iranian

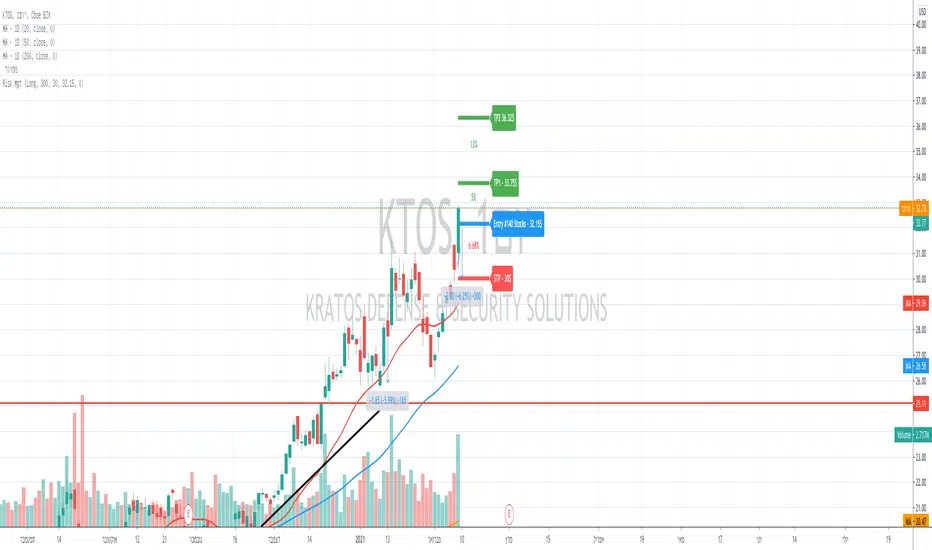
Auto Position Sizing Risk RewardThe Auto Position Sizing Risk Reward indicator shows different Risk levels 1, 1.5, 2 and 3 based on your risk amount and uses an auto Stoploss level based on the ATR.
You can set the values for the "Note or Title", "Risk Amount", "Entry", "Target Price", "Stop Loss Distance", "Default Risk/Reward" and ATR settings.
The "auto" part comes into play when you haven't yet set an Entry value, which will make everything update according to the latest Closing price of the asset.
Once you set the Entry price, the Risk/Reward levels will stop updating their positions and stay in place. This allows you to dynamically see your potential Risk/Reward as the market progresses, as well as locking in your Risk/Reward levels once you are ready to enter a position.
Your Position Size as well as actual Stoploss level and Cost is displayed along with the other values in the textbox that floats next to the R/R levels.
This indicator was inspired by and relies heavily on the work done by zzzcrypto123 and NXT2017 in their indicators, but I felt that this version is unique enough to hopefully be of use to the general community.
I hope this helps you to trade better! Please feel free to improve it and provide suggestions.

Buy and Sell Signals (With Stops and TP) - No Repaint
This strategy is primarily based on the MACD-indicator, but signals are filtered with the 200 ema.
This indicator gives you for every trade a stopp loss and take profit line.
As with every other strategy risk management is key. The trades taken have all 1.5:1 risk ratios, so when you lose one trade and win one you are still in profit.
This will only work if you calculate your position size accordingly when actually trading!
Without leverage:
position_size = (portfolio * loss_per_trade) / (stop_loss_in_percent )
Leverage:
position_size = (portfolio * loss_per_trade) / (stop_loss_in_percent * leverage)
For example:
portfolio = 100000
loss_per_trade = 0.01 | I only want to lose 1% per trade
stop_loss_in_percent = 0.04 | The stoploss is 4% away from our entry
(100000 * 0.01) / 0.04 = 2500 => if this trade hits my stop, I will only lose 1 % of my portfolio.
This strategy works well with:
BTCUSD 30m
BANDUSDTPERP 5m
EUR DOLLAR 15m
Of course it can be applied to anything, but you should firstly validate the strategy via backtest for the according trading pair and timeframe as it can perform differenlty in various timeframes.
This script does not repaint.
If you are interested in this strategy dm me.
Good luck on your trades!

CRYPTO HA Strategy money maker long termToday I bring you another amazing strategy.
Its made of 2 EMA in this case 50 and 100.
At the same time, internaly for candles we calculate the candles using the HA system ( while still using in live the normal candles). This way we can assure that even if we use HA candles, we avoid repainting, and its legit.
We first calculate the HA candles based on the EMA 50 values, and after that , we use that candle properties to apply to EMA 100.
Once we have that, for entries we have the next conditions :
sell = o2 > c2 and o2 < c2 and time_cond
buy = o2 < c2 and o2 > c2 and time_cond
For sell : Our open from HA 100 is bigger than Close from ha 100, and the previous open is smaller than previous close
For long : Our open from ha 100 is smaller than close from ha 100 and the previous open is bigger than previous close.
Then we have 2 options :
If we wnat to go only long , which is my prefered version ,or the original one where we go both long and short.
I found that the best results are in general around bigger timeframes, 1h+ , 3h works the best so far on my tests.
For exit we have 2 versions :
1 lets say we had a long signal, as soon as we have a short signal we close the trade. Viceversa for short.
2. Is based on price % movement. In this case I use 7.5% price movement of asset.
We have no TP in use for this system.
For the purpose of this test I use 10.000 $ account. For test I use 100% of it, without any leverage.
I use the SL based on price movement , which is a very risky tool, since it can fluctuate even at 20-30% of our capital.
For comission I used 0.1% for each deal, and a slippage of 5 points.
Be cautious with this system !
If you have any questions , message me.

Chonky Floating R:RVisualize the floating R:R of an active position.
Input the stop loss and target to return live R:R
