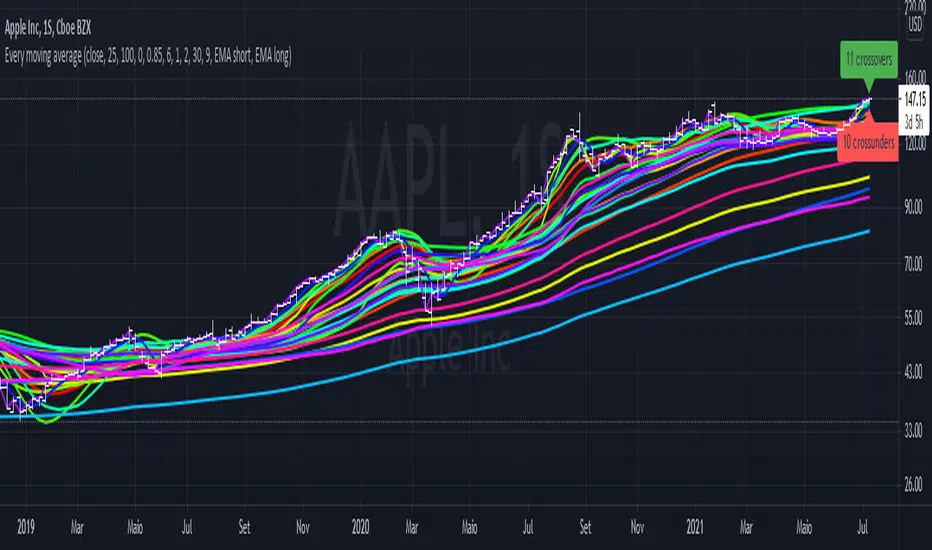
Every single moving average (ALMA, EMA, HMA, KAMA, RMA, SMA...)So you may be looking at the graph and thinking "this is a mess", and I agree.
The purpose of this script is to plot in the same graph every single type of moving average that I could think of, so you can find the ones that are better for your timeframe and for your asset. Once you add it, disable those types that doesn't seem to serve your purpose, until you can select one you like.
The average types are: ALMA, EMA, HMA, KAMA, RMA, SMA, SWMA, VIDYA, VWAP, VWMA, and WMA. Each one is ploted two times (except SWMA and VWAP), one with a short period, and another with a long, both of which you can configure.
Rma
Resampling Filter Pack [DW]This is an experimental study that calculates filter values at user defined sample rates.
This study is aimed to provide users with alternative functions for filtering price at custom sample rates.
First, source data is resampled using the desired rate and cycle offset. The highest possible rate is 1 bar per sample (BPS).
There are three resampling methods to choose from:
-> BPS - Resamples based on the number of bars.
-> Interval - Resamples based on time in multiples of current charting timeframe.
-> PA - Resamples based on changes in price action by a specified size. The PA algorithm in this script is derived from my Range Filter algorithm.
The range for PA method can be sized in points, pips, ticks, % of price, ATR, average change, and absolute quantity.
Then, the data is passed through one of my custom built filter functions designed to calculate filter values upon trigger conditions rather than bars.
In this study, these functions are used to calculate resampled prices based on bar rates, but they can be used and modified for a number of purposes.
The available conditional sampling filters in this study are:
-> Simple Moving Average (SMA)
-> Exponential Moving Average (EMA)
-> Zero Lag Exponential Moving Average (ZLEMA)
-> Double Exponential Moving Average (DEMA)
-> Rolling Moving Average (RMA)
-> Weighted Moving Average (WMA)
-> Hull Moving Average (HMA)
-> Exponentially Weighted Hull Moving Average (EWHMA)
-> Two Pole Butterworth Low Pass Filter (BLP)
-> Two Pole Gaussian Low Pass Filter (GLP)
-> Super Smoother Filter (SSF)
Downsampling is a powerful filtering approach that can be applied in numerous ways. However, it does suffer from a trade off, like most studies do.
Reducing the sample rate will completely eliminate certain levels of noise, at the cost of some spectral distortion. The lower your sample rate is, the more distortion you'll see.
With that being said, for analyzing trends, downsampling may prove to be one of your best friends!

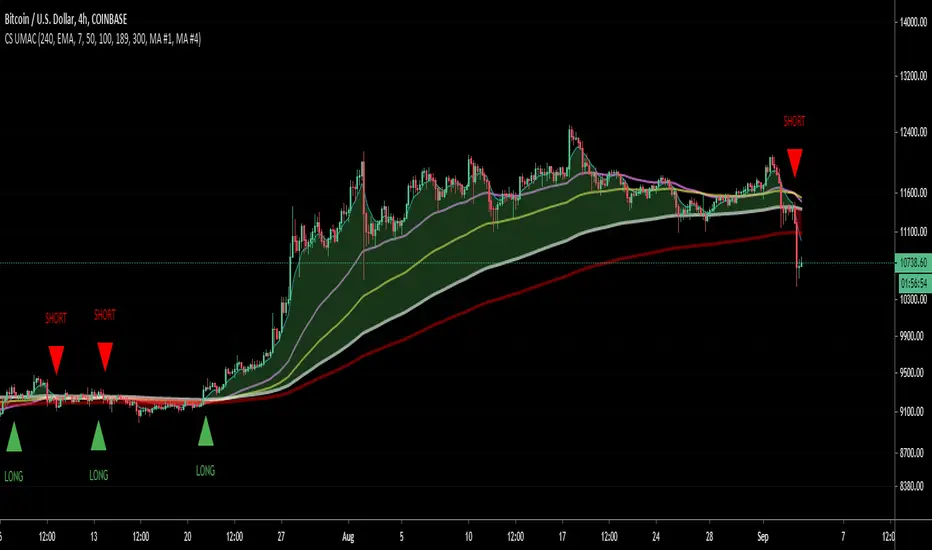
CS Ultimate MA CrossThis indicator adds 5 Moving Averages on your chart. You can select the MA Type: SMA, EMA, RMA or VWMA.
By selecting a Fast MA and a Slow MA you can also draw a cloud to make the Bull or Bear bias more visual. Possibility to add on the chart Long/Short signal.
MTF possible by changing the range which is particularly useful for HTF analysis while looking a LTF price action.
Weekly & Daily SMA 50/100/200The daily and weekly simple moving averages (SMA) are displayed in all timeframes.
The SMAs can be used for support and resistance. The lines of the past 50, 100 and 200 days and weeks are considered strong supports and resistances.
The daily lines are yellow and the weekly lines are green. The thicker and more visible a line is, the more important it is in the chart.

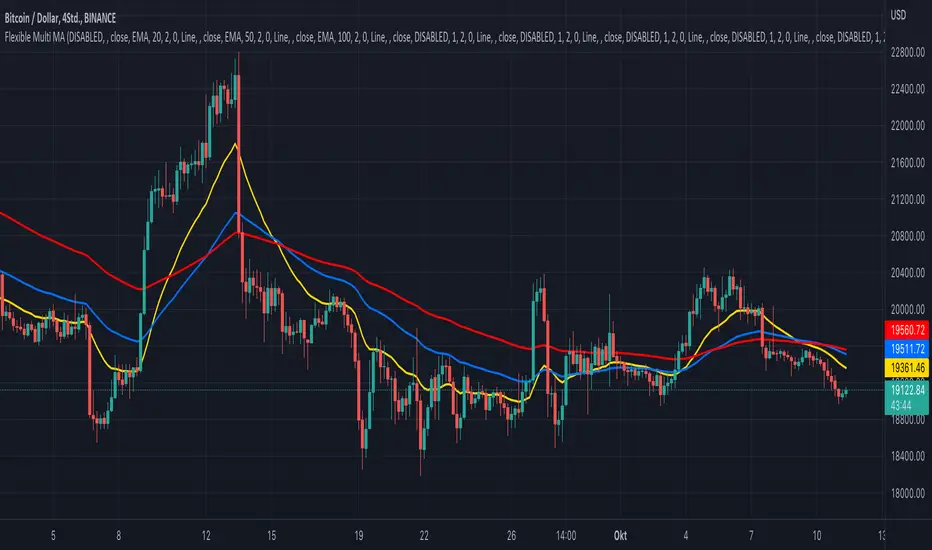
KINSKI Flexible Multi MA (EMA, SMA, RMA, WMA, VWMA, KAMA, HMA)This Multi Moving Average (MA) indicator is more flexible than any other indicator of this type offered so far. You can define up to 10 different Moving Average (MA) lines based on different calculation variants.
The following MA types can be configured.
- EMA: Exponentially Moving Average
- SMA: Small Moving Average
- RMA: Rolling Moving Average
- WMA: Weighted Moving Average
- VWMA: Volume Weighted Moving Average
- KAMA: Kaufman's Adaptive Moving Average
- HMA: Hull Moving Average
Which settings can be made?
- Selection for calculation formula ("Calculation Source"). The default value is "close".
- for each MA line the "Length" and the "Type" can be defined
- furthermore you can make layout adjustments via the "Style" menu
TradeChartist MTF RSI Spotter™TradeChartist MTF RSI Spotter is an elegant Multi Timeframe RSI tool that helps spot price trends using visually engaging and appealing RSI plots and backgrounds compared to the basic RSI plot. Also the Bull and the Bear background fills + HTF RSI based background fills are highly useful for traders who like to visually understand areas of entry and exit based on RSI .
What does ™TradeChartist MTF RSI Spotter do?
Plots RSI with visually spottable colors for Bull and Bear zones (Green and Red) with optional background fill.
Plots RMA based on User specified length.
Plots user preferred HTF RSI on same chart as chart TF - HTF resolution from indicator settings drop-down must be used.
Fills Bull and Bear zone colors based on HTF based RSI movement.
Spots Regular RSI Bullish and Bearish Divergences.
Plots RSI color candles on main chart based on Upper and Lower RSI band.
Plots RSI based on RSI smoothing (1 for Regular RSI without smoothing) and Heikin Ashi RSI if opted from indicator settings.
This indicator works like a dream when used with other indicators for confirmation of Trends.
Note 1: Divergences don't work to trader's expectations all the time. It is a great indicator but has to be used with caution and entries must be confirmed using another indicator like Volume , Trend, fundamentals, market sentiment etc. They can't be used on their own to decide entry and exit.
Note 2: Bull and Bear RMA with chart TF RSI should be used for confirmation and not as a standalone indicator for entry and exit.
Example charts
Premium Scripts - Trial access and Information
Trial access offered on all Premium scripts.
PM me directly to request trial access to the scripts or for more information.

Bollinger Bands Plus [xdecow]Bollinger bands with the option to use different types of moving averages.
-SMA
-EMA
-RMA
-WMA
-VWMA
-SWMA
-DEMA
-HMA
-SMMA
-T3
-TEMA

Gordon-RMATRENDTrend Indicator displaying signals for SHORT/LONG. Good results for Low Timeframe (1H) Crypto/FIAT pairs.
Use of CHOP, RMA & Volume indicators.
Have had success using it on XBT/USD & BTC/USD Pairs.

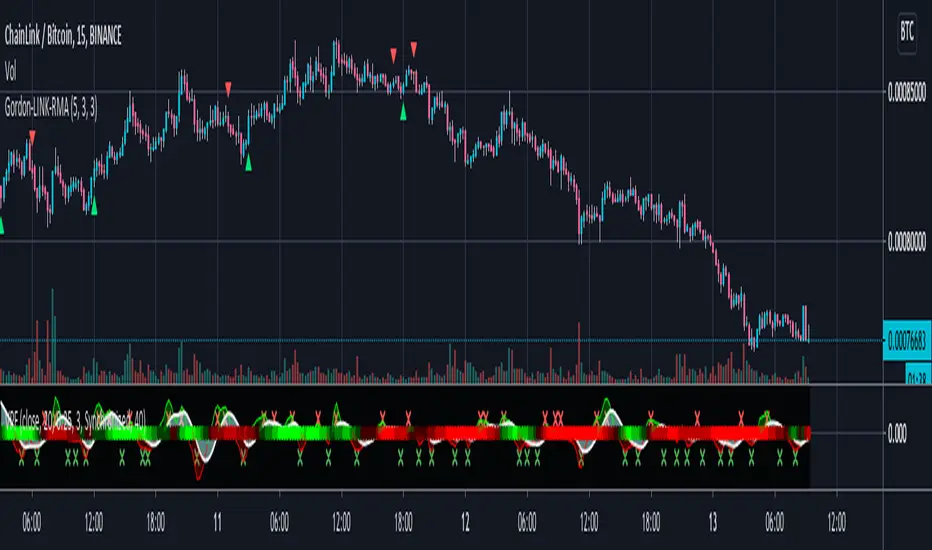
Gordon-LINK-RMA - LINK/BTC - Trend Indicator (Swing)Configured specifically for LINK/BTC Markets on Binance. Plots changes in low timeframe trend based off Multiple timeframe RMA values.
Buy = Green Triangle
Sell = Red Triangle
RSI background by AvesTradingHello,
This is RSI indicator that shows background color, when proper levels reached, instead of line in another pane. Customizable options are available:
- source
- length
- overbought level
- oversold level
I have added as well RMA of RSI for extra confirmation if needed. I hope you enjoy and will leave me some feedback! Don't forget to follow me for new releases.
Cheers
Aves
Please remember that the indicators provided by me are for educational purposes only.

8/8/8 Moving Averages
Total of 24 individual moving averages. There are 3 groups, and each group has 8 moving averages. Each group can be set the different sources and different moving average types(SMA, EMA, RMA, WMA).

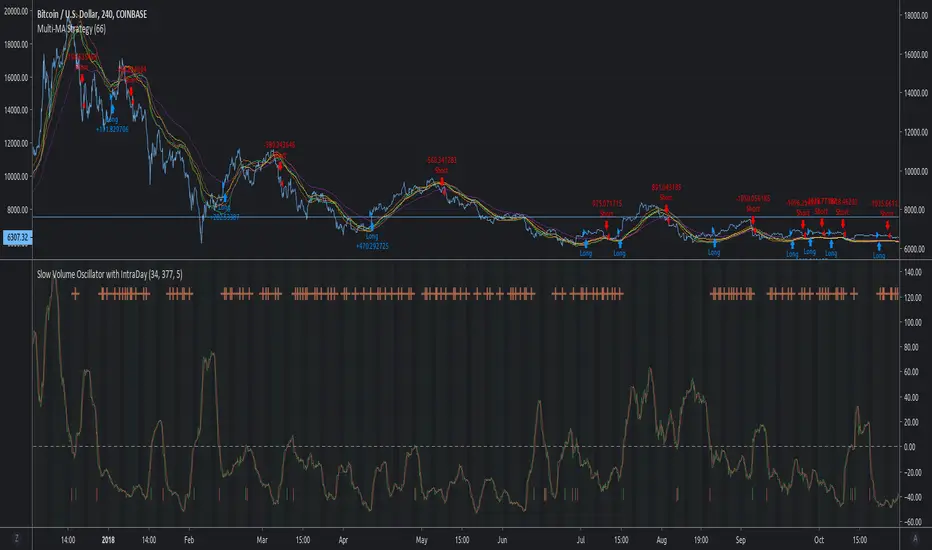
MACD Multi-MA StrategyThis script applies the average of each major MA (SMA, RMA, EMA, WVMA, WMA) to the MACD formula.
The logic is simple. When all 5 MA's are in agreement in direction, then then script will notify users of change.
I posted this as a strategy to help show how logic does in back test. If you use my simple yet effective solution to find take profit locations, you can blow this back testing out of the water!!!
To set alerts simply turn script into study
//@version=2
study(title="MACD Multi-MA Study", overlay=false)
src = close
len1 = input(8, "FAST LOOKBACK")
len2 = input(144, "SLOW LOOKBACK")
/////////////////////////////////////////////
length = len2-len1
ma = vwma(src, length)
plot(ma, title="VWMA", color=lime)
length1 = len2-len1
ma1 = rma(src, length1)
plot(ma1, title="RMA", color=purple)
length2 = len2-len1
ma2 = sma(src, length2)
plot(ma2, title="SMA", color=red)
length3 = len2-len1
ma3 = wma(src, length3)
plot(ma3, title="WMA", color=orange)
length4 = len2-len1
ma4 = ema(src, length4)
plot(ma4, title="EMA", color=yellow)
long = ma > ma and ma1 > ma1 and ma2 > ma2 and ma3 > ma3 and ma4 > ma4
short = ma < ma and ma1 < ma1 and ma2 < ma2 and ma3 < ma3 and ma4 < ma4
alertcondition(long == true, title='MACD LONG SIGNAL', message='MACD LONG!')
alertcondition(short == true, title='MACD SHORT SIGNAL', message='MACD SHORT!')
Colored Moving Averages with Zero Lag and ATR BandsEnglish description:
- You can choose from 6 different Moving Averages: SMA , EMA , WMA , VWMA , RMA, SWMA
- Turn ON/OFF the Zero Lag alghorithm
- Make it 2 colors for better visibility of a trend
- Turn ON/OFF the ATR Bands up to 5 multiplicator
- Set the offset on the time axis
Polski opis:
- Możesz wybierać z 6 różnych średnich kroczących: SMA , EMA , WMA , VWMA , RMA, SWMA
- Włączyć/Wyłączyć algorytm Zero Lag
- Włączyć opcję 2 kolorowej średniej żeby lepiej widzieć trendy
- Włączyć/Wyłączyć wstęgi ATR z maksymalnym mnożnikiem x5
- Ustawić przesunięcie względem osi czasu

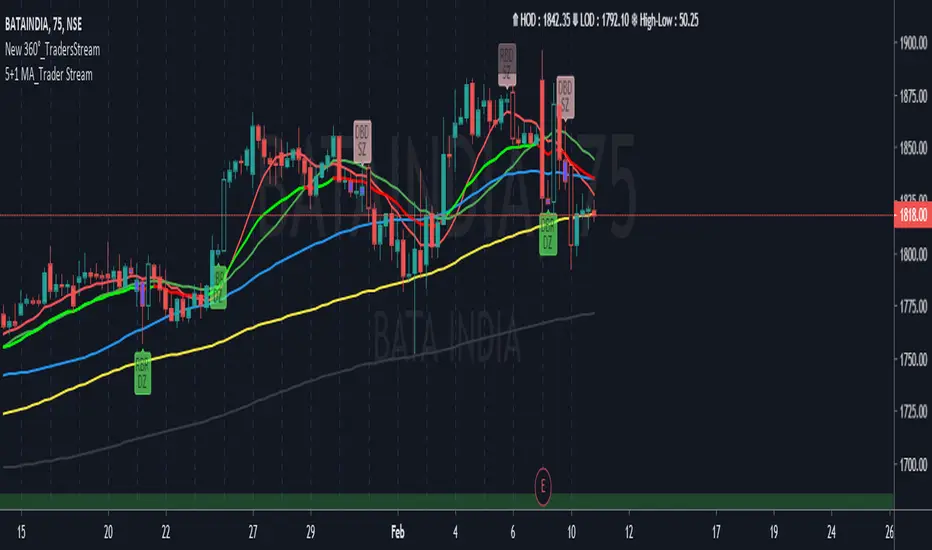
Moving Averages Traders StreamHello Guys this is a new set of Multiple Moving Averages with Bullish and Bearish coloured. Our Tool Includes SMA, EMA, RMA, VMA and VWMA. So if any comments than please.......
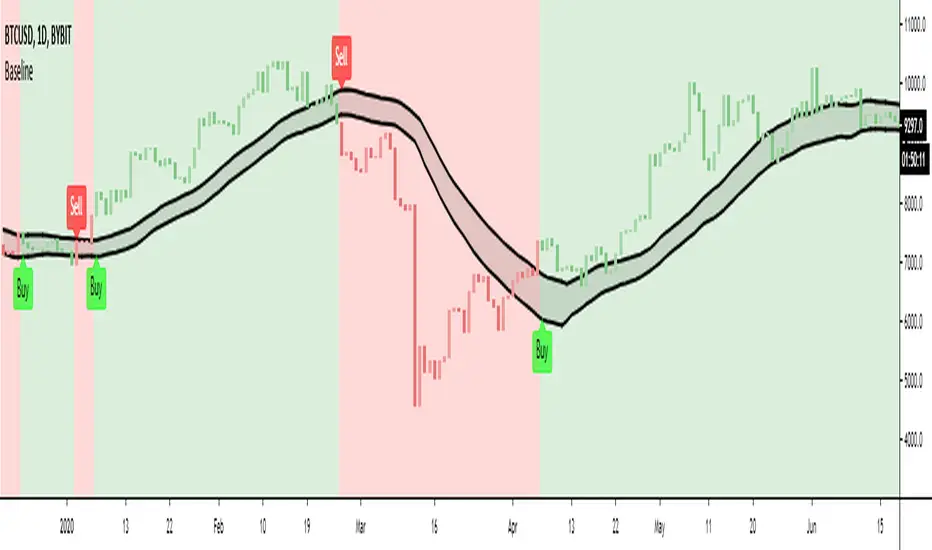
Baseline - evoPlots the high and low of your chosen moving average.
Options are:
SMA = Simple Moving Average
EMA = Exponential Moving Average
WMA = Weighted Moving Average
HMA = Hull Moving Average
VWMA = Volume Weighted Moving Average
RMA = Exponetial Weighted Moving Average
ALMA = Arnaud Legoux Moving Average
Unbox "Use Current Timeframe" to use chosen timeframe below
I mainly use this to get in and out of the market for futures trading, to reduce fake outs of having just one moving average line.
Let me know if you like it..
Inspired from LazyBear's EMAenvelope :)
Ori Moving Averages (MTF)This indicator helps to plot different moving averages with different types and different multi time frame options.

Scripting Tutorial 5 - Triple Many Moving Averages CrossoversThis script is for a triple moving average indicator where the user can select from different types of moving averages and periods. This script improves upon tutorial 3 by adding source selection for MAs and another option for an MA that is not built-in, the HMA . It is meant as an educational script with well formatted styling, and references for specific functions.
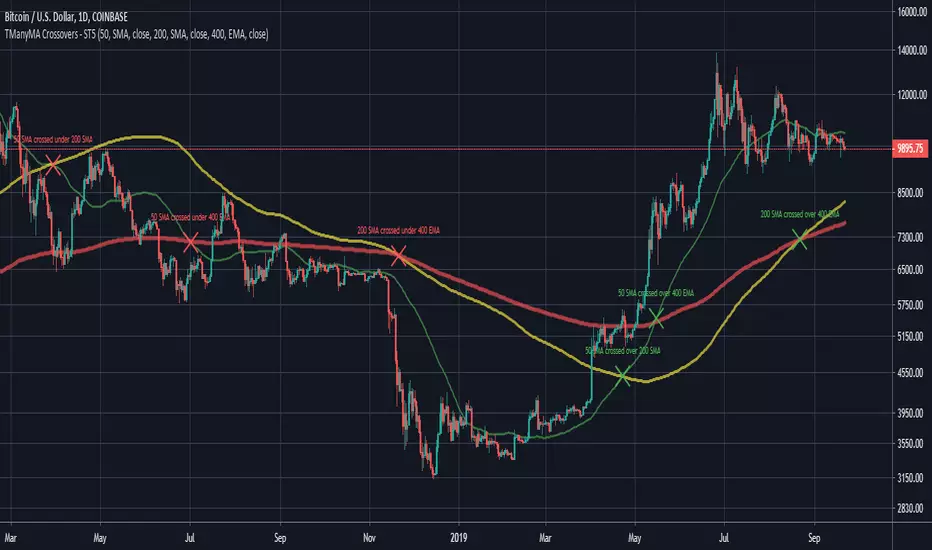
Scripting Tutorial 4 - Triple Many Moving Averages ImprovedThis script is for a triple moving average indicator where the user can select from different types of moving averages and periods. This script improves upon tutorial 3 by adding source selection for MAs and another option for an MA that is not built-in, the HMA. It is meant as an educational script with well formatted styling, and references for specific functions.
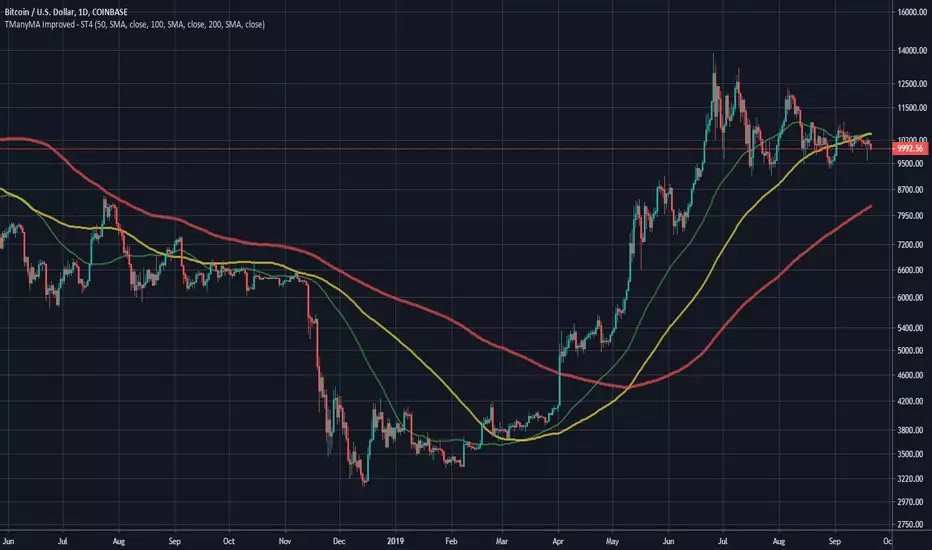
Scripting Tutorial 3 - Triple Many Moving AveragesThis script is for a triple moving average indicator where the user can select from different types of moving averages. It is meant as an educational script with well formatted styling, and references for specific functions.

[SignalFI] CogniFICogniFI uses 8 independent Fibonacci based inputs to calculate a unified Center Of Gravity (COG) and RMA or RSI based moving average created by J. Welles Wilder.
FIBONACCI BASED TREND AND MOMENTUM DISCOVERY
RSI BASED MOVING AVERAGES COMBINED WITH CENTER OF GRAVITY (COG)
COLOR BASED TREND SMOOTHING FOR INDICATOR SIGNAL
In this updated version, we've added several coloring options that are meant to give context to the larger trend of CogniFI. In addition we've added new signal shapes, that are meant to signal the rise or fall in pressure against the leading COG lines. When multiple square shapes are presented followed by a "labelup" shape, we can assume a healthy rise of COG against pressure. When we see an immediate "Labelup" that is indicative of a forceful move, which could result in a reversal (or the start of a larger trend).
SignalFI was created to help traders and investors to effectively analyze the market based on the Golden Mean Ratio (Fibonacci numbers), plan a trade and ultimately execute it. To help inform and educate market decisions we developed a set of Trading Indicators which are available on TradingView , the most advanced and yet easy to use charting platform available on the web.
SignalFI indicators are just that, indicators. Our indicators are generally configured to use completely historical data (negating repaint), and we advise all alerts created with SignalFI indicators to be fired upon "close" of the current candle. Our indicators can provide valuable context and visualization support when performing market analysis and executing buy and sell decisions. However. we are not financial experts, and all information presented on this site or our other media outlets are for educational purposes only.
For subscription information, visit www.signalfi.net and follow us on twitter: @signalfi_
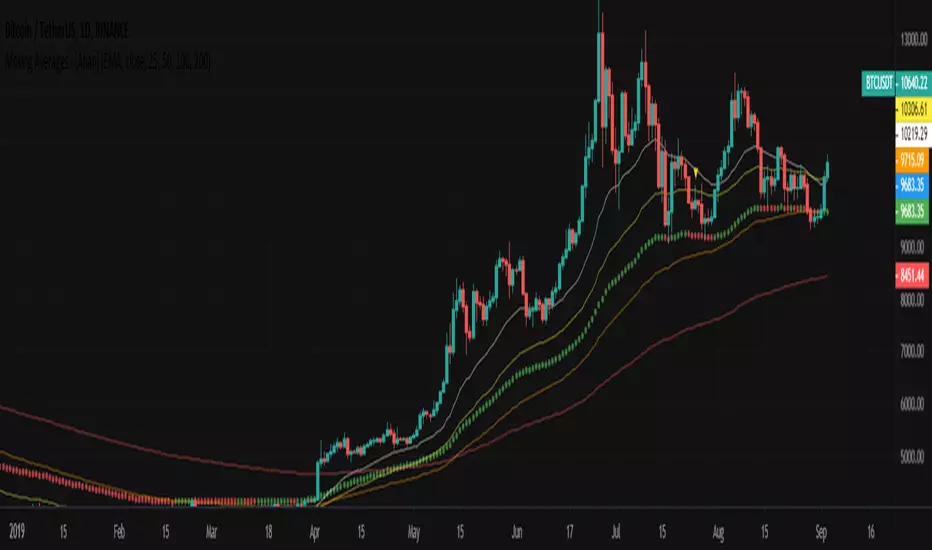
Moving Averages - [Anan]Hello Friends,,
This is my own Moving Averages indicator :
- V4 Pinescript
- 4 Plots Moving Average on the same chart
- 12 Moving Average types !
- Types:
- Lenght: optional
- Source: optional
- Combined Moving averages ! (try it with EMA and thank me later ;D)
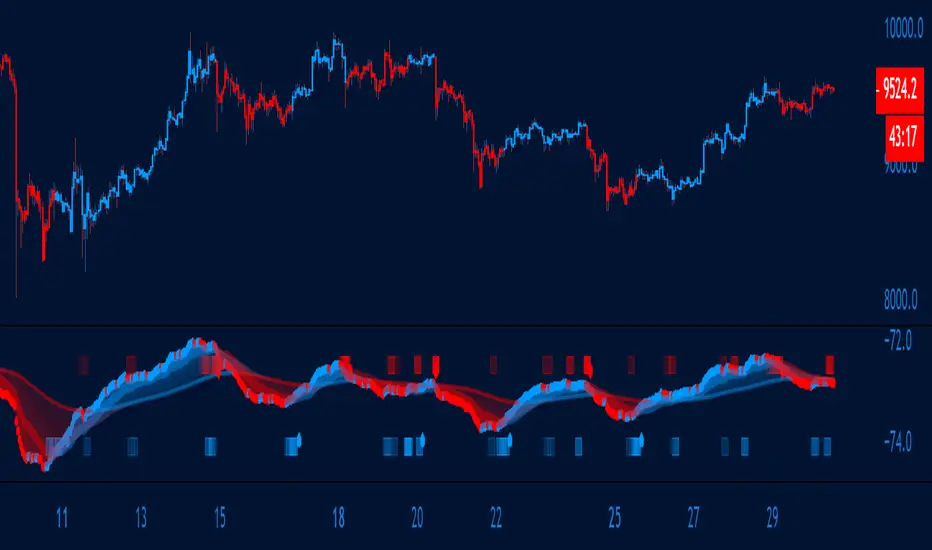
Chop and explode (ps4) UPD for XBTUSD, etc.This is an update that resolves rendering problems with XBTUSD.

MACD phi³Esse script possui 6 MACD configurados com o Phi³ e um sistema para encontrar as divergências em cada linha sendo impresso na vela o H1, H2, H3, H4, H5 e H6, os tempos de 17 velas até 610, já ajustado para mostrar em 72 minutos, pode por em qualquer tempo, mas tempos menores ele irá duplicar a impressão dos dados, ex: se por em 17 ou 15 minutos, irá aparecer 4 velas com os avisos, pois irá dividir o tempo.
Foi testado com o BTCUSD, não sei a eficiência com outras moedas, fiquem a vontade pra comentar e criticar.
OBS: Não me responsabilizo por eventuais falhas do script ou perdas, é uma ferramenta em fase de teste.
