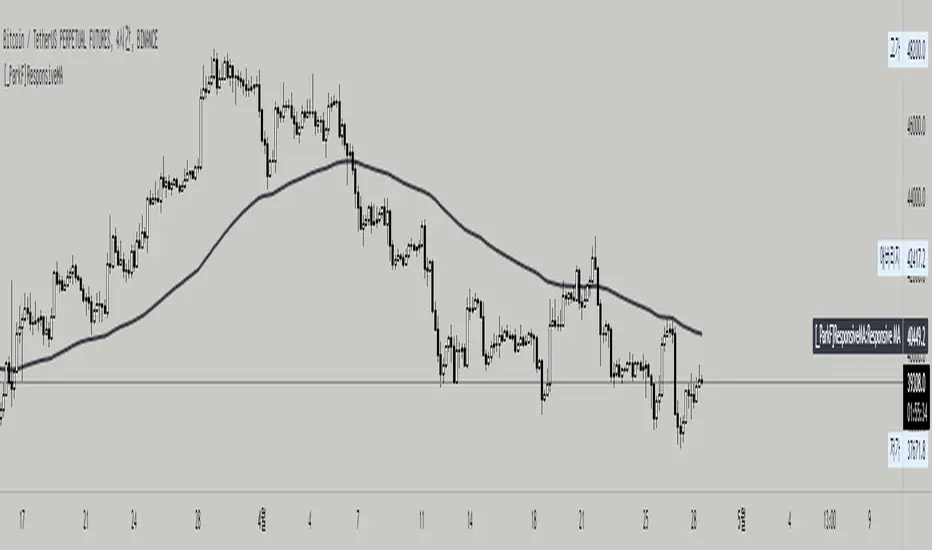
[_ParkF]ResponsiveMAThis indicator is a Responsive Moving Average, and it was made easily by using the Swtich function without using the if function, and it was released as an open source so that traders can freely CUSTOM.
If you select the Moving Average type from the Input menu and input the desired period value of MA for each time frame, the period value of the MA you set in INPUT will be plotted whenever the time frame is changed.
I hope this helps you with your trading.
-----------------------------------------------------------------------------------------------------------------------------------------------------------------------------------------------------------------------------------------------------------------------------
이 지표는 Responsive Moving Average이며, if를 사용하지 않고 Swtich를 이용하여 간편하게 만들었으며, 트레이더분들이 자유롭게 커스텀 하실 수 있게 오픈 소스로 풀었습니다.
Input 메뉴에서 Moving Average 의 Type을 고르고 각각의 Time Frame 마다 원하는 MA의 기간값을 입력하면 시간대를 변경할 때마다 자신이 input 메뉴에서 설정했던 MA의 기간값이 plot 되게 됩니다.
당신의 트레이딩에 도움이 되었으면 좋겠습니다.
Rma
AMACD - All Moving Average Convergence DivergenceThis indicator displays the Moving Average Convergane and Divergence ( MACD ) of individually configured Fast, Slow and Signal Moving Averages. Buy and sell alerts can be set based on moving average crossovers, consecutive convergence/divergence of the moving averages, and directional changes in the histogram moving averages.
The Fast, Slow and Signal Moving Averages can be set to:
Exponential Moving Average ( EMA )
Volume-Weighted Moving Average ( VWMA )
Simple Moving Average ( SMA )
Weighted Moving Average ( WMA )
Hull Moving Average ( HMA )
Exponentially Weighted Moving Average (RMA) ( SMMA )
Symmetrically Weighted Moving Average ( SWMA )
Arnaud Legoux Moving Average ( ALMA )
Double EMA ( DEMA )
Double SMA (DSMA)
Double WMA (DWMA)
Double RMA ( DRMA )
Triple EMA ( TEMA )
Triple SMA (TSMA)
Triple WMA (TWMA)
Triple RMA (TRMA)
Linear regression curve Moving Average ( LSMA )
Variable Index Dynamic Average ( VIDYA )
Fractal Adaptive Moving Average ( FRAMA )
If you have a strategy that can buy based on External Indicators use 'Backtest Signal' which returns a 1 for a Buy and a 2 for a sell.
'Backtest Signal' is plotted to display.none, so change the Style Settings for the chart if you need to see it for testing.

Any 8 Moving Averages - Alerts, Clouds & PercentagesANY 8 MOVING AVERAGES WITH ALERTS, COLOR CHANGING CLOUDS AND PERCENTAGE GAPS
This is a fully customizable moving average cloud with alerts. It has 8 moving averages that can be individually set to any type such as: EMA, SMA, HMA, WMA, VWMA & RMA. Each moving average paints green when price is above it and paints red when price is below it. They include colored clouds between the price and each moving average as well.
You can individually change the length, colors, type of moving average and turn them off for those of you that only want a few moving averages on your chart at once.
There is also a percentage gap table that tells you how far away the price is from each moving average which are labeled accordingly.
You can also set alerts for when price crosses each moving average.
***HOW TO USE***
When all the moving averages are green, buy dips down to the next lower moving average. When all the moving averages are red, short the tops up to the next moving average.
Trade in the direction of the trend and wait for all lines to turn one color before taking trades in that direction.
Make sure there is a big enough percentage gap to the next moving average before taking a trade.
***MARKETS***
This indicator can be used as a signal on all markets, including stocks, crypto, futures and forex.
***TIMEFRAMES***
This moving average can be used on all timeframes.
***TIPS***
Try using numerous indicators of ours on your chart so you can instantly see the bullish or bearish trend of multiple indicators in real time without having to analyze the data. Some of our favorites are our Auto Fibonacci, Directional Movement Index + Fisher Price Action, Volume Profile With Buy & Sell Pressure, Auto Support And Resistance and Money Flow Index in combination with this moving average cloud. They all have unique features to help you make better and faster trading decisions.

Ichimoku VariationsThe Ichimoku cloud is traditionally constructed from the highest high and lowest low for a number of periods. This script allows for it to be transformed and calculated like more traditional moving averages (e.g. simple moving average, exponential moving average). Since the Ichimoku is normally a system of moving average-like lines, maybe someone out there will learn something from being able to switch to sma, ema, etc etc.
In general, I think no TA indicator is a magic bullet, and you should just use what you like!
Credit: This script utilizes the "Color Gradient Framework" tutorial by LucF (PineCoders) to create gradient visuals, which are also customizable for the user.
Recommended modes:
default
SMA
EMA
SMMA
WMA
VWMA
Tillson T3
Not Recommended (These moving averages are too fast, and probably will require adjusting settings to something like the 20-60-120-30 to make more sense):
HMA
EHMA
TEMA
ALMA
LSMA

Titan EMA Averaging Strategy - (DYOR) By MrCryptoTitan EMA Averaging Strategy (VIP Only) Enable Longs or Shorts only Works With Crypto + Forex with correct back tested settings This is not set and forget. This requires you to back test and have relevant Risk Management in place.
The Strategy: The script uses 3EMA with engulfing candle to enter a trade in either short or long direction.
You will need to test the settings and adjust them so there isn't too many - re-entries and make sure you take profit big enough to not trigger on same candle.
When setting alerts you can use once per bar however this may trigger multiple alerts if the candle is moving very fast so this is not recommended. So doing once per bar close will mean entry is confirmed as bar is closed. You will need to select this in drop down menu.
- Max Trade Limit.
- All in one Alert. - Basically add syntax for example- Long/Take Profit/Re-entry/Emergency Stop. Then add one alert and select "Alert() function calls Only" Change Alert name to custom. That's it.
-Built-in Strategy tester.
- Trade Filter - Multi-MA Filters. - MA", "EMA", "WMA", "HullMA", "VWMA", "RMA", "DEMA", "TEMA", VWAP
- ADX Filter based on Level.
Please note when running this strategy you can only trade longs only or shorts only for this setup to be potentially profitable. Also note that setting unrealistic profit targets will make a loss. So it is very important to back test everything.
This Script does not use any Security functions. All indicators which are used part of the strategy are obtained from Trading View indicator Library and have source code has been changed to make this into Strategy.
Please Do Your Own Research before using this.
Anymore information please DM me directly

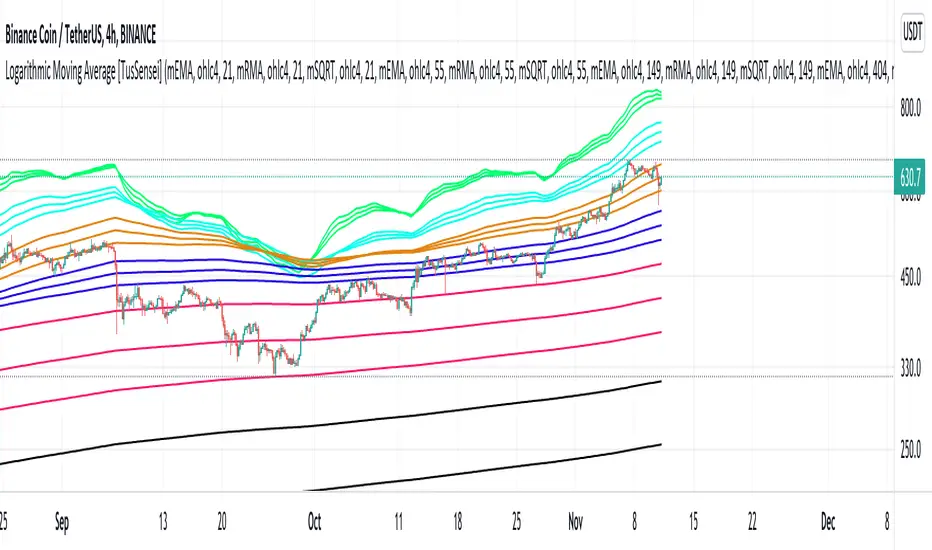
Logarithmic Moving Average [TusSensei]Logarithmic moving averages involve mathematical modification of classical moving averages(EMA-RMA-SMA). Logarithmic modified averages deviate high over short time periods. For long time periods, it behaves exactly like the original moving averages. Its basic formulation is (MovingAverage x (1 + (1 / log(length))).
The most important reason for the operability of logarithmic moving averages is the time periods they use. The values used are 21-55-149-404-1098-2981. These numbers are the consecutive powers of the number "e", which is the base of the natural logarithm (rounded up to an integer).
In this script you will also see another moving average called SQRT. This moving average is equal to the square root of the product of the EMA and the RMA. In other words, it is a moving average that is the geometric mean of two averages. In this script, you can use all of the EMA-RMA-SQRT and SMA averages in the classical and modified way. For formulaic modification, it is sufficient to select "mEMA", "mRMA" forms from the setting section.
Thanks everyone!
MACD Alert [All MA in one] [Smart Crypto Trade (SCT)]This code is a gift from "Smart Crypto Trade (SCT)" group
MACD indicator contains 3 EMA, I think one of the best usage of MACD is trend detection and divergences.
In our indicator, you can select the type of Moving averages that used in macd.
You can using "MACD" based on several types of moving averages including:
Exponential Moving Average ( EMA )
Volume-Weighted Moving Average ( VWMA )
Simple Moving Average ( SMA )
Weighted Moving Average ( WMA )
Exponentially Weighted Moving Average (RMA) that used in RSI
Smoothed Moving Average ( SMMA )
Arnaud Legoux Moving Average ( ALMA )
Double EMA ( DEMA )
Double SMA (DSMA)
Double WMA (DWMA)
Double RMA (DRMA)
Triple EMA ( TEMA )
Triple SMA (TSMA)
Triple WMA (TWMA)
Triple RMA (TRMA)
Linear regression curve Moving Average ( LSMA )
Variable Index Dynamic Average ( VIDYA )
Fractal Adaptive Moving Average ( FRAMA )
In other words we tried to collect all the most popular MAs in our MACD indicator.
In addition, you can use four types of alert or alarm conditions for detection LONG or SHORT positions and trends. For this, you must set an alert in alert tab and set the condition based on four defaults conditions.
Enjoy

Bollinger Bands With User Selectable MABollinger Bands with user selection options to calculate the moving average basis and bands from a variety of different moving averages.
The user selects their choice of moving average, and the bands automatically adjust. The user may select a MA that reacts faster to volatility or slower/smoother.
Added additional options to color the bands or basis based on the current trend and alternate candle colors for band touches. Options:
REACT SLOW/SMOOTH TO VOLATILITY
simple moving average (Regular Bollinger Bands)
REACT SMOOTH TO VOLATILITY
exponential moving average (EMA Bollinger Bands)
weighted moving average (Weighted MA Bollinger Bands)
exponential hull moving average (Hull Bollinger Bands with better smoothing)
HIGHLY ADJUSTABLE TO VOLATILITY
Arnaud Legoux Moving average (ALMA Bollinger Bands)
Note: 0.85 ALMA default for more smoothing, set offset=1 to turn off smoothing
REACT HARSH TO VOLATILITY
least squares moving average (Least Squares Bollinger Bands)
REACT VERY FAST TO VOLATILITY
hull moving average (Hull Bollinger Bands or Hullinger Bands)
VALUE ADDED: This script is unique in that no other Bollinger Bands indicator offers a user selection for moving average, and some of the options do not exist yet as Bollinger Bands indicators.
Definitions:
Bollinger Bands: A Bollinger Band® is a technical analysis tool defined by a set of trendlines plotted two standard deviations (positively and negatively) away from a simple moving average (SMA) of a security's price, but which can be adjusted to user preferences.
Exponential Bollinger Bands: The most important characteristics of the Exponential Bollinger Bands indicator are: When the market is flat, the bands will stay much closer to prices. When the volatility is high, the bands move away from prices faster.
Hull Bollinger Bands: Bollinger Bands calculated by Hull moving average, rather than simple moving average or ema. The Hull Moving Average (HMA), developed by Alan Hull, is an extremely fast and smooth moving average. In fact, the HMA almost eliminates lag altogether and manages to improve smoothing at the same time.
Exponential Hull Bollinger Bands: Bollinger Bands calculated by Exponential Hull moving average, rather than simple moving average or ema. The Exponential Hull Moving Average is similar to the standard Hull MA, but with superior smoothing. The standard Hull Moving Average is derived from the weighted moving average (WMA). As other moving average built from weighted moving averages it has a tendency to exaggerate price movement.
Weighted Moving Average Bollinger Bands: A Weighted Moving Average (WMA) is similar to the simple moving average (SMA), except the WMA adds significance to more recent data points.
Arnaud Legoux Moving Average Bollinger Bands: ALMA removes small price fluctuations and enhances the trend by applying a moving average twice, once from left to right, and once from right to left. At the end of this process the phase shift (price lag) commonly associated with moving averages is significantly reduced. Zero-phase digital filtering reduces noise in the signal. Conventional filtering reduces noise in the signal, but adds a delay.
Least Squares Bollinger Bands: The indicator is based on sum of least squares method to find a straight line that best fits data for the selected period. The end point of the line is plotted and the process is repeated on each succeeding period.

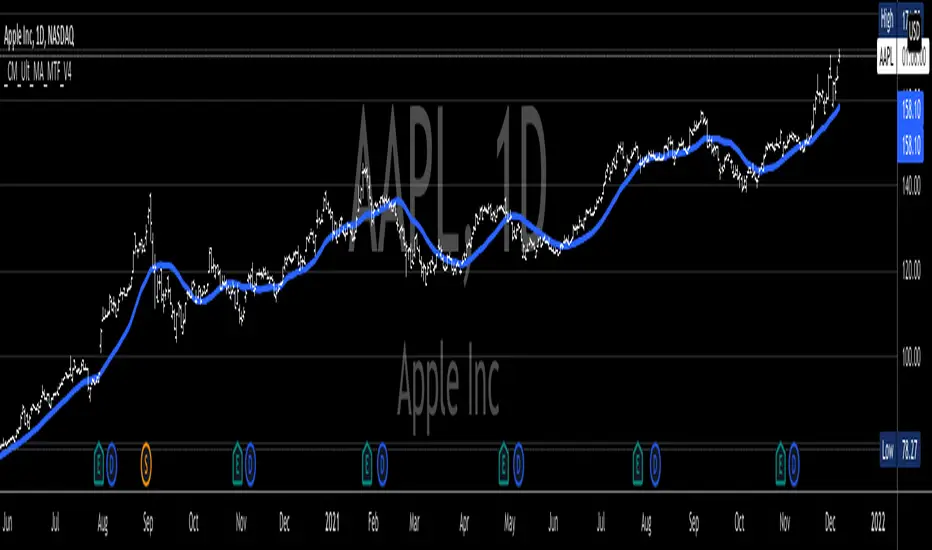
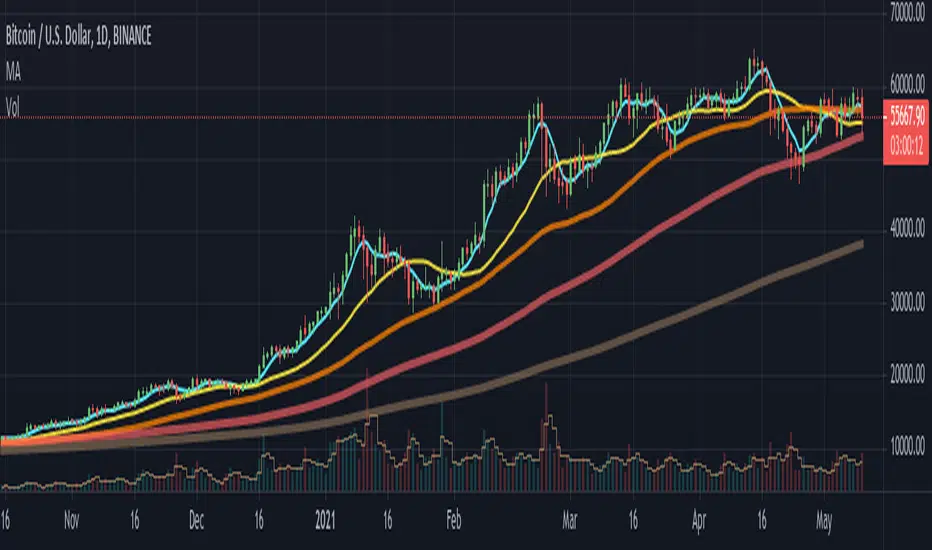
_CM_Ultimate_MA_MTF_V4***For a Detailed Video Overview Showing all of the Settings...
Click HERE to View Video
New _CM_Ultimate_MA_MTF_V4 - Update - 08-24-2021
Thanks to @SKTennis for help with code
Added Ability to Plot 1 or 2 Moving Averages - Fast MA & Slow MA
Added Ability to Plot Fast MA with Multi TimeFrame
Added Ability to Plot Slow MA with Multi TimeFrame
Added Ability to Color Fast MA Based on Slope of MA
Added Ability to Color Fast MA based on being Above/Below Slow MA
Added Ability to Plot 8 Types of Moving Averages
Simple, Exponential, Weighted, Hull, VWMA, RMA, TEMA, & Tilson T3
Added Ability to Set Alerts Based on:
Slope Change in the Fast MA Or Fast MA Crossing Above/Below Slow MA.
Added Ability to Plot "Fill" if Both Moving Averages are Turned ON
Added Ability to control Transparency of Fill
Added Alerts to Settings Pane.
Customized how Alerts work. Must keep Checked in Settings Pane, and When you go to Alerts Panel, Change Symbol to Indicator (_CM_Ultimate_MA_MTF_V4)
Customized Alerts to Show Symbol, TimeFrame, Closing Price, & Moving Average Signal Name in Alert
Alerts are Pre-Set to only Alert on Bar Close
See Video for Detailed Overview
New Updates Coming Soon!!!
***Please Post Feedback and Any Feature Requests in the Comments Section Below***
TFi Simple Moving Average Bot V1 - PUBLICThe bot is using 2 moving averages for detecting the trend; the type of moving average is configurable; if the 2 moving averages are crossing it enters a long or short position. A stop-loss and profit-target can be configured; if reaching the profit-target, the bot is closing 50% (configurable) of the position, from this time on it is using a trailing-stop to close the position if the trailing-stop has been crossed.
The following moving-averages can be configured:
DEMA
EMA
HMA
RMA
SMA
TEMA
VWMA
WMA
Overview of features:
Optional stop-loss and profit-target/trailing-stop
Built-in backtesting engine with start balance, position size and pyramiding; each year will be evaluated separately
Inputs for a percentage entry and exit slippage, entry/exit and daily funding fees
Configurable alerts, which follow the exact position of the entry/exit marker
Alert messages contain predefined trading instruction to execute orders via TradeFab's proprietary trading server, which supports Alpaca-Markets, TD Ameritrade, Oanda, CCXT API's, or can be defined by the user
The script renders a performance/status table, which shows the current position status and result of the built-in trading simulation results. The following statistics are shown:
Current position PnL - also background turns green if position is in profit and red if in loss
Average entry price and number of positions
Current percentage distance to the optional stop-loss level
Current Maximum Draw Down
Number of wins and losses and the win/loss ratio per year and overall
Profit and loss amount, paid fees per year and overall
Profit-ratio and Maximum Draw Down per year and overall
Balance and ROI per year and overall

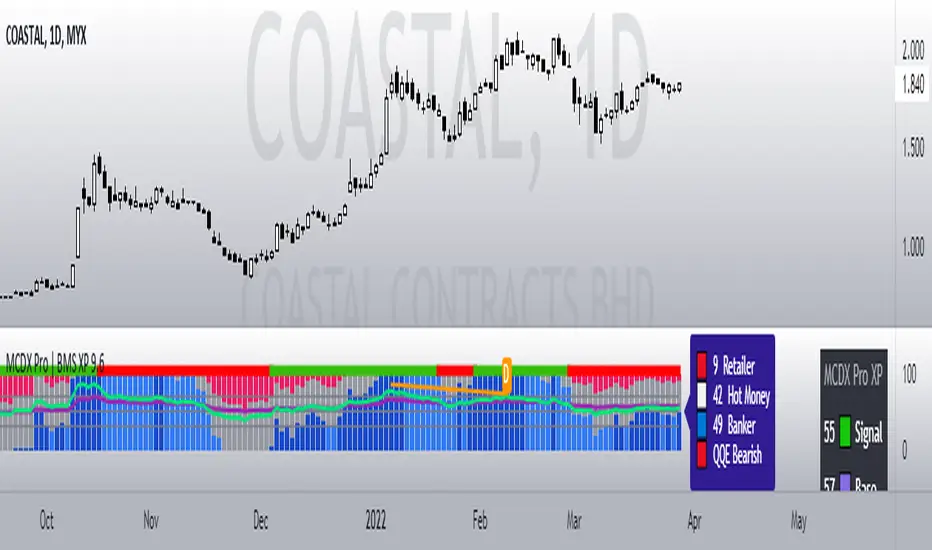
MCDX Pro+ | BMSPublished 10 June 2021
MCDX Pro+ | BMS
Bull Momentum System Pro
Use this indicators with other BMS indicators.
(Smart Power / MC Pro++ / SMI Pro+)
How to use:
This indicator detects Banker volume.
Green Bars = Retailer ( Bearish / Downtrend)
Gray Bars = Hot Money (Sideways / FIFO)
Red Bars = Banker Smart Money ( Bullish Uptrend)
Pink Bars = Weak Banker (Pullback / Unloading / Technical Rebound)
Blue line = FIFO entry
- Blue line is a fast signal to enter when there is no banker yet.
- Good for BTST / FIFO trade.
- If Blue Line is up too strong a fast pullback may happen
- Yellow line = Bearish (pullback)
- Blue line up together with Red bars means strong bullish.
Overbought / Oversold symbol:
Orange Circle = Overbought / Possible very strong bull
Blue Circle = Oversold / Possible bottom catch / Rebound
Banker levels and Rocket symbol:
Level 0% = No Banker show 0 Rocket
Level 25% = Banker step-in show 1 Rocket
Level 50% = Banker build position show 2 Rocket
Level 75% = Banker takes control show 3 Rocket
Level 100% = Banker overbought show 4 Rocket
Best entry when position is Oversold and Red Banker step-in
and build-up position more than 50% level.
Take profit when Overbought, Pink Bars (banker unloading) and
Blue line turns Yellow line.
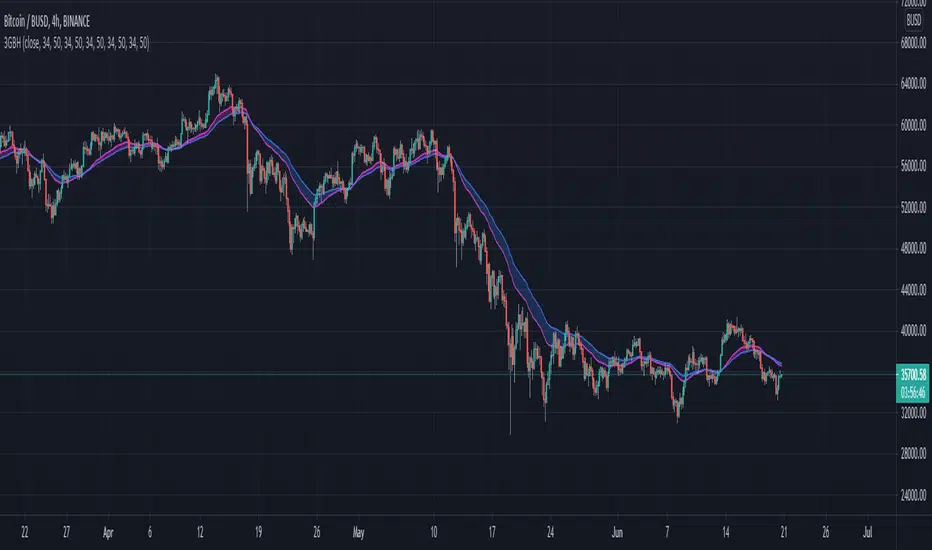
3GBH - Multiple MA'sIncluded in this indicator:
- Fast/Slow EMA's
- Fast/Slow SMA's
- Fast/Slow WMA's
- Fast/Slow HMA's
- Fast/Slow RMA's
-----
Use of of the type of Moving Averages.
Or use them all.
-----
User-friendly.
You can change all the inputs, they are labelled for ease-of-use.
You can toggle On/Off any or all of the options.
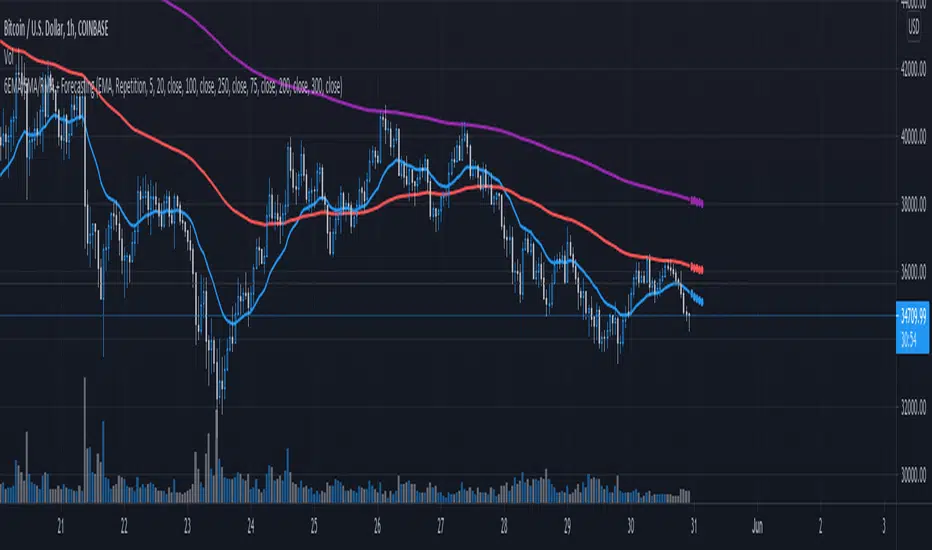
6 EMA SMA RMA + ForecastingDescription:
Hey hi, this Script is a bit simple. Let's start with some definitions.
Moving Average (MA)
In statistics, a moving average is a calculation used to analyze data points by creating a series of averages of different subsets of the full data set. In finance, a moving average (MA) is a stock indicator that is commonly used in technical analysis . The reason for calculating the moving average of a stock is to help smooth out the price data by creating a constantly updated average price . This makes this tool one of the most important for technical analysis .
Forecasting
Forecasting is the process of making predictions based on past and present data and most commonly by analysis of trends . In the same way that the moving average (MA) the forecasting is something highly desirable, in this way we opted to develop an indicator that allows the use of up to 6 moving averages combined with the forecasting.
In addition to having the option of up to 6 moving averages, these can be of different types, being able to choose between up to 3 options (it is proposed to add more options later) which are listed below.
Exponential Moving Average ( EMA )
Simple Moving Average ( SMA )
Running Moving Average (RMA)
In addition to the above, 2 prediction methods were added, which are listed and detailed below.
Repetition. Makes forecast repeating the last candle M times.
Linear Regression ( LR ). Linear Regression does N period LR forecast averaged with length-N Moving Average
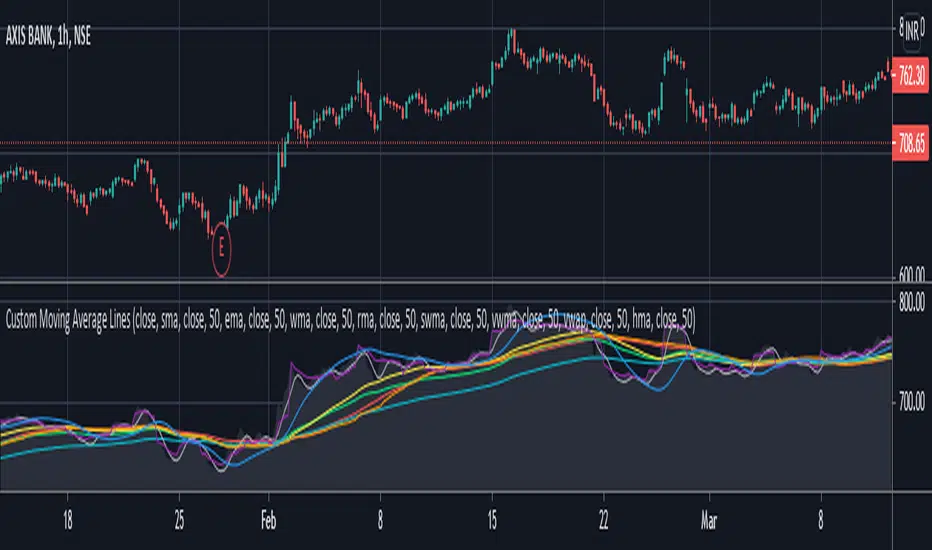
Custom Moving Average LinesHeylo!
This is a script for basic market trend analysis using moving average lines. It features eight lines with eight choices of moving averages and adjustable sources & time periods . The choice of moving averages are stated below:
1. Simple Moving Average (sma)
2. Exponential Moving Average (ema)
3. Weighted Moving Average (wma)
4. Relative Moving Average (rma)
5. Hull Moving Average (hma)
6. Sine-Weighted Moving Average (swma)
7. Volume Weighted Moving Average (vwma)
8. Volume Weighted Average Price (vwap)
Planning on including other formula based indicators soon. Let me know if there can be some improvements made / errors so I can fix it.
Cheers!
Customizable MA RibbonAll credits to @Violent (www.tradingview.com) for making the original code! I just updated it by adding new features and themes!
---------------------------------------------
Lemon's Customizable MA Ribbon:
---------------------------------------------
A series of moving averages of different lengths that create a ribbon-like indicator. Traders can determine trend strength by lookin at the distance between the moving averages and the overall balance of the colored lines. Price movements through the ribbon can also be used to identify trend changes.
------------
FEATURES
------------
MA TYPES: SMA , EMA , WMA, RMA, ALMA, VWMA, HMA
Editable length
Editable start
User defined number of plots to show (between 1 to 32 total plots)
Multiple color theme choices
A color smoothing option.
Thank you and happy trading!
with love,
-Lemon

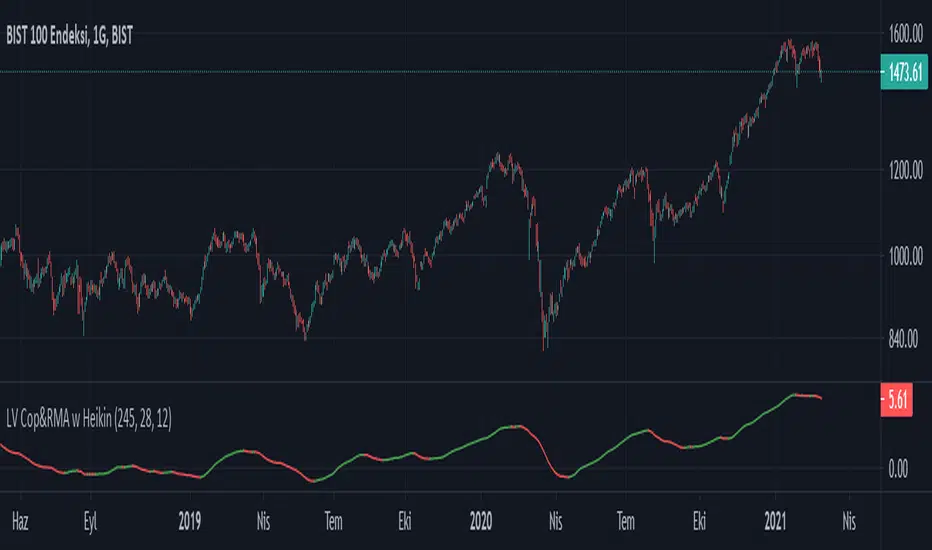
LV Cop&RMA w HeikinA buy signal is generated when the indicator turns upwards from previous indicator level.
A sell signal is generated when the indicator turns downwards from previous indicator level.
The indicator is trend-following, and based on averages, so by its nature it doesn't pick a bottom, but rather shows when a rally has started.
It is designed for daily period use.
Frequent buy/sell signals can occur on low and high levels.
It is designed with the mentality of Coppock curve. Rma is used instead of Wma and Heikin-Ashi closing price is used instead of standard closing price.
LV Support&Resistancegives rough predictions on support and resistance levels by using rma and fibo numbers.
white color is the original rma250 value.
(Note: it is more easy to see them on logarithmic scale)

Customisable Moving Averages x5This is a Moving Averages pack with 5 lines.
This indicator is different from others because with it you can select the MA type used in calculations for each line.
Available MA types are (currently):
SMA
EMA
WMA
VWMA
RMA
HMA
Also configurable (for each line) are data source (open, close, hlc3, etc) and period.
MA, MATR, ChEx | All in One - 4CR CUPIn trade position setup, we always need to determine the market structure and manage the position sizing in a short period of decision time. Indicators such as moving average, initial stop loss and trailing stop loss are always helpful.
This indicator put all these handy tools into a single toolkit, which includes the following price action and risk management indicators:
MA - Moving Average
MATR - Moving Average less Average True Range
ChEx - Chandelier Exit
This script further enhances the setting so that you can easily customize the indicators.
For both the Moving Averages and the Moving Average less Average True Range , you can pick a type of moving average which suits your analysis style from a list of commonly used moving average formulations: namely, EMA , HMA , RMA, SMA and WMA , where EMA is selected as default.
The Moving Average less Average True Range , MATR, is usually applied as a reference to set the initial stop loss whenever opening a new position.
The abbreviation, MATR, is picked, so that this can serve as a handy reminder of a very good trading framework as elaborates as below:
M – Market Structure
A – Area of Value
T – Trigger
R – Risk Management (aka. Exit Strategy)

Multi Timeframe Moving Average [xdecow]This indicator plots a moving average of 4 different timeframes.
The types of averages available are: SMA, EMA, DEMA, VWMA, RMA, WMA.

OBV_RMA_CRYPTO Buy and Hold Destroyer free versionThis is a free version which use part of the logic that I am applying on my destroyer/annihilation series of strategies.
This version its made for 8-12h and works amazingly on the ETH pairs. Can be adapted to others as well
For this example, I used an initial 1$ account, using always full capital on each trade(without using any leverage), together with a 0.1% commission/fees for each deal, on Coinbase broker.
For risk management, we have a hard stop loss on the equity of 25%.
The components for the inside of the strategy are the next one :
1. OBV- SoftKill Version adapted to cryptos
2. ATR - SoftKill Version adapted to cryptos
3. RMA Rolling moving average
The rules here are simple we check for the trend direction with ATR and then we check for cross up or above on OBV and RMA moving average. Based on this we enter long or short.
RISK WARNING
Trading on any financial market involves a risk of loss. Please consider carefully if such trading is appropriate for you. Past performance is not indicative of future results.
If you have any questions or you are interested in trying it, private message me and I will give you as soon as I see the message a trial for it.

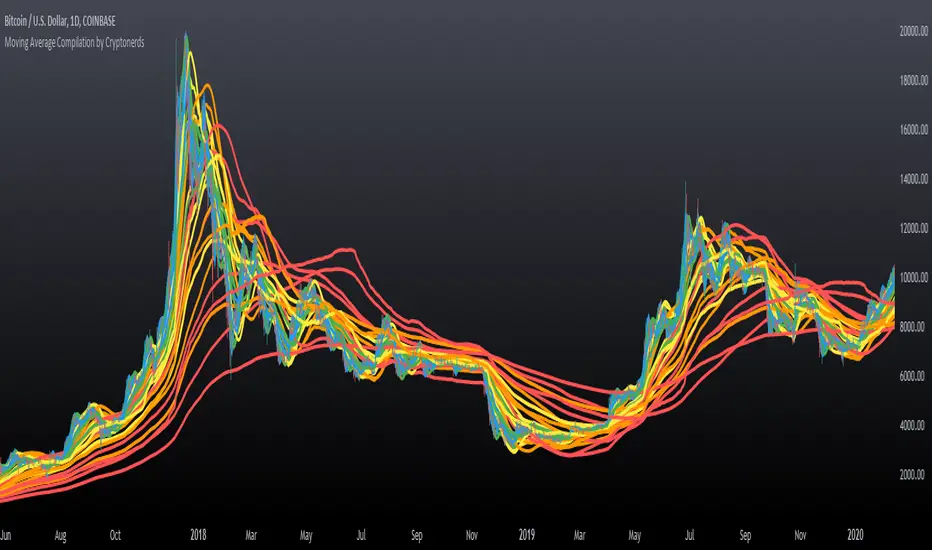
Moving Average Compilation by CryptonerdsThis script contains all commonly used types of moving averages in a single script. To our surprise, it turned out that there was no script available yet that contains multiple types of moving averages.
The following types of moving averages are included:
Simple Moving Averages (SMA)
Exponential Moving Averages (EMA)
Double Exponential Moving Averages (DEMA)
Display Triple Exponential Moving Averages (TEMA)
Display Weighted Moving Averages (WMA)
Display Hull Moving Averages (HMA)
Wilder's exponential moving averages (RMA)
Volume-Weighted Moving Averages (VWMA)
The user can configure what type of moving averages are displayed, including the length and up to five multiple moving averages per type. If you have any other request related to adding moving averages, please leave a comment in the section below.
If you've learned something new and found value, leave us a message to show your support!
MAVC: Moving Averages Combo by Mehmet YildizliMAVC: Moving Averages Combo by Mehmet Yildizli
==========================================
You can use this indicator to add more than one moving average on the same chart. At the beginning of the indicator settings, the "Volume For Tillson" parameter is used only when you select the Tillson moving average.
When you check the "Use (high + low + 2 * close) / 4" checkbox, this value is used as the source data to be included in the calculations of all moving averages. When you clear this check box, calculations are made according to the selection you make in the SOURCE section.
You can add 4 moving averages at the same time to the chart.
You can choose a different period and a different calculation method for each moving average.
In this way, you can make a buying / selling decision by considering the relative positions of more than one moving average.
The risks you may be exposed to as a result of your transactions will be entirely at your own risk, as the buy / sell signals you will receive through this indicator will be revealed by your interpretation of the curves that will emerge according to the parameters and calculation methods you choose.
Moving Average Calculation Methods:
1. "S: Simple": Simple Moving Average (SMA)
2. "E: Exponential": Exponential Moving Average (EMA)
3. "DE: Double Exponential": Double Exponential Moving Average (DEMA)
4. "W: Weighted": Weighted Moving Average (WMA)
5. "VIDYA 1: VIDYA via St Dev": Variable Index Dynamic Average - by standard deviation (VIDYA)
6. "VIDYA 2: VIDYA via CMO": Variable Index Dynamic Average - via CMO (VIDYA)
7. "T: Tillson": Tillson - T3
8. "RMA: Running Mov Av": Running Moving Average (RMA)
Hope you will benefit from the indicator.
TÜRKÇE AÇIKLAMA
=================
MAVC: Moving Averages Combo by Mehmet Yildizli
==========================================
Bu indikatör ile birden fazla hareketli ortalamayı aynı grafik üzerine ekleyebilirsiniz. İndikatör ayarlarının başında, "Volume For Tillson" parametresi sadece Tillson hareketli ortalama seçimi yaptığınız zaman kullanılmaktadır.
"Use (high+low+2*close)/4" onay kutusunu onayladığınızda ise, bütün hareketli ortalamaların hesaplamalarına dahil edilecek kaynak veri olarak bu değer kullanılır. Bu onay kutusundaki onayı kaldırdığınızda ise KAYNAK kısmında yapacağınız seçime göre hesaplamalar yapılır.
Aynı anda 4 hareketli ortalamayı grafiğe ekleyebilirsiniz.
Her hareketli ortalama için farklı bir periyot ve farklı bir hesaplama yöntemi seçimi yapabilirsiniz.
Bu şekilde birden fazla hareketli ortalamanın birbirine göre durumlarını dikkate alarak alış/satış kararı verebilirsiniz.
Bu indikatör yoluyla alacağınız alış/satış sinyalleri, tamamen sizin belirleyeceğiniz parametre ve seçtiğiniz hesaplama yöntemlerine göre ortaya çıkacak eğrilerin sizin tarafınızdan yorumlanarak ortaya çıkacağı için işlemleriniz sonucunda maruz kalabileceğiniz riskler tamamen size ait olacaktır.
Hareketli Ortalama Hesaplama Yöntemleri:
1. "S:Simple" : Basit Hareketli Ortalama (SMA)
2. "E:Exponential" :Üstel Hareketli Ortalama (EMA)
3. "DE:Double Exponential": İkili Üstel Hareketli Ortalama (DEMA)
4. "W:Weighted": Ağırlıklı Hareketli Ortalama (WMA)
5. "VIDYA 1: VIDYA via St Dev": Değişken Hareketli Ortalama - standart sapma yoluyla (VIDYA)
6. "VIDYA 2: VIDYA via CMO": Değişken Hareketli Ortalama - CMO yoluyla (VIDYA)
7. "T:Tillson": Tillson - T3
8. "RMA:Running Mov Av": Running Moving Average (RMA)
İndikatörden faydalanmanız dileğiyle.
