Combo Backtest 123 Reversal & RSI based on ROC This is combo strategies for get a cumulative signal.
First strategy
This System was created from the Book "How I Tripled My Money In The
Futures Market" by Ulf Jensen, Page 183. This is reverse type of strategies.
The strategy buys at market, if close price is higher than the previous close
during 2 days and the meaning of 9-days Stochastic Slow Oscillator is lower than 50.
The strategy sells at market, if close price is lower than the previous close price
during 2 days and the meaning of 9-days Stochastic Fast Oscillator is higher than 50.
Second strategy
This is the new-age indicator which is version of RSI calculated upon
the Rate-of-change indicator.
The name "Relative Strength Index" is slightly misleading as the RSI
does not compare the relative strength of two securities, but rather
the internal strength of a single security. A more appropriate name
might be "Internal Strength Index." Relative strength charts that compare
two market indices, which are often referred to as Comparative Relative Strength.
And in its turn, the Rate-of-Change ("ROC") indicator displays the difference
between the current price and the price x-time periods ago. The difference can
be displayed in either points or as a percentage. The Momentum indicator displays
the same information, but expresses it as a ratio.
WARNING:
- For purpose educate only
- This script to change bars colors.
ROC

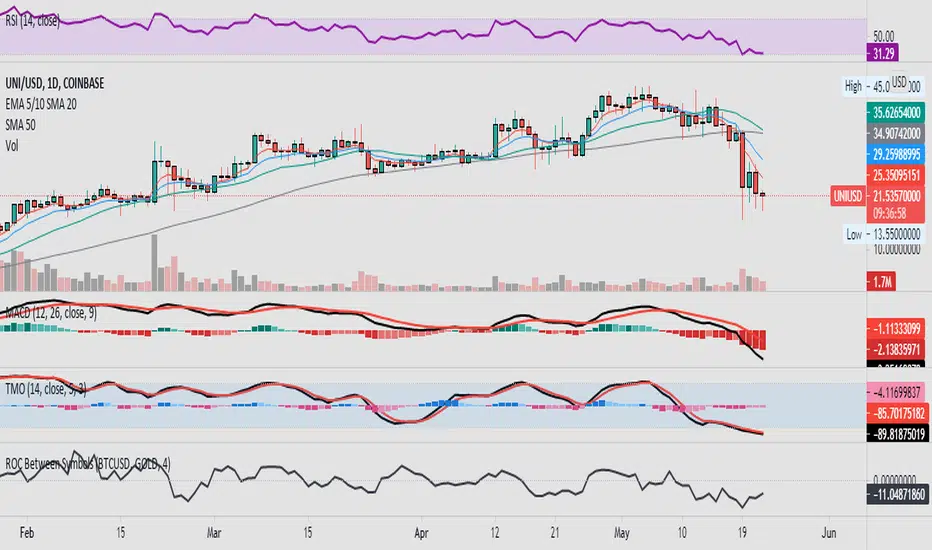
ROC Between SymbolsThis script is a simple Rate Of Change (ROC) closing price comparison between a "compare" symbol and a "base" symbol over a user-specified period (maximum 200).
When the ROC is greater than zero, >0 (positive), the compare symbol is increasing faster than the base symbol -- the compare symbol has positive comparative momentum. Of course, your compare symbol could be flat and your base symbol could be decreasing, but math-wise these scenarios are equivalent and the compare symbol has positive comparative momentum.
When the ROC is less than zero, <0 (negative), the compare symbol has negative comparative momentum. Again, the base symbol could be increasing and the compare symbol could be flat, but math-wise this is the same scenario and the compare symbol has negative comparative momentum.
This ROC comparison tactic was documented and described on YouTube channel "Figuring Out Money" in an interesting study between Bitcoin and Gold prices on a weekly timeframe.
Rate Of Change Bands [CC]The Rate Of Change Bands were created by Vitali Apirine (Stocks and Commodities March 2021 pg 14) and this indicator is a great method to not only check the momentum but also check the trend strength as well. I have color coded the lines so buy when the line turns green and sell when it turns red.
Let me know if there are any other indicators you want me to publish!

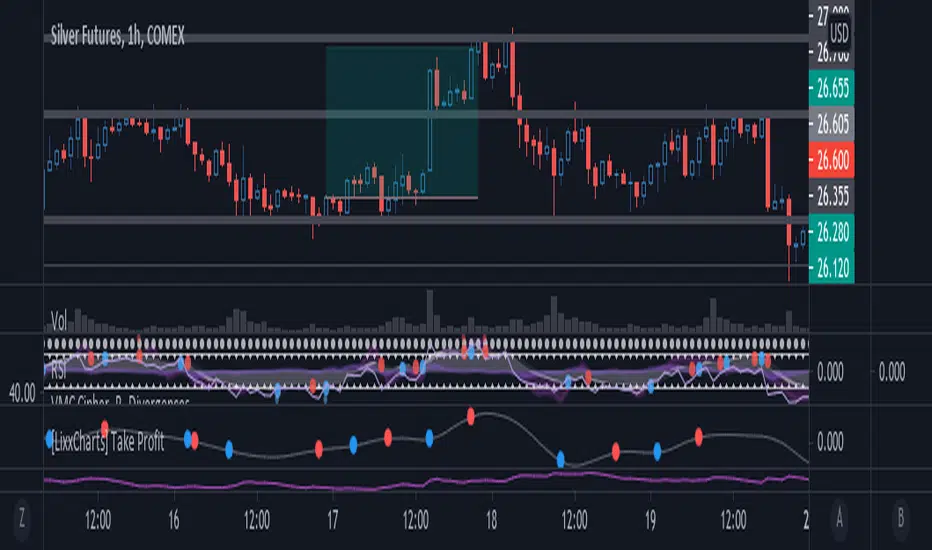
[Lixx] MESA(EMA/SMA) and ROC(ROC/MESA) Take Profit TriggersThis script uses the MESA EMA and SMA as well as the ROC/MESA cross to help find the take profit areas when trading divergences using market cipher or wavetrend. It is inspired by jordanfungs MESA indicator, however this one is different because it is not lagging in the signals.
Hope you enjoy it, and make sure to backtest any strategy before you use it.
RedK_Relative (Dual) Rate Of Change v1 - RROC v1Quick Summary
==============
The Relative Rate of Change (RRoC) is an expanded version of the classic Rate of Change (RoC) indicator - we apply couple of changes to bring additional insights and signals from that classic Technical Analysis concept - which can help us better visualize the "relative speed of change" of a stock (or whatever we trade), and can work specifically as a "breakout finder" .. please read on if this can be valuable to your trading.
First, a quick review of what is the classic Rate of Change (RoC) - The below part is from Investopedia definition of RoC
-----------------------------------------------------------------------------------
www.investopedia.com
What is Rate of Change (ROC)
The rate of change (ROC) is the speed at which a variable changes over a specific period of time.
ROC is often used when speaking about momentum, and it can generally be expressed as a ratio between a change in one variable relative to a corresponding change in another; graphically, the rate of change is represented by the slope of a line.
Understanding Rate of Change (ROC)
Rate of change is used to mathematically describe the percentage change in value over a defined period of time, and it represents the momentum of a variable .
The calculation for ROC is simple in that it takes the current value of a stock or index and divides it by the value from an earlier period.
Subtract one and multiply the resulting number by 100 to give it a percentage representation.
ROC = (current value / previous value - 1) * 100
-------------------------------------------------------------------------------------------------
What changes did we make to the RoC?
====================================
(1) - Per the official definition, the original RoC should provide a "rate of change" - i.e., we should say "the 5-bar average price change for AAPL is x% per bar" - now norice that the formula doesn't divide by the number of bars (length) -- so the reality is, the results is more of "the 5-bar price change for apple is x% for the full 5 bar length"
- what is wrong with that ? nothing really, but it's harder to use that number to set my trade target or exit. i need the indicator to give me a number that represents the "average change per bar" so i can use it to "design my trade target and my exit loss" -- so in the RRoC, we divide the change by the number of bars used in the settings
The updated formula would be : RoC = (current value / previous value -1 ) * 100 / length
(2) - Dual Length: we make the RoC relative, by adding a longer (or slow) RoC
- the idea here is simple - imagine you're driving your car beside a moving train, your car will not "breakout" from the train until your speed (= distance gain per unit of time) is faster than the train - so in reality, your baseline is not 0 speed, it's the speed of that train your racing against -- makes sense?
- so we add a second length that can act as a baseline - when the Fast RoC exceeds the Slow RoC (your car is faster than the train), a breakout would possibly occur - that breakout may fail (if something interrupts it - my car may breakdown if it can't handle the faster speed :) ) or it can fully materialize if the "context" is favorable.
as we can see on the above chart, we can use the RRoC to identify an incoming possible breakout using that simple "relative speed" concept - and that setup happened not once but twice in our example
the interpretation of this for AAPL would be (for example): "AAPL has been making an average change of 0.22% in the past 20 days, but for the last 5 days, the average change was 0.35% - so it looks like AAPL is gaining short term momentum and may break-out soon"
(3) this is another strong feature: Use for broader context:
- we can set the RRoC for a resolution of - for example - a day, while we look at the 1 hour chart - giving us the ability to trade on a smaller timeframe in the context of a larger timeframe .. this is more of an advanced feature but i hope some will be able to leverage it.
Here's a side-by-side comparison of RRoC vs the classic (built-in) RoC indicator
Conclusion:
============
- The (Relative Rate of Change) RRoC expands on the concepts presented by the classic Rate of Change (RoC) indicator and enables additional insights - especially around the discovery of potential price breakout
- leverage the RRoC indicator settings to tweak it to how your trade (fast length, slow length, resolution, smoothing). the defaults should work for any instrument but may not necessarily be the optimal settings
- use in conjunction with other indicators that can show trend and prevailing sentiment / context - to ensure you get proper confirmation and please get very familiar with how the RRoC works before you use it for live trading.
Comments are welcome - Best of luck
-

Roc & Atr
Roc & Atr Orders
My indicator, where I compare the 20 bar change percentage with the 14 bar atr band, I hope it will be useful to everyone. the green zones can be interpreted as BUY and the red zone as SELL zone. In graphs with high motion and low atr, the channel narrowing can be interpreted as BUY and the channel opening as SELL.
No indicator shows you the right way ... The best way is your own thoughts

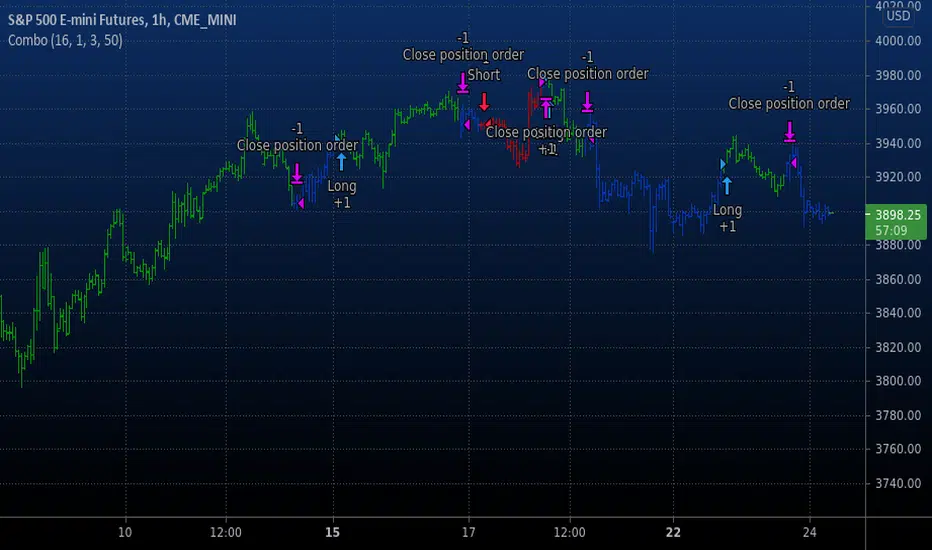
Combo Backtest 123 Reversal & MovROC (KST indicator) This is combo strategies for get a cumulative signal.
First strategy
This System was created from the Book "How I Tripled My Money In The
Futures Market" by Ulf Jensen, Page 183. This is reverse type of strategies.
The strategy buys at market, if close price is higher than the previous close
during 2 days and the meaning of 9-days Stochastic Slow Oscillator is lower than 50.
The strategy sells at market, if close price is lower than the previous close price
during 2 days and the meaning of 9-days Stochastic Fast Oscillator is higher than 50.
Second strategy
This indicator really is the KST indicator presented by Martin Pring.
the KST indicator is a weighted summed rate of change oscillator that
is designed to identify meaningful turns. Various smoothed rate of change
indicators can be combined to form different measurements of cycles.
WARNING:
- For purpose educate only
- This script to change bars colors.
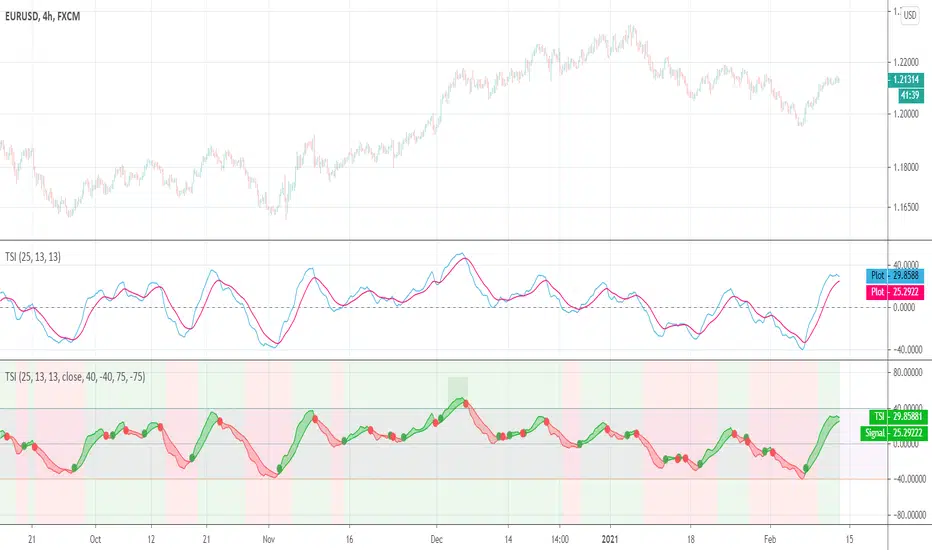
True Strength Index (TSI)User request. A tuned version of the built-in True Strength Index (TSI) indicator with the following options included:
TSI - Signal Histogram
TSI/Signal Crossovers
TSI/Signal Ribbon
Bands breakouts highlighting
Zero line crossovers background
RS.ROC | Relative Strength - Rate of Changes - 4CR CUPFor completeness of Relative Strength studies, the Relative Strength based on rate of changes (ROC) with weighting is coded and presented as well.
The RS.ROC is similar to the formulation of RS by IBD before rank among all the stocks in the market.
The lookback period is relaxed for customizing. Once you set the total lookback period, representing the 4Q, in the indicator, the other shorter lookback periods will be auto-calculated, namely, 1Q, 2Q, 3Q.
A simple moving average of the RS.ROC is also added for your easier analysis on the trend development of the strength.
To use it later at your charting later,
1. Favorite it;
2. Select from your favorite list.

MA Streak Change ChannelChange Channel is like KC unless it uses percentage changes in price to set channel distance. Midline is zero-lag smoothed ROC with dynamic period based on MA Streak indicator, if MA Streak shows an ongoing trend, midline going strong and break out the channel.
Consider using ▲ green areas as a signal to buy and ▼ red areas as a sell signal. It works best in a flat market. Use in combination with other indicators.

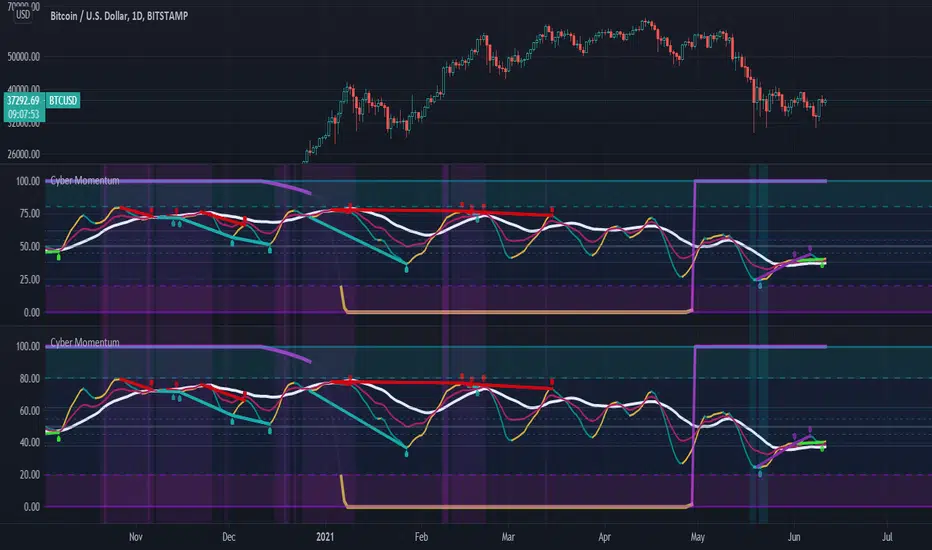
Cyber MomentumThis oscillator is the combination of different settings RSI , RSX , STOCHRSI , MSI ,... in a Stochastic function that can help traders to understand the weakness and strength of momentum in candle sticks in different time frames.
This oscillator organized by three Line , control zone and Divergence Line
1:) Fast Line
2:) Slow Line
3:) Heavy Line
4:) Neutral Zone between Fibo 38.2% & 61.8%
5:) Bullish Control Zone
6:) Bearish Control Zone
7:) Divergence Line
And there are two theories of finding tradable signals behind those parts .
The first and the most simplest theory is the situation that the Fast Line has the possibility to be supported by Slow or Heavy Lines and basically reverse its slope !!
But there are some rules and notes for this theory ... First of all the accuracy and rate of that is variable in three main categories of situation
1:) with or without price action reversal structure like reversal pattern (Head&Shoulder , Quasimodo , .... )
2:) with or without regular divergence
3:) in which control zone ?
So basically the most powerful setup occurs when price action is already in the reversal structure and the potential to have at least one drive of regular divergence exist and also the Fast Line is in the opposite control zone of the current time frame trend .... so obviously if one of those rules will not be satisfied so the signal will be the less value
The second theory is the signals that occur after the reversal, obviously a sign of trend continuation. there are two type of that you can use with this oscillator
The first one happens when price reverses its trend and this oscillator is moving to the neutral zone ... so if at least one drive of hidden divergence exist the neutral zone will have good possibility to reverse the slope of the oscillator obviously this would happen usually after hidden divergence confirmed .
and the second one is basically the first type but after the reversal Subsequently in the outside of the bullish/bearish control zone ... those kinds of signals are NOT the reversal potency signal at all !! they designed for trend continuation... be careful of them and try trade with your old friend trend ! .... also The existence of hidden divergences will be better for trade in this kind of signals .
The idea of this oscillator was inspired by @mrhashem Borjas Tarh Momentum.
Yogesh_SignalThis signal is to be plotted on the underlying symbol for which options can be sold for the the same.
If signal line is raised with green color that means I can sell put options with proper hedging so that I will not loose more that 3% of my capital.
Until the horizontal zero line is green one can stay in the position with bullish bias. If it turns red then one should exit position, and re-enter again if zero line becomes green
If signal line is raised with red color that means I can sell call options with proper hedging so that I will not loose more that 3% of my capital.
Until the horizontal zero line is redone can stay in the position with bearish bias. If it turns green then one should exit position, and re-enter again if zero line becomes red
Please make sure you do not bet more than 3% of your capital. I am not suggesting anyone to trade based on my indicator. It's for guidance and not to instruct you. All trade decisions are solely your's
Thanks,
Yogesh

Indicator: Raschke Compase [xQT5]This is an indicator from a book "Street Smarts—High Probability Short Term Trading Strategies" by L. Raschke & L.Connors.
I made it in histogram style for more comfortable reading chart:
- green histogram is buy signal or buy opportunity;
- red histogram is sell signal or sell opportunity;
- gray histogram is forward moving from last signal.
Enjoy it!
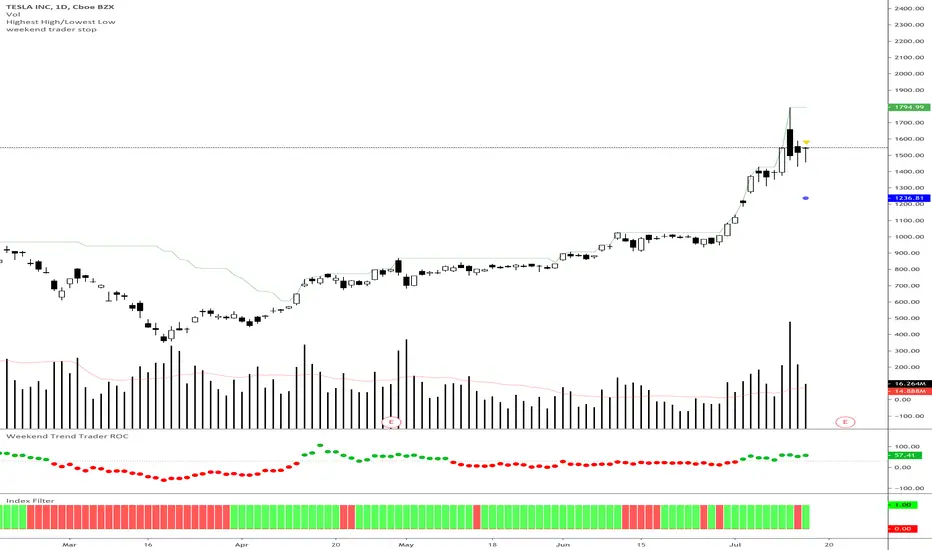
Weekend Trader Smoothed Rate of Change
Rate of change indicator based on Nick Radge's Weekend Trend Trader Strategy, with an added extra of EMA smoothing if you want it.
This indicator simply turns green when the rate of change is above a certain level (value is set in threshold)
Threshold is defaulted to 30 as outlined in the strategy rules
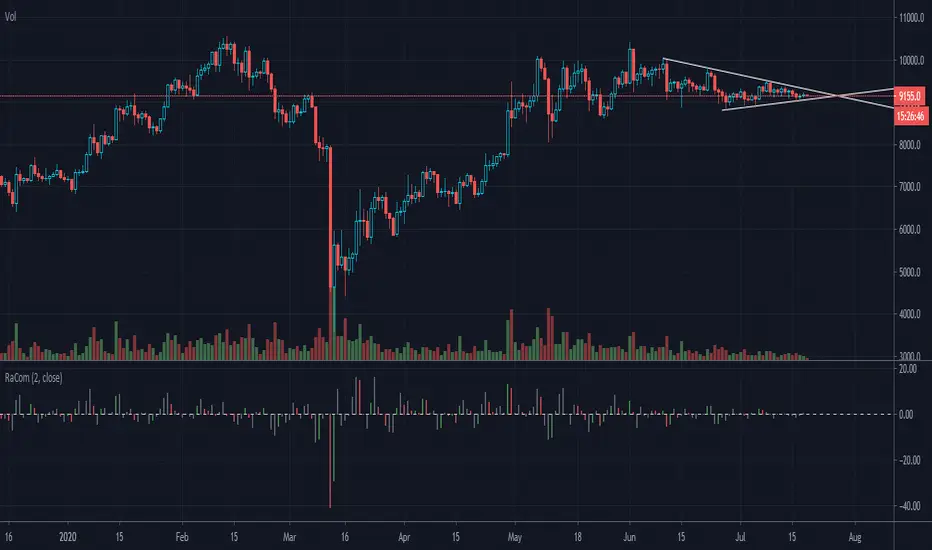
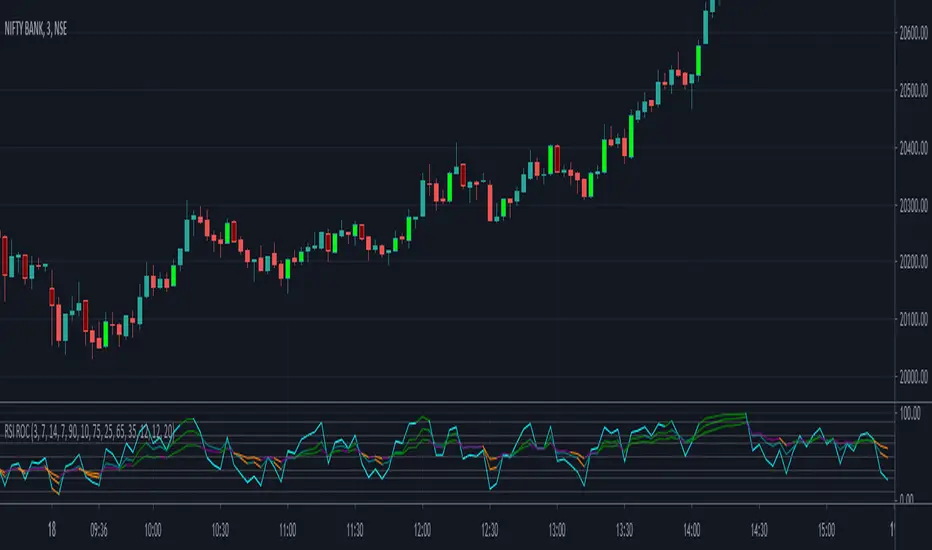
RSI - Rate of ChangeCode based on RSI lower value crossing over higher value
RSI Rate of Change of different lengths used in all parts of code
ADX and CCI use is limited in V1.0
Script provides 3 RSIs and overbrought and oversold for each of these RSIs. When RSI cross over each other clearly Buy and Sell signals are fired.
Lime is buy and Maroon means sell. Use it along with EMA
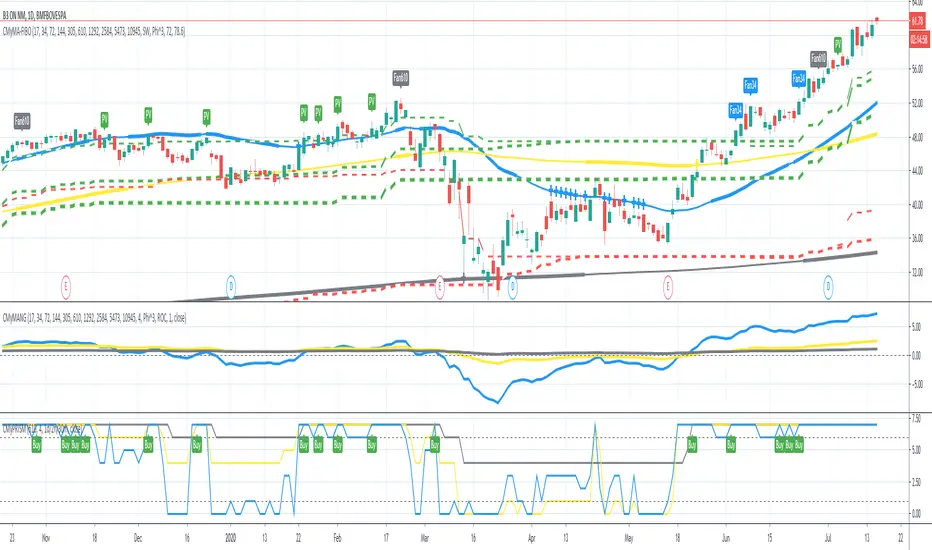
Super EMA PrismThis script implements the Binary Trade Logic (BTL) algorithm to calculate two distinct scores that range from 0 to 7. One score is calculated assigning a power of 2 weight to the positive sign of 3 Phi^3 distant Moving Average (MA) slopes. The other score is calculated assigning a power of 2 weight to the sign of the difference between the price and the value of 3 Phi^3 distant Moving Average (MA).
For the first score, hereafter called as the angle score (AS), the largest MA slope positive sign receives weight 4, the middle length MA slope positive sign receives weight 2 and the shortest MA slope positive sign receives weight 1. The positive sign of an MA is defined as 1 if the slope of the MA is positive and 0, otherwise. Therefore, for MAs 305, 72 and 17, if slope(MA305) > 0, slope(MA72) < 0 and slope(MA17) > 0, then score will be 4*1 + 2*0 + 1*1 = 5. Up to my knowledge, this score was first proposed by Bo Williams and named by him as Prisma.
For the second score, hereafter called as the value score (VS), if the price > largest MA, it receives weight 4. If the price > the middle length MA, it receives weight 2 and if the price > the the shortest MA, it receives weight 1. Therefore, for MAs 305, 72 and 17, if price < MA305, price > MA72 and price > MA17, then score will be 4*0 + 2*1 + 1*1 = 3. Up to my knowledge, this score was first proposed by Bo Williams and named by him as Prisma.
Both AS and VS are calculated for Phi^3 lengths (610, 144, 34) and for Phi^3/2 lengths (305, 72, 17). The scores of the same kind calculated for each set of length are combined multiplying the Phi^3 length score by 10 and adding with with the Phi^3/2 score, therefore providing a 2 digit score ranging from 0 to 77. For instance, if we have AS(610, 144, 34) = 7 and AS(305, 72, 17) = 5, we have AS=75. At the same time, if we have VS(610, 144, 34) = 6 and VS(305, 72, 17) = 4, we have VS=64.
VS score is plotted by default in black, but it can be on white for dark themes. AS is plotted with the color of the longest MA used.
Chart background is colored according to the range of values for AS and VS, checked in the following order:
if AS >= 13 and VS <= 13 then back color = red
if AS >= 13 or VS <= 13 then back color = orange
if AS >= 64 and VS >= 64 then back color = green
if AS >= 64 or VS >= 64 then back color = blue
otherwise back color = none (white o black)

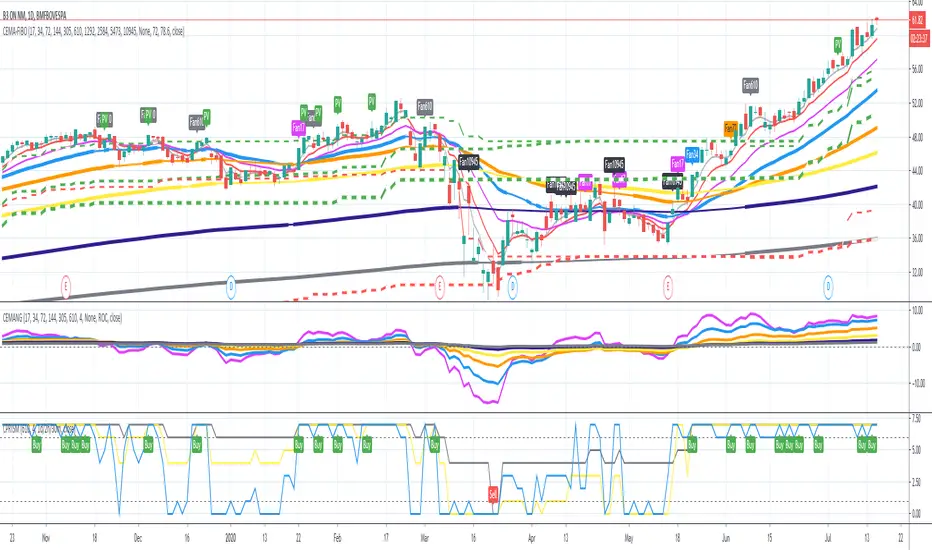
Super MyMA PrismThis script implements the Binary Trade Logic (BTL) algorithm to calculate two distinct scores that range from 0 to 7. One score is calculated assigning a power of 2 weight to the positive sign of 3 Phi^3 distant Moving Average (MA) slopes. The other score is calculated assigning a power of 2 weight to the sign of the difference between the price and the value of 3 Phi^3 distant Moving Average (MA).
For the first score, hereafter called as the angle score (AS), the largest MA slope positive sign receives weight 4, the middle length MA slope positive sign receives weight 2 and the shortest MA slope positive sign receives weight 1. The positive sign of an MA is defined as 1 if the slope of the MA is positive and 0, otherwise. Therefore, for MAs 305, 72 and 17, if slope(MA305) > 0, slope(MA72) < 0 and slope(MA17) > 0, then score will be 4*1 + 2*0 + 1*1 = 5. Up to my knowledge, this score was first proposed by Bo Williams and named by him as Prisma.
For the second score, hereafter called as the value score (VS), if the price > largest MA, it receives weight 4. If the price > the middle length MA, it receives weight 2 and if the price > the the shortest MA, it receives weight 1. Therefore, for MAs 305, 72 and 17, if price < MA305, price > MA72 and price > MA17, then score will be 4*0 + 2*1 + 1*1 = 3. Up to my knowledge, this score was first proposed by Bo Williams and named by him as Prisma.
Both AS and VS are calculated for Phi^3 lengths (610, 144, 34) and for Phi^3/2 lengths (305, 72, 17). The scores of the same kind calculated for each set of length are combined multiplying the Phi^3 length score by 10 and adding with with the Phi^3/2 score, therefore providing a 2 digit score ranging from 0 to 77. For instance, if we have AS(610, 144, 34) = 7 and AS(305, 72, 17) = 5, we have AS=75. At the same time, if we have VS(610, 144, 34) = 6 and VS(305, 72, 17) = 4, we have VS=64.
The used Moving Averages can be chosen between EMA and MyMA. MyMA is a Moving Average that tries to mimic Bo William's MIMA. Due to the close resemblance between MyMA and MIMA, I do not feel comfortable to open this script source code. In order to learn how this script operates with EMAs, please refer to my Super EMA Prism indicator that has its source code open.
VS score is plotted by default in black, but it can be on white for dark themes. AS is plotted with the color of the longest MA used.
Chart background is colored according to the range of values for AS and VS, checked in the following order:
if AS >= 13 and VS <= 13 then back color = red
if AS >= 13 or VS <= 13 then back color = orange
if AS >= 64 and VS >= 64 then back color = green
if AS >= 64 or VS >= 64 then back color = blue
otherwise back color = none (white o black)

MyMA PrismThis script implements the Binary Logic Trading (BLT) algorithm to calculate a score from 0 to 7. This score is calculated assigning a power of 2 weight to the positive sign of 3 Phi^3 distant Moving Average (MA) slopes. The largest MA slope positive sign receives weight 4, the middle length MA slope positive sign receives weight 2 and the shortest MA slope positive sign receives weight 1. The positive sign of an MA is defined as 1 if the slope of the MA is positive and 0, otherwise. Therefore, for MAs 305, 72 and 17, if slope(MA305) > 0, slope(MA72) < 0 and slope(MA17) > 0, then score will be 4*1 + 2*0 + 1*1 = 5. Up to my knowledge, this score was first proposed by Bo Williams and named by him as Prisma.
The used Moving Averages can be chosen between EMA and MyMA. MyMA is a Moving Average that tries to mimic Bo William's MIMA. Due to the close resemblance between MyMA and MIMA, I do not feel comfortable to open this script source code. In order to learn how this script operates with EMAs, please refer to my Custom EMA Prism indicator that has its source code open.
Due too sampling issues, this script ONLY WORKS with graphic time of 1d. I would like to thanks to MrBitmanBob for showing me how to get quotations from a graphic time distinct from the current one.
This script also gets sampling data from graphic times 2h and 30m to calculate their score. As, even for smaller graphic times, price data is sampled at the current time frequency, the MA lengths for those smaller graphic times needed to be proportionally decreased, meaning that when calculating the score for 1d with lengths 305, 72 and 17, the score for 2h must be calculated with lengths 72, 17 and 4, and the score for 30m must be calculated with lengths 17, 4 an 1. I understand that some precision may be lost but it is the best that is possible.
There is an optional setting for Crypto Currencies that instead of calculating the score for 1d, 2h and 30m, it calculates the score for 1d, 4h and 60m. This is due to the fact that Crypto Currencies are traded 24x7. Despite of this setting, the labels at the Style tab of the settings window remains 2h and 30m, because they must be constants.
This script with the corresponding MyMAs chart and the MyMAs Angle chart provides a broader view of the trading scenario.
Custom EMA PrismThis script implements the Binary Logic Trading (BLT) algorithm to calculate a score from 0 to 7. This score is calculated assigning a power of 2 weight to the positive sign of 3 Phi^3 distant EMAs' slopes. The largest EMA slope positive sign receives weight 4, the middle length EMA slope positive sign receives weight 2 and the shortest EMA slope positive sign receives weight 1. The positive sign of an EMA is defined as 1 if the slope of the EMA is positive and 0, otherwise. Therefore, for EMAs 305, 72 and 17, if slope(EMA305) > 0, slope(EMA72) < 0 and slope(EMA17) > 0, then score will be 4*1 + 2*0 + 1*1 = 5. Up to my knowledge, this score was first proposed by Bo Williams and named by him as Prisma.
Due too sampling issues, this script ONLY WORKS with graphic time of 1d. I would like to thanks to MrBitmanBob for showing me how to get quotations from a graphic time distinct from the current one.
This script also gets sampling data from graphic times 2h and 30m to calculate their score. As, even for smaller graphic times, price data is sampled at the current time frequency, the EMA lengths for those smaller graphic times needed to be proportionally decreased, meaning that when calculating the score for 1d with lengths 305, 72 and 17, the score for 2h must be calculated with lengths 72, 17 and 4, and the score for 30m must be calculated with lengths 17, 4 an 1. I understand that some precision may be lost but it is the best that is possible.
There is an optional setting for Crypto Currencies that instead of calculating the score for 1d, 2h and 30m, it calculates the score for 1d, 4h and 60m. This is due to the fact that Crypto Currencies are traded 24x7. Despite of this setting, the labels at the Style tab of the settings window remains 2h and 30m, because they must be constants.
This script with the corresponding EMAs chart and the EMAs Angle chart provides a broader view of the trading scenario.
MyMA AngleThis script shows the angle of 6 Moving Averages (MAs) to perform trade analysis. The MA angle is also known as its Rate Of Change ( ROC ). The 6 MAs (I, II, III , IV, V and VI ) default lengths come from one of the Fibonacci Phi^3 and Phi^3/2 sub series (17, 34, 72, 144, 305 and 610), but can be changed to any values, particularly to the traditionally used 20, 40, 50, 100, 200 and 300. Up to my knowledge, Fibonacci Phi^3 and Phi^3/2 sub series lengths were first proposed by Bo Williams.
The used Moving Averages can be chosen between EMA and MyMA. MyMA is a Moving Average that tries to mimic Bo William's MIMA. Due to the close resemblance between MyMA and MIMA, I do not feel comfortable to open this script source code. In order to learn how this script operates with EMAs, please refer to my Custom EMA + FIBO indicator that has its source code open.
Angle calculation is performed by calculating the tangent over a delta interval. Normalization is required to make the angle independent of the price range.
This script is meant to be used together with the corresponding MAs on the candle pane. Non normalized view shows a more realistic angle condition but, if intended to be used with the MyMAS indicator, normalized view should be used.

Custom EMA AngleThis script shows the angle of 6 EMAs to perform trade analysis. The EMA angle is also known as its Rate Of Change ( ROC ). The 6 EMAs (I, II, III , IV, V and VI ) default lengthes come from one of the Fibonacci Phi^3 and Phi^3/2 sub series (17, 34, 72, 144, 305 and 610), but can be changed to any values, particularly to the traditionally used 20, 40, 50, 100, 200 and 300. Up to my knowledge, Fibonacci Phi^3 and Phi^3/2 sub series lengthes were first proposed by Bo Williams.
Angle calculation is performed by calculating the tangent over a delta interval. Normalization is required to make the angle independent of the price range.
This script is meant to be used together with the corresponding EMAs on the candle pane. Non normalized view shows a more realistic angle condition but, if intended to be used with the CEMAS indicator, normalized view should be used.

GMS: TSI Indicator (ROC)This is based on the original TSI Indicator that's already built in.
The PC is originally taken as the change between the current price - the previous price. I substituted that with Rate of Change. Using a 1 period ROC it's quite similar to the TSI Indicator and increasing the length results in a smoother TSI.
I hope it helps,
Andre
Percent Change MtFThis plots the selected resolution's percent change from open to close. Easy way to check the previous period's range with less noise. Note the latest period is calculating on a bar that hasn't closed so it won't update unless you refresh/change timeframes to prevent incorrect reporting.
