RAINBOW_13thHi Dears!
hereby, I present you one of my indicators which is a kind of artistic indicator.
It calculates different ranks of functions and based on them suggests a buy or sell order which is depicted on right-side separately.
Inputs:
(For calculating)
+Source:
+Length: Number of previous bars in calculation
+Topology:
++EMA
++RMA
++SMA
++RSI
+OVER BOUGHT RSI: Define your boundary for overbought in RSI-TOPOLOGY.
+OVER SOLD RSI: Define your boundary for oversold in RSI-TOPOLOGY.
(Visual)
+Transparency: affect colors of rainbow!
Wish you good deals!
BY USING PLZ DO NOT FORGET TO BOOST IT!
Shakib.
Rsi_overbought

RSI Accumulation/Distribution [M]Hello everyone,
After my long tests, I observed that the rate of change of direction of the price was high after the periods when the RSI spent a long time outside the band. As a result of my observations, I prepared this indicator.
This indicator shows you the accumulation and distribution areas that occur outside the rsi band.
There are 3 different levels available.
Level 1 = 5 Bars
Level 2 = 7 Bars
Level 3 = 9 Bars
For example, if the RSI spends more than 9 bars below the 30 level or above the 70 level, it will paint that area red. Levels can be changed from the indicator settings. The rsi is smoothed with simple moving average to reduce fake signals.
Using the RSI A/D indicator with different indicators or patterns will increase your success rate.
Examples:

RSI Dashboard Monitor [Skiploss]RSI Dashboard Monitor is indicator for scanner Relative Strength Index ( RSI ) for 4 symbols and 10 Timeframe, detached from the main chart.
You can choose to display all 4 symbols or just 1 symbol, also can choose resolution (TF). Still, these 10 timeframes should be enough to use. Default is set to 14 but you can modify it from settings.
How it work??
RSI >= 75 : Fill color maximum overbought
RSI >= 65 : Fill color medium overbought
RSI >= 55 : Fill color minimum overbought
RSI >= 45 : Fill color minimum overbought
RSI >= 35 : Fill color medium overbought
RSI >= 25 : Fill color maximum overbought
** Values level and color style can modify it from settings

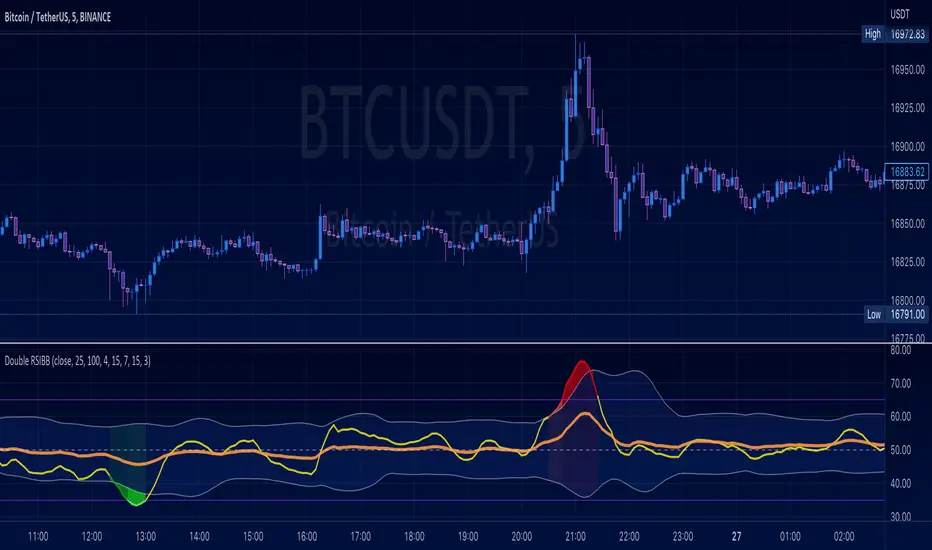
Double RSI + BBRSI stands for Relative Strength Index.
Bollinger Bands stands for a channel open by standard deviation values plotting upper, lower lines.
Double RSI with Bollinger bands adapted Bollinger bands to RSI not using overlay mode. It tries to filter fake signals while giving more good signals according to volatility even below overbought areas or above oversold areas. This way you can use greater values for RSI, like 25 and 100, increasing smoothness with less market noise.
We added an extra gap spacer to smooth Bollinger bands while widening the channel with a lower multiplier.
I found better results when Fast RSI crosses back into Bollinger bands channel.
You can play with the following settings:
• Source
Close is the most used
• Fast RSI length
Default to 25
• Slow RSI length
Default to 100
• RSI Smoothing
To filter out some graphic noise
• RSI Overbought, Oversold
Regular overbought, oversold lines handled by a single value. For 70/30, set it to 20 although with longer RSI something around 15 is enough.
• Bollinger Spacer
Ads thickness to the channel with lower multiplier
• Bollinger Length
Regular Bollinger length applied to slow RSI
• Bollinger Multiplier
Regular Bollinger multiplier applied to slow RSI
Disclaimer:
For study purposes only, trading without a good risk management can be regrettable, do your own research, always add confirmations, use it as is, at your own risk.
RSI on Chart Window- The RSI indicator is displayed right on the chart, along with overbought and oversold notification symbols.
- Easily enable/disable the display of RSI Upper Band, Lower Band.

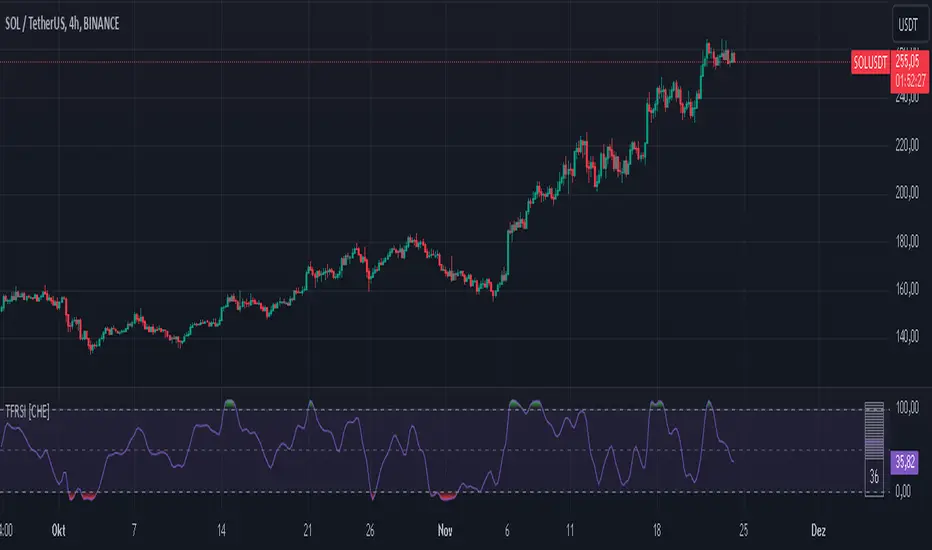
The Forbidden RSI [CHE]My main goal of programming and publishing an indicator is that everyone should have the opportunity to use indicators that do not show false signals or where there is maximum practical use, so I publish this indicator:
This script is an advanced variant of the Onset Trend Detector, a technical indicator for trend analysis developed by John F. Ehlers.
It is based on a non-linear quotient transformation and expands upon Mr. Ehlers' previous studies, the Super Smoother Filter and the Roofing Filter,
to address the lag issue common to moving average type indicators.
The algorithm in this script registers the most recent peak value and normalizes it. The normalized value then decays slowly until the next
peak swing. The ratio of the previously filtered value to the corresponding peak value is then transformed using a quotient transformation to
provide the resulting oscillator.
This script implements an indicator called "The forbidden RSI" (TFRSI). This indicator was developed by chervolino as an improvement on the
standard Relative Strength Index (RSI), which is a technical indicator used to measure the strength of a trend and identify potential buy and sell signals.
The TFRSI is calculated based on the close price and is typically plotted on a scale from -20 to 120, with values above 100 indicating that
the asset is overbought (likely to decline in value) and values below 1 indicating that it is oversold (likely to increase in value). The script
allows the user to customize the length of the RSI and the length of the trigger used to smooth the signal.
In order to calculate the TFRSI, the script first initializes some constants and then performs a series of calculations to determine the value of
"HP", "ag", and "Sp". The RSI value is then calculated based on the values of "X", which is based on "ag" and "Sp", and "q1", which is based on "X"
and the trigger length. The RSI value is plotted in a chart along with upper and lower bounds and a filled region representing the background.
Please check it out, it works perfectly to find good analysis and entries for both, longs and shorts.
Best regards
Chervolino
Note: I hope that the moderators like my script and the explanation and don't delete it this time
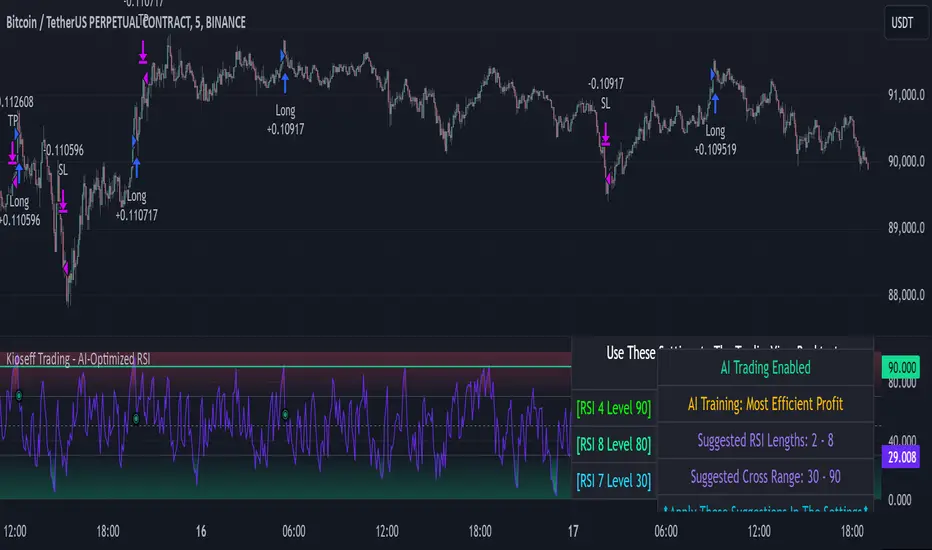
Kioseff Trading - AI-Optimized RSIAI-Optimized RSI
Introducing AI-Optimized RSI: a streamlined solution for traders of any skill level seeking to rapidly test and optimize RSI. Capable of analyzing thousands of strategies, this tool cuts through the complexity to identify the most profitable, reliable, or efficient approaches.
Paired with TradingView's native backtesting capabilities, the AI-Optimized RSI learns from historical performance data. Set up is easy for all skill levels, and it makes fine-tuning trading alerts and RSI straightforward.
Features
Purpose : Uncover optimal RSI settings and entry levels with precision. Say goodbye to random guesses and arbitrary indicator use—this tool provides clear direction based on data.
Target Performance : You set the goal, and AI-RSI seeks it out, whether it's maximizing profits, efficient trading, or achieving the highest win rate.
AI-Powered : With intelligent AI recommendations, the tool dynamically fine-tunes your RSI approach, steering you towards ideal strategy performance.
Rapid Testing : Evaluate thousands of RSI strategies.
Dual Direction : Perfect both long and short RSI strategies with equal finesse.
Deep Insights : Access detailed metrics including profit factor, PnL, win rate, trade counts, and more, all within a comprehensive strategy script.
Instant Alerts : Set alerts and trade.
Full Customization : Test and optimize all RSI settings, including cross levels, profit targets and stop losses.
Simulated Execution : Explore the impact of limit orders and other trade types through simulation.
Integrative Capability : Combine your own custom indicators or others from the TradingView community for a personalized optimization experience.
Flexible Timeframes : Set your optimization and backtesting to any date range.
Key Settings
The image above shows explanations for a list of key settings for the optimizer.
Direction : This setting controls trade direction: Long or Short.
Entry Condition : Define RSI entry: Select whether to trigger trades on RSI crossunders or crossovers.
RSI Lengths Range : Choose the range of RSI periods to test and find the best one.The AI will find the best RSI period for you.
RSI Cross Range : Set the range for RSI levels where crosses trigger trade signals. The AI will find the best level for you.
Combinations : Select how many RSI strategies to compare.
Optimization Type : Choose the goal for optimization and the AI: profit, win rate, or efficiency.
Profit Target : Set your profit target with this setting.
Stop Loss : Decide your maximum allowable loss (stop loss) per trade.
Limit Order : Specify whether to include limit orders in the strategy.
Stop Type : Choose your stop strategy: a fixed stop loss or a trailing stop.
How to: Find the best RSI for trading
It's important to remember that merely having the AI-Optimized RSI on your chart doesn't automatically provide you with the best strategy. You need to follow the AI's guidance through an iterative process to discover the optimal RSI settings and strategy.
1.Starting Your Strategy Setup
Begin by deciding your goals for each trade: your profit target and stop loss. You'll also choose how to manage your stops – whether they stay put (fixed) or move with the price (trailing), and whether you want to exit trades at a specific price (limit orders). Keep the initial settings for RSI lengths and cross ranges at their default to give the tool a broad testing field. The AI's guidance will refine these settings to pinpoint the most effective ones through a process of comprehensive testing.
The image above shows our chart prior to any optimization efforts.
Note: the settings shown above in the key settings section will be used to start our demonstration.
2. Follow AI’s suggestions
Optimization Prompt: After loading your strategy, the indicator will prompt you to change the RSI length range and RSI level range to a better performing range.
Continue changing the RSI length range and RSI level range to match the indicator's suggestions until "Best Found" is displayed!
The image above shows results after we applied the tool’s suggestions. New suggestions have appeared, and we will continue to apply them.
Continue to adjust settings as recommended by the optimizer. If no better options are found, the optimizer will suggest increasing the number of combinations. Repeat this process until the optimizer indicates that the optimal setting has been identified.
Success! With the "Best Found" notification, an optimized RSI is now active. The AI will keep refining the strategy based on ongoing performance, ensuring continuous optimization.
AI Mode
AI Mode incorporates Heuristic-Based Adaptive Learning to fine-tune trading strategies in a continuous manner. This feature consists of two main components:
Heuristic-Based Decision Making: The algorithm evaluates multiple RSI-based trading strategies using specific metrics such as Profit and Loss (PNL), Win Rate, and Most Efficient Profit. These metrics act as heuristics to assist the algorithm in identifying suitable strategies for trade execution.
Online Learning: The algorithm updates the performance evaluations of each strategy based on incoming market data. This enables the system to adapt to current market conditions.
Incorporating both heuristic-based decision-making and online learning, this feature aims to provide a framework for trading strategy optimization.
Settings
AI Mode Aggressiveness:
Description: The "AI Mode Aggressiveness" setting allows you to fine-tune the AI's trading behavior. This setting ranges from “Low” to “High”, with “High” indicating a more assertive trading approach.
Functionality: This feature filters trading strategies based on a proprietary evaluation method. A higher setting narrows down the strategies that the AI will consider, leaning towards more aggressive trading. Conversely, a lower setting allows for a more conservative approach by broadening the pool of potential strategies.
Adaptive Learning Aggressiveness:
Description: When Adaptive Learning is enabled, the "Adaptive Learning Aggressiveness" setting controls how dynamically the AI adapts to market conditions using selected performance metrics.
Functionality: This setting impacts the AI's responsiveness to shifts in strategy performance. By adjusting this setting, you can control how quickly the AI moves away from strategies that may have been historically successful but are currently underperforming, towards strategies that are showing current promise.
Optimization
Trading system optimization is immensely advantageous when executed with prudence.
Technical-oriented, mechanical trading systems work when a valid correlation is methodical to the extent that an objective, precisely-defined ruleset can consistently exploit it. If no such correlation exists, or a technical-oriented system is erroneously designed to exploit an illusory correlation (absent predictive utility), the trading system will fail.
Evaluate results practically and test parameters rigorously after discovery. Simply mining the best-performing parameters and immediately trading them is unlikely a winning strategy. Put as much effort into testing strong-performing parameters and building an accompanying system as you would any other trading strategy. Automated optimization involves curve fitting - it's the responsibility of the trader to validate a replicable sequence or correlation and the trading system that exploits it.
Skrip berbayar
RSI Objective LinesThe RSI is a contrarian indicator bounded between 0 and 100 where values close to the area of 30 represent an oversold condition and values close to the area of 70 represent an overbought condition.
Generally, we use the area of 70/75 and the area of 30/25 as extremes that signal a market reversal or a correction. But what if we calculate a simple way to make these levels more dynamic?
The main idea from these objective support and resistance levels is that market regime and dynamics move and as such fixed levels are unlikely to always provide value which means that we can try creating variable levels. The objective support and resistance levels are created following these steps:
* Calculate a 14-period RSI on the close price, let's call this RSI_Close.
* Calculate a 14-period RSI on the high price, let's call this RSI_High.
* Calculate a 14-period RSI on the low price, let's call this RSI_Low.
* Calculate the maximum range which is the highest value of RSI_High in the last 200 periods minus the lowest value of RSI_Low in the last 200 periods. Let's call this Max_Range
* Define the range width. By default, it is set to 5%. Let's call this Threshold.
* The objective support is calculated as the sum of the RSI_Low + (Max_Range * Threshold).
* The objective resistance is calculated as the sum of the RSI_High - (Max_Range * Threshold).
The levels are used in the same way as the oversold and overbought levels. They are more dynamic as they take into account the fluctuations of the RSI so you might see at some point in time a support at 20 and at another at 35.

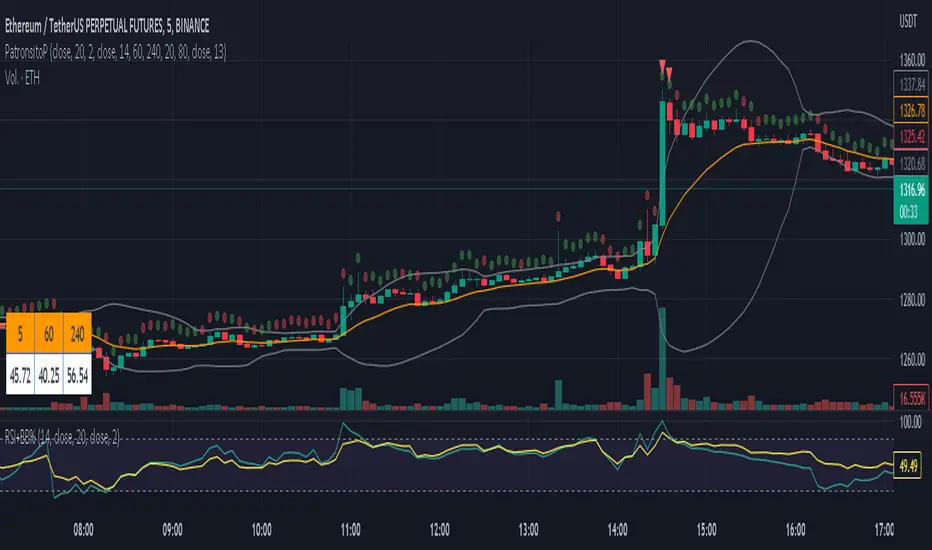
PatronsitoPIndicator for the "Patrón Poderoso" strategy.
This strategy is based on Bollinger Bands and RSI and try to determine overbought or oversold zones where you can trade. Both indicators are combined to provide a stronger signal.
By default, it is considered an overbought zone when price is over BB upper and RSI above 80. That would be a short signal. Price below BB lower and RSI below 20 means an oversold zone and therefore a long signal.
EMA 13 (by default) is included as a guide for exiting the operation.
Alarms for signals in any direction can be used.
RSI ProfileThis indicator shows the RSI profile from historical RSI Value and High / Low RSI Pivots.
It is inspired by the Volume Profile which is a common charting study that indicates activity at specified levels. It plots a histogram on the chart meant to identify dominant/significant levels.
This script is profiling RSI levels into a histogram, which can identify the crucial RSI values in the chart. Along with the pivot options that can help identify the dominant pivot points where RSI values had been rebounding historically.
How to use:
There are three profile types available in the settings. When selecting RSI Values, the indicator will count RSI values from history, and plot the count in a histogram at the end of the chart. If you select RSI Pivots High or RSI Pivots Low, the indicator will count only the RSI Pivot Highs and Lows and plot the count in a histogram. Users can select the Pivot Left/Right length from the settings.
Users can extend the POC line to the left, to study how the values had been reacting to POC
Please note: Since the RSi values range from 0 to 100, the indicator is rounding off the values to absolute numbers. This can cause a situation where multiple POC are identified, to find the unique POC, you can increase the width of the histogram.
The Max/Min RSI settings are for visual purposes only, it can help users shrink down the histogram's top and bottom visibility

RSI Trend Veracity (RSI TV)The RSI only plots itself between a high and a low value. It does not show its bullish/bearish sentiment.
The RSI TV shows the sentiment and helps anticipate the RSI trend but not the price trend.
When the Trend Veracity Line is in green, there is bullish sentiment. When it is in red, there is bearish sentiment.
The closer the lines get to their extremities, the more the current trend of the RSI is exhausted.
It works quite well even in choppy markets. See notes in the picture for more details.

TIGER ALERT RSI DIVThats our first RSI DIV indicator for free use.
What is an RSI divergence?
What Is the Relative Strength Index (RSI)?
The relative strength index (RSI) is a momentum indicator used in technical analysis.
RSI measures the speed and magnitude of a security's recent price changes to evaluate overvalued or undervalued conditions in the price of that security.
The RSI can do more than point to overbought and oversold securities. It can also indicate securities that may be primed for a trend reversal or corrective pullback in price. It can signal when to buy and sell. T
raditionally, an RSI reading of 70 or above indicates an overbought situation. A reading of 30 or below indicates an oversold condition.

Quick and Simple - WPR+RSI+CCITake a look.
Couple of confluencial reversal signals from popular indicators (W%R, RSI & CCI). I can only say this shows how random the "stanard tools" are and how the market makers "play" these kind of tools to their advantage.
That said. It's better tha average, but not top-class, so expect to have to take signals with other confluence. DON'T take the plots or signals as buy / sell signals, they are just confluencial movements from these indicators based on how they should be "traditionally" used. Instead, use it as a guide as to what other traders may be thinking, or as a pull-back identifier.
Included 100 period ema as basic trend filter.
Not my normal type of script + been away for some time so be kind, lol :)
You might find it useful however so sharing.
More stuff to follow :)

Relative Strength Index with fast and slow MAsThis is the typical Relative Strength Index indicator with two moving averages, one slow (length 50 by default) and one fast (length 20 by default). Additionally, there are four lines, which mark the oversold/overbought signals at different levels, there are two inner bands with values at the levels 40, and 60, and two outer bands at the levels 20, and 80. The presence of the fast and slow moving averages and their crossover/crossunder with the oversold/overbought levels or the RSI can provide more insightful and faster signals. The indicator has a slightly different colouring mechanism.
The views of the RSI indicator on the above the price chart in both dark and light modes:

SUPER RSI [Gabbo]RSI revolutionizes the classic RSI by allowing you to modify its behavior based on different chart types and dynamic multi-source calculations.
It’s designed for traders who want greater precision and adaptability in momentum analysis across various market conditions.
Whether you want to apply the RSI on alternative candles like Heikin Ashi, Renko, or even combine multiple data sources, this tool provides maximum flexibility.
🔷 Key Features
🟩Customizable Chart Inputs
Apply RSI calculations not only on traditional candles but also on alternative bar types like Heikin Ashi, Kagi, Line Break, Point & Figure, and Renko for a deeper understanding of trend strength.
🟩Multi-Source Aggregation
Blend multiple sources together to create a more stable and refined RSI signal. Combine 2, 3, 4, or even 5 different sources into a single input.
🟩Dynamic RSI and Bands
Unlock advanced options to dynamically adjust the RSI itself and its surrounding bands based on real-time price action.
🔷 Technical Details and Customizable Inputs
1️⃣ Bar Type Selection:
Choose the type of chart structure used for RSI calculation:
Candles (classic)
Heikin Ashi
Kagi
Line Break
Point & Figure
Renko
2️⃣ Use Different Source???
Activate multi-source RSI by combining multiple elements:
2 sources : (Source 1 + Source 2) ÷ 2
3 sources : (Source 1 + Source 2 + Source 3) ÷ 3
4 sources : (Source 1 + Source 2 + Source 3 + Source 4) ÷ 4
5 sources : (Source 1 + Source 2 + Source 3 + Source 4 + Source 5) ÷ 5
3️⃣ Use Dynamic RSI???
Enable a dynamic RSI calculation that adjusts in real-time to market behavior for greater responsiveness.
4️⃣ Use Dynamic Band???
Enable dynamic bands that adapt to price action rather than relying on fixed static thresholds.
🔍 How to Use Dynamic RSI Source Pro
📈 Choose Your Candle Type
Select the bar format that best matches your strategy needs—classic candles, Heikin Ashi, Renko, and more.
🧩 Customize Your Data Source
Activate multi-source input to create smoother, more reliable RSI signals.
⚡ Unlock Dynamic Adaptation
Enable dynamic RSI and bands to adjust automatically to live price movements and enhance signal accuracy.
☄️ With Dynamic RSI Source Pro, you can elevate your RSI analysis by applying it dynamically across multiple candle types and sources, giving you a new level of control and precision.

RSI+ by Wilson (alt)Extension of the excellent RSI+ script by Wilsonlibero. I tweaked the parameters to better fit crypto markets, and I added a few more visuals, such as midline, overbought/oversold threshold lines and areas, background coloration depending on RSI trend above or below midline, and a few other tweaks especially colors (fixed the transp parameter deprecation for example). The color theme is by default more optimized for dark mode charts, but all colors can be configured, and all drawings can be enabled/disabled/tweaked in the parameters.
I'm just giving back to the community since I could modify this script only because it was open-source. If you like this script, please don't give me any credit, but please show some love to the original author Wilsonlibero:

Weather Vane
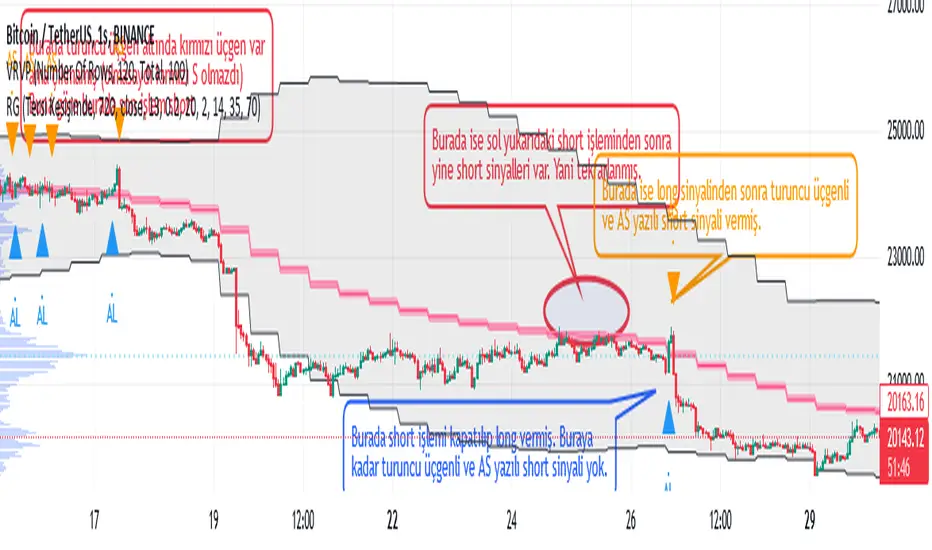
Why is the indicator called 'wind Vane'? Because in this indicator, the trade is entered according to which side the price cuts the EMA that you will determine.
For example, if we have chosen EMA_X as 13, if the price cuts ema13 up within the tolerance you specify, it enters the LONG transaction, if it cuts down, it enters the SHORT transaction and closes the opposite direction while entering a transaction. In other words, the 'wind rose' as the price moves towards that direction (it is blown according to the wind) :)
Explanation on "Açık Pozisyonun Çıkış Koşullarını Seçin": If "Tersi Kesişimde" option is selected, the closing of the open trade is only possible when the price cuts the EMA_X+-tolerance value in the opposite direction. For example, if the price has cut the EMA_X+tolerance up and LONG has been entered in the transaction, this LONG transaction will be closed only by cutting the EMA_X-tolerance back down and entering the SHORT transaction.
If the "BB Sınırında" option is selected, the closing of the open trade is when the price reaches the Bollinger Band limit. For example, if the last price cut the EMA_X+tolerance up and a LONG trade was opened, this trade will be closed if the price comes from below and reaches the upper limit of the Bollinger Band. SHORT The transaction is closed when the price comes from above and reaches the lower limit of the Bollinger Band (black diamond appears as a figure).
If the "OB ve OS'larda" option is selected, the condition of reaching the above Bollinger Band limit for trades to be closed, plus the fact that the RSI exceeds the OverSold (base limit) and OverBought (ceiling limit) values specified in the settings tab of the indicator. (Visible as a navy blue diamond shape)
EMA, Bollinger Band and RSI values in the conditions of entering a LONG or SHORT trade or closing the trade, whatever it is, are calculated according to the candle duration to be selected from here, independently of the candle duration selected on the chart, and printed on the chart, and the trades are realized at the values of this selected candle period.
The default state is based on 720-minute, 12h (12-hour) candles. In this default state, even if you select the candle duration of 1 hour from the chart, whether the trading conditions are met or not is checked according to the RSI EMA_X and BBand values in 720 minutes.
When "any alert condition" is selected while setting an alarm, a single alarm will be set on all alarm conditions and it will notify (by specifying which condition) which alarm condition is met. However, when setting the alarm, it reports once in each candle according to the candle duration selected on the chart. For example, let's say that we have chosen the candle duration of 5 minutes on the chart, and we have chosen the TFM as 720 minutes, that is, 12h. In this case, even if any condition is met multiple times within 5 minutes, it only tells us the first one. If the condition is still met at the opening of the new candle, it will report once in the new candle, and now, even if the condition is met again a hundred times in the last candle, it will only report the first one. If the opposite condition is met within 5 minutes and the last trade entered by moving long steps, the price will be closed and the entry to the opposite direction may be delayed, you can select the candle duration of 1 minute from the chart.
In the meantime, it can give LONG notifications over and over while already in LONG position, but since the balance is fully processed in the first, subsequent LONG notifications do not matter. Likewise SHORT and pose exit notifications.
Yasir Hameed Advance RSI IndicatorRELATIVE STRENGTH INDEX ( RSI )
This is a tool that is widely used
Especially for Overbought and Oversold systems, but I have made some changes in this indicator,
How to use it...!
I have set it as the default setting
- RSI Length: 7
- Overbought: 70
- Oversold: 30
What is unique about this tool?
we can see 3 conditions:
1) RSI Overbought / Oversold with Bullish Engulfing / Bearish Engulfing
2) RSI Overbought / Oversold with Hammer and Shooting Star
3) RSI Overbought / Oversold with 2 Bullish Bars / 2 Bearish Bars
4) RSI Overbought / Oversold with All Patterns at the same time
When the RSI reaches its Oversold line, the code will wait for Bullish Engulfing pattren, when oversold and Bullish engulfing matched, This indicator will generate a buy signal when the condition is met,
and same as for Bear market, When the RSI reaches its Overbought line, the code will wait for Bearish Engulfing pattren, This indicator will generate a sell/exit signal when the condition is met,
2nd condition is that a Hammer candle will be waited for when RSI touches the Overbought line, for Bullish Move
and Shooting Star candle will be waited for when RSI touches the Overbought line, for Bullish Move, for Bearish Move
3rd Condition is also the same as Condition 1 and Condition 2,
When the RSI reaches its Oversold line, the code will wait for 2 Bullish Bars, when oversold and 2 Bullish Bars matched then this indicator will generate a buy signal, and same as for Bear market,
When the RSI reaches its Overbought line, the code will wait for 2 Bearish Bars, when overbought and 2 Bearish Bars matched then this indicator will generate a Sell signal,
4th Condition is that we can use All Conditions at the same time,
- Bullish Engulfing / Bearish Engulfing
- Hammer and Shooting Star
- 2 Bullish Bars / 2 Bearish Bars

RSI + GDAX EMA ConfluencerHighly customizable RSI + GDAX EMA tool to help you quickly spot levels of confluence
- Displays current RSI levels as a plot
- Displays current 12 + 26 EMA as a plot
- 7 customizable time frames
- Each time frame marks RSI oversold, RSI overbought, 12 EMA, and 26 EMA as a line with label
- Each time frame RSI and EMA have options to toggle visibility and oversold/overbought only so you can choose exactly what you want to see
Planned for future release:
- Further customization for lines (color, size, direction, etc)
- Further customization for labels (location, offset, color, size, etc)
- Highlighting areas of confluence (if 2-3+ lines are within a certain % of each other)

RSI based support resistance levelsThis indicator draws support line and resistance lines in the price chart.
How ?
For drawing the support/resistance line we need to first determine the demand and supply.
We are using too-familiar indicator RSI to determine when the script is oversold and overbought.
Now oversold (in RSI) is not a point, it’s a zone. The RSI indicator comes below 30, stays there and goes up above 30. Similarly for overbought.
Now if you carefully look at the oversold region – the lowest point of the oversold region is the place where the demand came (for surety) and push the indicator (and price) up.
Similarly: the highest point of overbought is the place where (for surety) the supply came and push the indicator (and price) down.
So that’ the supply / demand line (for surety).
In this indicator, based on the RSI we are just drawing support and resistance lines in the chat. That’s all.
What is unique ?
Trendline concept is not new. RSI is not new. RSI overbought/oversold is not new.
There are indicators exist to draw trendlines. Some of them works beautifully.
However, none of these, we are aware of, uses RSI to determine it. And, we believe, the most logical way to determine support/resistance is RSI.
Note: We are not responsible for any trading/investment decision you are taking out of the outcome of this indicator.

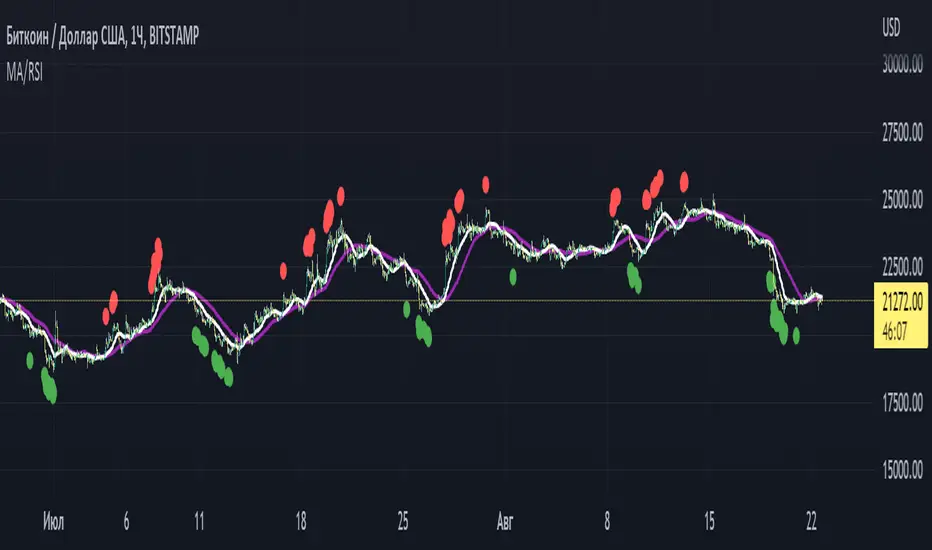
Pranoyama MA/RSI toolEng: The indicator highlights the overbought and oversold RSI levels on the bars. Also draws two moving averages: sma or ema. The RSI levels, the type of moving averages and their period are set by the user.
Rus: Индикатор подсвечивает на барах уровни перекупленности и перепроданности по RSI, а так же рисует две скользящие средние на выбор: sma или ema. Уровни RSI, тип скользящих средних и их период устанавливаются пользователем.
p.s. Это адаптация ранее опубликованного мной индикатора
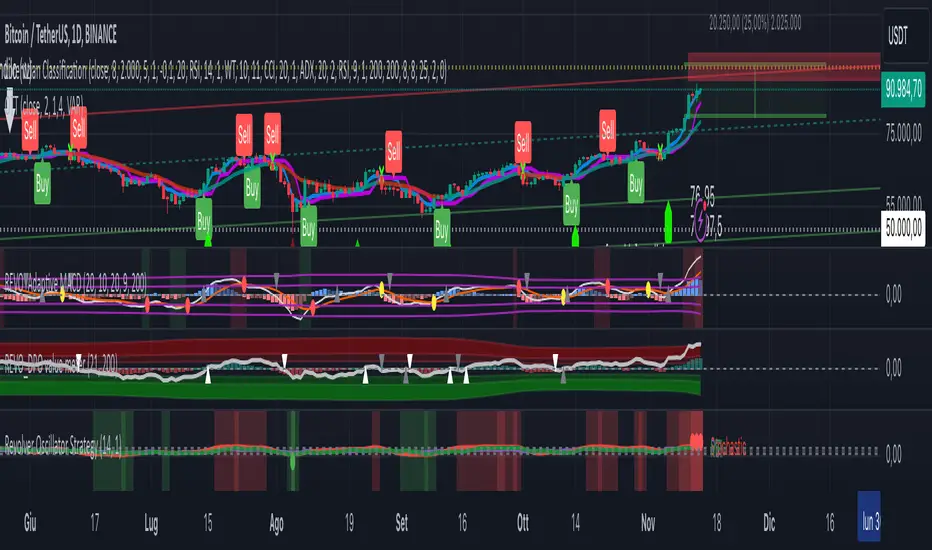
Revolver Oscillator Strategy 1.2 (RSI+UO+MFI)ROS (Revolver Oscillator Strategy)
Version 1.2
Description
This script combines three popular oscillators (RSI, Ultimate Oscillator and MFI) to accurately determine the price momentum of an asset.
Context
- RSI (Relative Strength Index) is a momentum oscillator that measures the speed and change of price movements over a period of time (14).
- Ultimate Oscillator uses three different periods (7, 14, and 28) to represent short, medium, and long-term market trends.
- Money Flow Index (MFI) is a momentum indicator that measures the flow of money into and out over a period of time. It is related to the Relative Strength Index (RSI) but incorporates volume, whereas the RSI only considers price
How does it work?
When a RED bar appears, it means that the three oscillators have exceeded the set thresholds, and it is a SELL signal.
When a GREEN bar appears, it means that the three oscillators are below the set thresholds, and it is a BUY signal.
I recommend leaving the default settings.
Multi Type RSI [Misu]█ This Indicator is based on RSI ( Relative Strength Index ) & multiple type of MA (Moving Average) to show different variations of RSI.
The relative strength index (RSI) is a momentum indicator used in technical analysis to evaluate overvalued or undervalued conditions in the price of that security.
█ Usages:
The purpose of this indicator is to obtain the RSI calculated with different MAs modes instead of the classic RMA.
The red and green zones indicate the oversold and overbought zones.
Buy or sell signals are marked by the green and red circles
We have 2 different signal modes : when the different size RSIs cross and when the fast RSI crosses the extreme bands.
Alerts are setup.
█ Parameters:
Lenght RSI: The lenght of the RSI. (14 by default)
RSI MA Type: The type of MA with which the rsi will be calculated. ("SMA", "EMA", "SMMA (RMA)", "WMA", "VWMA")
Fast Lenght MA: The fast lenght smoothing MA.
Slow Lenght MA: The Slow lenght smoothing MA.
Lower Band: The lenght of the lower band. (25 by default)
Upper Band: The lenght of the upper band. (75 by default)
Signal Type: The mode with which buy and sell signals are triggered. ("Cross 2 Mas", "Cross Ma/Bands")
