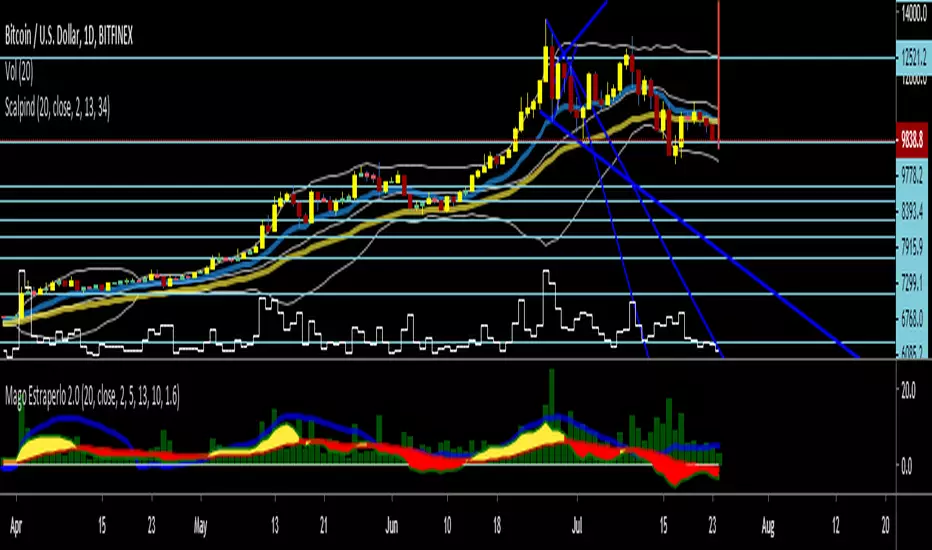
Market Cycle & Scalping entry / exitCycle indicator is an oscillator commonly used to identify market trends and provide buy and sell signals to traders. The Cyle indicator is based on the assumption that currency trends accelerate and decelerate in cyclical patterns that may reflect the dominant price cycle of any stock, during any time frame. It works best on a 1 min chart for quick scalp plays.
Scalping

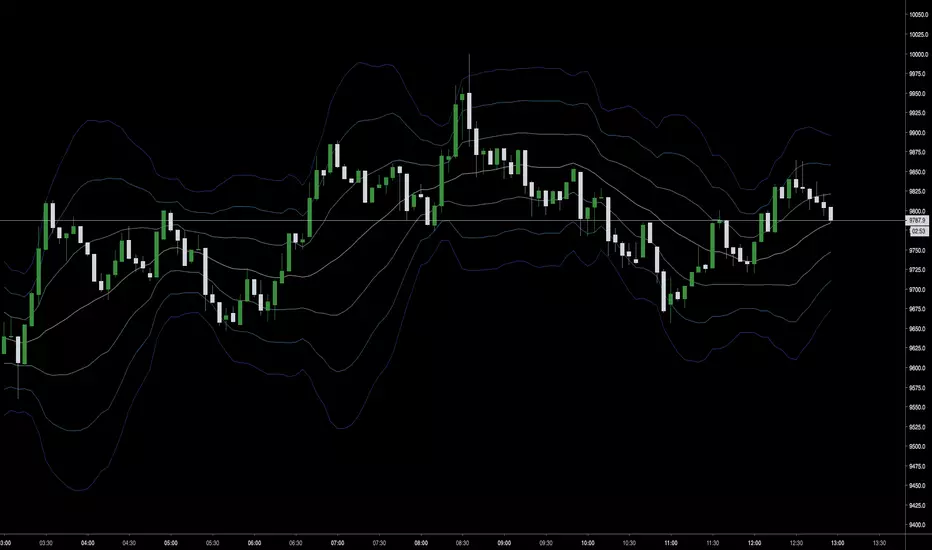
Triangular Moving Average (TMA) bandsWhat in the world is up folks ??!??
Here's the indicator of the day. Sharing a simple one today because I'm busy coding for a few clients (fun life of a top script author on TradingView)
The TMA bands is an indicator that I discovered on FXCM a few years ago FXCM TMA bands
From the screenshot above, we see that when the price hits the lower band, it's a possible reverse BUY signal. When it hits the upper band, it's a possible SELL signal
Methodology
1) The Take Profit 1 is the middle line, Take Profit 2 is the opposite band.
2) Once the TP1 is hit, set your Stop Loss to breakeven
3) Once the TP2 is hit, if you still want to stay in the trade, set your Stop Loss to the TP1
That's what we call a trailing stop loss which I offered in the Trade Manager : Trade-Manager-Open-Source-Version/
It will be a powerful tool in your arsenal for some scalp/intraday trades
After years of coding for traders, I worked with many brokers/API/languages so I'm very used to convert a script from a broker to another one (shameless self-advertising)
PS
Tomorrow I'll share the Signal version of my Algorithm Builder:
You'll be able to connect it in a single click to a very cool Backtest System made by the Pinescripters community
In other words, I'm selling the scripts to allow you to build your own signals in a few clicks AND to connect it easily to a kick-ass backtesting tool. More to come tomorrow
Hope you'll like it, like me, love it, love me, tip me :)
____________________________________________________________
Feel free to hit the thumbs up as it shows me that I'm not doing this for nothing and will motivate to deliver more quality content in the future. (Meaning... a few likes only = no indicators = Dave enjoying the beach)
- I'm an officially approved PineEditor/LUA/MT4 approved mentor on codementor. You can request a coaching with me if you want and I'll teach you how to build kick-ass indicators and strategies
Jump on a 1 to 1 coaching with me
- You can also hire for a custom dev of your indicator/strategy/bot/chrome extension/python

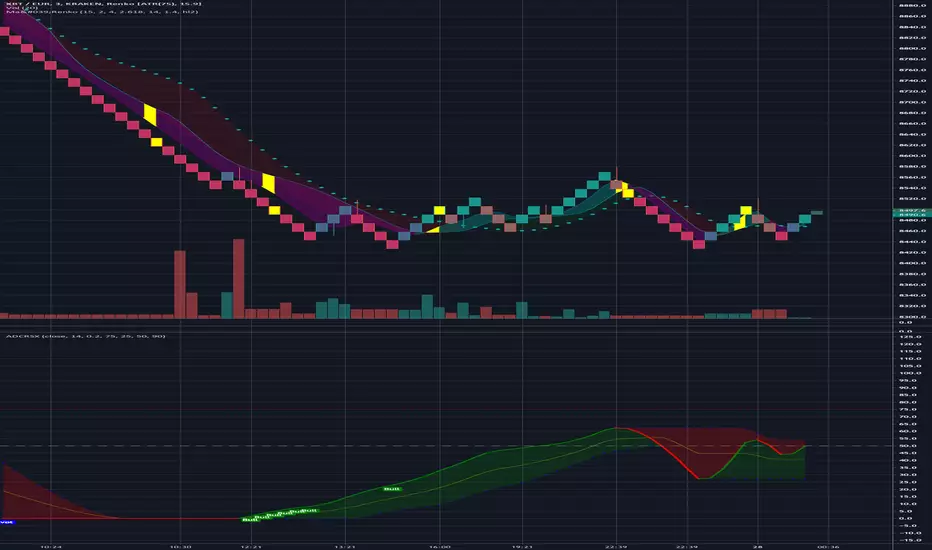
Ma'RenkoMa'Renko is simple, yet powerful trading system designed to help scalpers who use Renko charts (including ATR-based, but it should work with any type of candles as well). The thickness of color bands represents different trend characteristics (mostly volume and speed of price changing) which allow a trader to filter out false pivot points, enter and exit more wisely. The chart speaks for itself.

PA High Frequency TradingThis is PA High Frequency Trading Strategy
High Frequency Trading
5min Scalping Strategy

Shawn Pivots Trend ScalperThis is a script that scans the market for opportunities of breakouts following the trend
requested by trader Shawn

Deviation Bollinger Band On-the-Fly Scalping System (3 Dev's)3 Deviation Bollinger Band On-the-Fly Scalping System
check meangreenmoneymachine.com
read "Scalping Forex with Bollinger Bands & Maximizing Profits by Joseph Wohlers
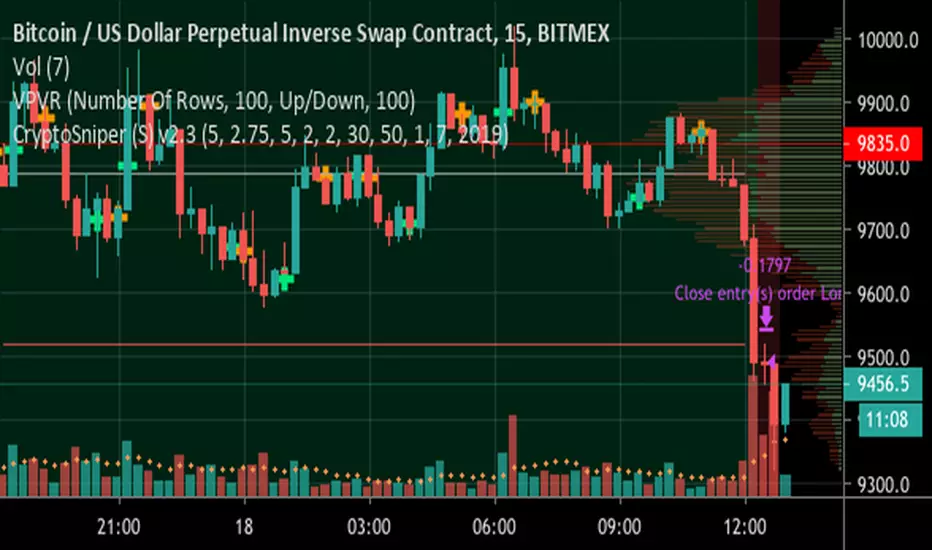
ck - CryptoSniper (Strategy) v2.1This strategy is radically different to the v1 script previously released.
It has ***NO REPAINTING*** - as such the algorithm had to change to remove it’s reliance on HMAs from future timeframes to establish trend, this is now accomplished with EMAs.
It is completely written in Pinescript v4.
It has integrated Stoploss and you can plot this & with the recommended Entry on the chart.
WARNING - This strategy has to be “tuned” to the instrument you are trading, for example, Bitcoin. The default settings work well for BTC/USD, XBT/USD on 15m chart timeframe but not for ETH/USD - it is possible the default settings will work with other crypto’s but I haven’t had time to test - if you find good settings PLEASE share them!
How to use:
1) Load up your favourite chart/instrument and select your favourite timeframe
2) Adjust the “signal” EMA and “baseline” EMA settings until you get the majority of uptrending moves highlighted with a green background and the majority of downtrending moves with a red background. The signal has to be faster (that is a lower number) than the baseline.
3) Adjust the “Sensitivity” - this will plot more green & orange Trigger points on the chart.
The strategy waits until in a trend, for example, a Long (green background) then waits for first green cross before opening a deal. It will Trigger a sell if the background turns red (downtrend) and a orange cross is printed.
4) Fine tuning:
A) Increase your profits by changing the Stoploss value - getting this right protects you from bad trades but also resets the indicator to provide another alert faster
B) You can increase the delay positions are opened or closed with the “Bar(s) offset to open position” and “Bar(s) offset to close position” settings. When you adjust these, 0 will buy/sell immediately when a Trigger cross is printed, 2 will wait until 2 bars/candles AFTER the Trigger cross prints to strat/close a position.
TIP: When adjusting indicator settings, load your chart and timeframe first.
Add the indicator/strategy (if you haven’t already).
Click the Strategy Tester tab at the bottom of the chart window so it is visible.
Open the strategy/indicator settings so you can see this wind AND the Strategy Tester display
Change a setting and click into a different setting input box, this will update the test results WITHOUT closing the settings window! This will save you a lot of time!
Write down any OK settings you find, you can come back later to fine tune them!
Please provide any feedback & let’s share the best settings for different crypto’s!
Sonja D'AlertsThis is a script request by user Sonja,
This script uses the pivots and tradingview oscillators to predict market movements


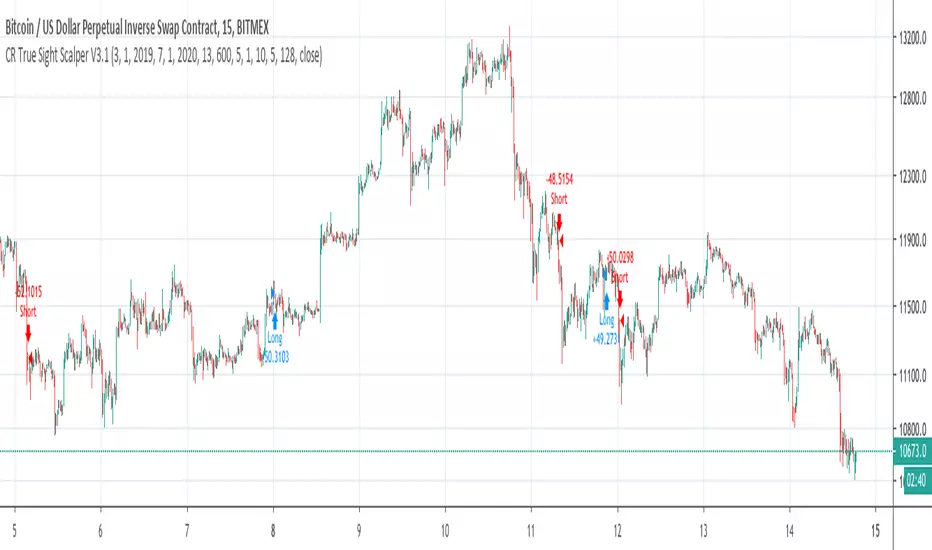
CR True Sight Scalper V3.1True Sight Scalper V3.1 is an incompatible update to V3.0, with much smaller losses.
$100,000 Initial capital.
From 2019-04-04 to 2019-07-14
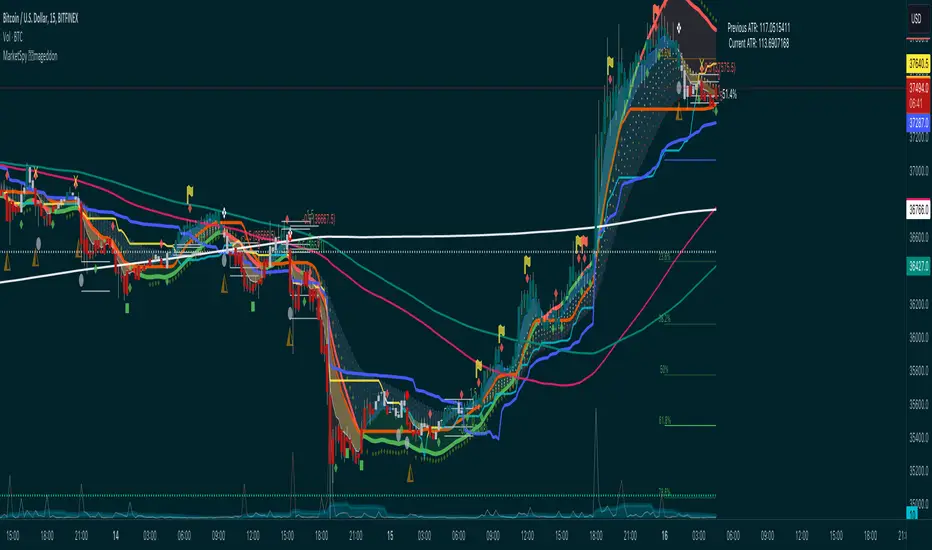
MarketSpy ARmageddonMarketSpy trading suite was designed to sniff out momentum swings and allow you to profit riding the wave. No matter what market, no matter the timeframe - this is all you need, from here on out this is your trading desk.
It's made up of three main components (with future add-ons in development):
1. MarketSpy X - the ultimate entry and exit tool that is built using custom momentum algorithm to find exact moments of reversals - without a fail. It's the one on the bottom with "green pulse dot" buy signals and "blood diamond" sell indicators.
2. MarketSpy ARmageddon (Augmented Reality) - price action overlay that analyses trends and is a confirmation tool for MarketSpy X. Can show confluence from top 5 market indicators, gives signals of reversals or chop zones, predicts prices(!) and is fully dynamic that reacts to market conditions LIVE.
3. MarketSpy S/R - This thing sniffs out and draws support and resistance based on math, not human eye. This means that MarketSpy effectively can go head to head with bots and algorithms and see right through the market to give you incredibly accurate points of interest where machines and humans sell and buy - ride the way together with the whales. Sounds cliche until you try it.
For more - visit our discord.
MarketSpy XMarketSpy trading suite was designed to sniff out momentum swings and allow you to profit riding the wave. No matter what market, no matter the timeframe - this is all you need, from here on out this is your trading desk.
It's made up of three main components (with future add-ons in development):
1. MarketSpy X - the ultimate entry and exit tool that is built using custom momentum algorithm to find exact moments of reversals - without a fail. It's the one on the bottom with "green pulse dot" buy signals and "blood diamond" sell indicators.
2. MarketSpy ARmageddon (Augmented Reality) - price action overlay that analyses trends and is a confirmation tool for MarketSpy X. Can show confluence from top 5 market indicators, gives signals of reversals or chop zones, predicts prices(!) and is fully dynamic that reacts to market conditions LIVE.
3. MarketSpy S/R - This thing sniffs out and draws support and resistance based on math, not human eye. This means that MarketSpy effectively can go head to head with bots and algorithms and see right through the market to give you incredibly accurate points of interest where machines and humans sell and buy - ride the way together with the whales. Sounds cliche until you try it.
For more - visit our discord.

Very easy scalping indicator for non skilled traderThunderScalp is bundled indicator for scalping trader with simple usage and high winning rate. It works for any time frame.
The indicators are:
Humidity Pole Signal is Buy or Sell signal based on Humidity indicator or volume consolidation mapping
Interactive Signal is Buy or Sell signal based on Chart Pattern analyzer
Pivot Support and Resistance is candle support and resistance up to 3 layer for each
Fractal Support and resistance is support and resistance based on fractal candles
Scalping MA is moving average lines which best suite for scalping

GS Signal FilterContact @voke2249 on telegram for access
Used in combination with other indicators to determine entry points
GoldmanTrenderMessage @voke2249 for access
Used in combination with other indicators to identify entry opportunities

Momentum DivergenceTrading Divergence based on Momentum (Indicator below), If you want to make this a strategy i would use all those indicators above for extra confirmation.
"Momentum Divergence" indicator includes the following:
-"Momentum Waves" (blue waves)
-"Stochastic RSI" color change (green/red lines)
-"RSI" (purple line)
-"Money Flow Index" (green/red bar below)
-"Volume Weighted Average Price" ( (yellow/red areas ) (not included yet, but i will include it soon))
Green/Red circles added for possible trend Reversals
Alerts can be set on those Green/Red circles
How to Trade:
Draw Divergence between waves as shown on the chart for LONG/SHORT position (From a Big Wave to a small Wave ... The big Wave MUST be above Blue line in order to draw a divergence line (60 Threshold))
When to Sell:
There is no specific way to exit but with support/resistance zones will help to exit position AND the other indicators will help too (DONT GET GREEDY)
More info:
Since this is a combination of oscillators it should work in any time frame.
-MUST use Heikin Ashi candles.
Coming updates:
-Include VWAP
-Automatic draws divergence between HH HL LH LL waves with pine script version @4


Cyatophilum Scalping Bot V2 [BACKTEST]Improved version of Cyatophilum Scalping Bot
Default settings for BITMEX:XBTUSD
2% stop loss
2% trailing take profit

PA Researcher Perfect Auto-Scalping [NASDAQ]This is PA Researcher Perfect Auto-Scalping Indicator for NQ1!
Amazing Hit Ratio on 3min/5min chart
No Repainting

CR True Sight Scalper V3.0At last, my True Sight Scalper V3.0 is here!
$100,000 Initial capital.
From 3/1/2019 to 7/3/2019.
For 2 weeks of free trial just DM me.
