Balanced Big Wicks (50/50) HighlighterThis open-source indicator highlights candles with balanced long wicks (50/50 style)—that is, candles where both upper and lower shadows are each at least 30–60% of the full range and within ~8% of each other, while retaining a substantial body. This specific structure often reflects indecision or liquidity sweeps and can precede strong breakout moves.
How It Works (Inputs and Logic)
Min wick % (each side): 30–60% of candle range
Max body %: up to 60% of range (preserves strong body presence)
Equality tolerance: wicks within 8% of each other
ATR filter (multiples of ATR14): ensures only significant-range candles are flagged
When a “50/50” candle forms, it’s visually colored and labeled; audibly alertable.
How to Use It
Long setup: price closes above the wick-high → potential long entry (SL below wick-low, TP = 1:1).
Short setup: price closes below wick-low → potential short entry (SL above wick-high, TP = 1:1).
Especially effective on 5–15 minute scalping charts when aligned with high-volume sessions or HTF trend context.
Why This Indicator Is Unique
Unlike standard wick or doji voters, this script specifically filters for candles with a strong body and symmetrical wicks, paired with a range filter, reducing noise significantly.
Important Notes
No unrealistic claims: backtested setups indicate high occurrence of clean breakouts, though performance depends on market structure.
Script built responsibly: uses real-time calculations only, no future-data lookahead.
Visuals on the published chart reflect default input values exactly.
Scalping

Liquidity Swing Points [BackQuant]Liquidity Swing Points
This tool marks recent swing highs and swing lows and turns them into persistent horizontal “liquidity” levels. These are places where resting orders often accumulate, such as stop losses above prior highs and below prior lows. The script detects confirmed pivots, records their prices, draws lines and labels, and manages their lifecycle on the chart so you can monitor potential sweep or breakout zones without manual redrawing.
What it plots
LQ-H at confirmed swing highs
LQ-L at confirmed swing lows
Horizontal levels that can optionally extend into the future
Timed removal of old levels to keep the chart clean
Each level stores its price, the bar where it was created, its type (high or low), plus a label and a line reference for efficient updates.
How it works
Pivot detection
A swing high is confirmed when the highest high has swing_length bars on both sides that are lower.
A swing low is confirmed when the lowest low has swing_length bars on both sides that are higher.
Pivots are only marked after they are confirmed, so they do not repaint.
Level creation
When a pivot confirms, the script records the price and the creation bar (offset by the right lookback).
A new line is plotted at that price, labeled LQ-H or LQ-L.
Rendering and extension
Levels can be drawn to the most recent bar only or extended to the right for forward reference.
Label size and line color/transparency are configurable.
Lifecycle management
On each confirmed bar, the script checks level age.
Levels older than a chosen bar count are removed automatically to reduce clutter.
How it can be used
Liquidity sweeps: Watch for price to probe beyond a level then close back inside. That behavior often signals a potential fade back into the prior range.
Breakout validation: If price pushes through a level and holds on closes, traders may treat that as continuation. Retests of the level from the other side can serve as structure checks.
Context for entries and exits: Use nearby LQ-H or LQ-L as reference for stop placement or partial-take zones, especially when other tools agree.
Multi-timeframe mapping: Plot swing points on higher timeframes, then drill down to time entries on lower timeframes as price interacts with those levels.
Why liquidity levels matter
Prior swing points are focal areas where many strategies set stops or pending orders. Price often revisits these zones, either to “sweep” resting liquidity before reversing, or to absorb it and trend. Marking these areas objectively helps frame scenarios like failed breaks, successful breakouts, and retests, and it reduces the subjectivity of eyeballing structure.
Settings to know
Swing Detection Length (swing_length), Controls sensitivity. Lower values find more local swings. Higher values find more significant ones.
Bars until removal (removeafter), Deletes levels after a fixed number of bars to prevent buildup.
Extend Levels Right (extend_levels), Keeps levels projected into the future for easier planning.
Label Size (label_size), Choose tiny to large for chart readability.
One color input controls both high and low levels with transparency for context.
Strengths
Objective marking of recent structure without hand drawing
No repaint after confirmation since pivots are locked once the right lookback completes
Lightweight and fast with simple lifecycle management
Clear visuals that integrate well with any price-action workflow
Practical tips
For scalping: use smaller swing_length to capture more granular liquidity. Keep removeafter short to avoid clutter.
For swing trading: increase swing_length so only more meaningful levels remain. Consider extending levels to the right for planning.
Combine with time-of-day filters, ATR for stop sizing, or a separate trend filter to bias trades taken at the levels.
Keep screenshots focused: one image showing a sweep and reversal, another showing a clean breakout and retest.
Limitations and notes
Levels appear after confirmation, so they are delayed by swing_length bars. This is by design to avoid repainting.
On very noisy or illiquid symbols, you may see many nearby levels. Increasing swing_length and shortening removeafter helps.
The script does not assess volume or session context. Consider pairing with volume or session tools if that is part of your process.

Smart Money Precision Structure [BullByte]Smart Money Precision Structure
Advanced Market Structure Analysis Using Institutional Order Flow Concepts
---
OVERVIEW
Smart Money Precision Structure (SMPS) is a comprehensive market analysis indicator that combines six analytical frameworks to identify high-probability market structure patterns. The indicator uses multi-dimensional scoring algorithms to evaluate market conditions through institutional order flow concepts, providing traders with professional-grade market analysis.
---
PURPOSE AND ORIGINALITY
Why This Indicator Was Developed
• Addresses the gap between retail and institutional analysis methods
• Consolidates multiple analysis techniques that professionals use separately
• Automates complex market structure evaluation into actionable insights
• Eliminates the need for multiple indicators by providing comprehensive analysis
What Makes SMPS Original
• Six-Layer Confluence System - Unique combination of market regime, structure, volume flow, momentum, price action, and adaptive filtering
• Institutional Pattern Recognition - Identifies smart money accumulation and distribution patterns
• Adaptive Intelligence - Parameters automatically adjust based on detected market conditions
• Real-Time Market Scoring - Proprietary algorithm rates market quality from 0-100%
• Structure Break Detection - Advanced pivot analysis identifies trend reversals early
---
HOW IT WORKS - TECHNICAL METHODOLOGY
1. Market Regime Analysis Engine
The indicator evaluates five core market dimensions:
• Volatility Score - Measures current volatility against 50-period historical baseline
• Trend Score - Analyzes alignment between 8, 21, and 50-period EMAs
• Momentum Score - Combines RSI divergence with MACD signal alignment
• Structure Score - Evaluates pivot point formation clarity
• Efficiency Score - Calculates directional movement efficiency ratio
These scores combine to classify markets into five regimes:
• TRENDING - Strong directional movement with aligned indicators
• RANGING - Sideways movement with mixed directional signals
• VOLATILE - Elevated volatility with unpredictable price swings
• QUIET - Low volatility consolidation periods
• TRANSITIONAL - Market shifting between different regimes
2. Market Structure Analysis
Advanced pivot point analysis identifies:
• Higher Highs and Higher Lows for bullish structure
• Lower Highs and Lower Lows for bearish structure
• Structure breaks when established patterns fail
• Dynamic support and resistance from recent pivot points
• Key level proximity detection using ATR-based buffers
3. Volume Flow Decoding
Institutional activity detection through:
• Volume surge identification when volume exceeds 2x average
• Buy versus sell pressure analysis using price-volume correlation
• Flow strength measurement through directional volume consistency
• Divergence detection between volume and price movements
• Institutional threshold alerts when unusual volume patterns emerge
4. Multi-Period Momentum Synthesis
Weighted momentum calculation across four timeframes:
• 1-period momentum weighted at 40%
• 3-period momentum weighted at 30%
• 5-period momentum weighted at 20%
• 8-period momentum weighted at 10%
Result smoothed with 6-period EMA for noise reduction.
5. Price Action Quality Assessment
Each bar evaluated for:
• Range quality relative to 20-period average
• Body-to-range ratio for directional conviction
• Wick analysis for rejection pattern identification
• Pattern recognition including engulfing and hammer formations
• Sequential price movement analysis
6. Adaptive Parameter System
Parameters automatically adjust based on detected regime:
• Trending markets reduce sensitivity and confirmation requirements
• Volatile markets increase filtering and require additional confirmations
• Ranging markets maintain neutral settings
• Transitional markets use moderate adjustments
---
COMPLETE SETTINGS GUIDE
Section 1: Core Analysis Settings
Analysis Sensitivity (0.3-2.0)
• Default: 1.0
• Lower values require stronger price movements
• Higher values detect more subtle patterns
• Scalpers use 0.8-1.2, swing traders use 1.5-2.0
Noise Reduction Level (2-7)
• Default: 4
• Controls filtering of false patterns
• Higher values reduce pattern frequency
• Increase in volatile markets
Minimum Move % (0.05-0.50)
• Default: 0.15%
• Sets minimum price movement threshold
• Adjust based on instrument volatility
• Forex: 0.05-0.10%, Stocks: 0.15-0.25%, Crypto: 0.20-0.50%
High Confirmation Mode
• Default: True (Enabled)
• Requires all technical conditions to align
• Reduces frequency but increases reliability
• Disable for more aggressive pattern detection
Section 2: Market Regime Detection
Enable Regime Analysis
• Default: True (Enabled)
• Activates market environment evaluation
• Essential for adaptive features
• Keep enabled for best results
Regime Analysis Period (20-100)
• Default: 50 bars
• Determines regime calculation lookback
• Shorter for responsive, longer for stable
• Scalping: 20-30, Swing: 75-100
Minimum Market Clarity (0.2-0.8)
• Default: 0.4
• Quality threshold for pattern generation
• Higher values require clearer conditions
• Lower for more patterns, higher for quality
Adaptive Parameter Adjustment
• Default: True (Enabled)
• Enables automatic parameter optimization
• Adjusts based on market regime
• Highly recommended to keep enabled
Section 3: Market Structure Analysis
Enable Structure Validation
• Default: True (Enabled)
• Validates patterns against support/resistance
• Confirms trend structure alignment
• Essential for reliability
Structure Analysis Period (15-50)
• Default: 30 bars
• Period for structure pattern analysis
• Affects support/resistance calculation
• Match to your trading timeframe
Minimum Structure Alignment (0.3-0.8)
• Default: 0.5
• Required structure score for valid patterns
• Higher values need stronger structure
• Balance with desired frequency
Section 4: Analysis Configuration
Minimum Strength Level (3-5)
• Default: 4
• Minimum confirmations for pattern display
• 5 = Maximum reliability, 3 = More patterns
• Beginners should use 4-5
Required Technical Confirmations (4-6)
• Default: 5
• Number of aligned technical factors
• Higher = fewer but better patterns
• Works with High Confirmation Mode
Pattern Separation (3-20 bars)
• Default: 8 bars
• Minimum bars between patterns
• Prevents clustering and overtrading
• Increase for cleaner charts
Section 5: Technical Filters
Momentum Validation
• Default: True (Enabled)
• Requires momentum alignment
• Filters counter-trend patterns
• Essential for trend following
Volume Confluence Analysis
• Default: True (Enabled)
• Requires volume confirmation
• Identifies institutional participation
• Critical for reliability
Trend Direction Filter
• Default: True (Enabled)
• Only shows patterns with trend
• Reduces counter-trend signals
• Disable for reversal hunting
Section 6: Volume Flow Analysis
Institutional Activity Threshold (1.2-3.5)
• Default: 2.0
• Multiplier for unusual volume detection
• Lower finds more institutional activity
• Stock: 2.0-2.5, Forex: 1.5-2.0, Crypto: 2.5-3.5
Volume Surge Multiplier (1.8-4.5)
• Default: 2.5
• Defines significant volume increases
• Adjust per instrument characteristics
• Higher for stocks, lower for forex
Volume Flow Period (12-35)
• Default: 18 bars
• Smoothing for volume analysis
• Shorter = responsive, longer = smooth
• Match to timeframe used
Section 7: Analysis Frequency Control
Maximum Analysis Points Per Hour (1-5)
• Default: 3
• Limits pattern frequency
• Prevents overtrading
• Scalpers: 4-5, Swing traders: 1-2
Section 8: Target Level Configuration
Target Calculation Method
• Default: Market Adaptive
• Three modes available:
- Fixed: Uses set point distances
- Dynamic: ATR-based calculations
- Market Adaptive: Structure-based levels
Minimum Target/Risk Ratio (1.0-3.0)
• Default: 1.5
• Minimum acceptable reward vs risk
• Higher filters lower probability setups
• Professional standard: 1.5-2.0
Fixed Mode Settings:
• Fixed Target Distance: 50 points default
• Fixed Invalidation Distance: 30 points default
• Use for consistent instruments
Dynamic Mode Settings:
• Dynamic Target Multiplier: 1.8x ATR default
• Dynamic Invalidation Multiplier: 1.0x ATR default
• Adapts to volatility automatically
Market Adaptive Settings:
• Use Structure Levels: True (default)
• Structure Level Buffer: 0.1% default
• Places levels at actual support/resistance
Section 9: Visual Display Settings
Color Theme Options
• Professional (Teal/Red)
- Bullish: Teal (#26a69a)
- Bearish: Red (#ef5350)
- Neutral: Gray (#78909c)
- Best for: Traditional traders, clean appearance
• Dark (Neon Green/Pink)
- Bullish: Neon Green (#00ff88)
- Bearish: Hot Pink (#ff0044)
- Neutral: Dark Gray (#333333)
- Best for: Dark theme users, high contrast
• Light (Green/Red Classic)
- Bullish: Green (#4caf50)
- Bearish: Red (#f44336)
- Neutral: Light Gray (#9e9e9e)
- Best for: Light backgrounds, traditional colors
• Vibrant (Cyan/Magenta)
- Bullish: Cyan (#00ffff)
- Bearish: Magenta (#ff00ff)
- Neutral: Medium Gray (#888888)
- Best for: High visibility, modern appearance
Dashboard Position
• Options: Top Left, Top Right, Bottom Left, Bottom Right, Middle Left, Middle Right
• Default: Top Right
• Choose based on chart layout preference
Dashboard Size
• Full: Complete information display (desktop)
• Mobile: Compact view for small screens
• Default: Full
Analysis Display Style
• Arrows : Simple directional markers
• Labels : Detailed text information
• Zones : Colored areas showing pattern regions
• Default: Labels (most informative)
Display Options:
• Display Analysis Strength: Shows star rating
• Display Target Levels: Shows target/invalidation lines
• Display Market Regime: Shows regime in pattern labels
---
HOW TO USE SMPS - DETAILED GUIDE
Understanding the Dashboard
Top Row - Header
• SMPS Dashboard title
• VALUE column: Current readings
• STATUS column: Condition assessments
Market Regime Row
• Shows: TRENDING, RANGING, VOLATILE, QUIET, or TRANSITIONAL
• Color coding: Green = Favorable, Red = Caution
• Status: FAVORABLE or CAUTION trading conditions
Market Score Row
• Percentage from 0-100%
• Above 60% = Strong conditions
• 40-60% = Moderate conditions
• Below 40% = Weak conditions
Structure Row
• Direction: BULLISH, BEARISH, or NEUTRAL
• Status: INTACT or BREAK
• Orange BREAK indicates structure failure
Volume Flow Row
• Direction: BUYING or SELLING
• Intensity: STRONG or WEAK
• Color indicates dominant pressure
Momentum Row
• Numerical momentum value
• Positive = Upward pressure
• Negative = Downward pressure
Volume Status Row
• INST = Institutional activity detected
• HIGH = Above average volume
• NORM = Normal volume levels
Adaptive Mode Row
• ACTIVE = Parameters adjusting
• STATIC = Fixed parameters
• Shows required confirmations
Analysis Level Row
• Minimum strength level setting
• Pattern separation in bars
Market State Row
• Current analysis: BULLISH, BEARISH, NEUTRAL
• Shows analysis price level when active
T:R Ratio Row
• Current target to risk ratio
• GOOD = Meets minimum requirement
• LOW = Below minimum threshold
Strength Row
• BULL or BEAR dominance
• Numerical strength value 0-100
Price Row
• Current price
• Percentage change
Last Analysis Row
• Previous pattern direction
• Bars since last pattern
Reading Pattern Signals
Bullish Structure Pattern
• Upward triangle or "Bullish Structure" label
• Star rating shows strength (★★★★★ = strongest)
• Green line = potential target level
• Red dashed line = invalidation level
• Appears below price bars
Bearish Structure Pattern
• Downward triangle or "Bearish Structure" label
• Star rating indicates reliability
• Green line = potential target level
• Red dashed line = invalidation level
• Appears above price bars
Pattern Strength Interpretation
• ★★★★★ = 6 confirmations (exceptional)
• ★★★★☆ = 5 confirmations (strong)
• ★★★☆☆ = 4 confirmations (moderate)
• ★★☆☆☆ = 3 confirmations (minimum)
• Below minimum = filtered out
Visual Elements on Chart
Lines and Levels:
• Gray Line = 21 EMA trend reference
• Green Stepline = Dynamic support level
• Red Stepline = Dynamic resistance level
• Green Solid Line = Active target level
• Red Dashed Line = Active invalidation level
Pattern Markers:
• Triangles = Arrow display mode
• Text Labels = Label display mode
• Colored Boxes = Zone display mode
Target Completion Labels:
• "Target" = Price reached target level
• "Invalid" = Pattern invalidated by price
---
RECOMMENDED USAGE BY TIMEFRAME
1-Minute Charts (Scalping)
• Sensitivity: 0.8-1.2
• Noise Reduction: 3-4
• Pattern Separation: 3-5 bars
• High Confirmation: Optional
• Best for: Quick intraday moves
5-Minute Charts (Precision Intraday)
• Sensitivity: 1.0 (default)
• Noise Reduction: 4 (default)
• Pattern Separation: 8 bars
• High Confirmation: Enabled
• Best for: Day trading
15-Minute Charts (Short Swing)
• Sensitivity: 1.0-1.5
• Noise Reduction: 4-5
• Pattern Separation: 10-12 bars
• High Confirmation: Enabled
• Best for: Intraday swings
30-Minute to 1-Hour (Position Trading)
• Sensitivity: 1.5-2.0
• Noise Reduction: 5-7
• Pattern Separation: 15-20 bars
• Regime Period: 75-100
• Best for: Multi-day positions
Daily Charts (Swing Trading)
• Sensitivity: 1.8-2.0
• Noise Reduction: 6-7
• Pattern Separation: 20 bars
• All filters enabled
• Best for: Long-term analysis
---
MARKET-SPECIFIC SETTINGS
Forex Pairs
• Minimum Move: 0.05-0.10%
• Institutional Threshold: 1.5-2.0
• Volume Surge: 1.8-2.2
• Target Mode: Dynamic or Market Adaptive
Stock Indices (ES, NQ, YM)
• Minimum Move: 0.10-0.15%
• Institutional Threshold: 2.0-2.5
• Volume Surge: 2.5-3.0
• Target Mode: Market Adaptive
Individual Stocks
• Minimum Move: 0.15-0.25%
• Institutional Threshold: 2.0-2.5
• Volume Surge: 2.5-3.5
• Target Mode: Dynamic
Cryptocurrency
• Minimum Move: 0.20-0.50%
• Institutional Threshold: 2.5-3.5
• Volume Surge: 3.0-4.5
• Target Mode: Dynamic
• Increase noise reduction
---
PRACTICAL APPLICATION EXAMPLES
Example 1: Strong Trending Market
Dashboard Reading:
• Market Regime: TRENDING
• Market Score: 75%
• Structure: BULLISH, INTACT
• Volume Flow: BUYING, STRONG
• Momentum: +0.45
Interpretation:
• Strong uptrend environment
• Institutional buying present
• Look for bullish patterns as continuation
• Higher probability of success
• Consider using lower sensitivity
Example 2: Range-Bound Conditions
Dashboard Reading:
• Market Regime: RANGING
• Market Score: 35%
• Structure: NEUTRAL
• Volume Flow: SELLING, WEAK
• Momentum: -0.05
Interpretation:
• No clear direction
• Low opportunity environment
• Patterns are less reliable
• Consider waiting for regime change
• Or switch to a range-trading approach
Example 3: Structure Break Alert
Dashboard Reading:
• Previous: BULLISH structure
• Current: Structure BREAK
• Volume: INST flag active
• Momentum: Shifting negative
Interpretation:
• Trend reversal potentially beginning
• Institutional participation detected
• Watch for bearish pattern confirmation
• Adjust bias accordingly
• Increase caution on long positions
Example 4: Volatile Market
Dashboard Reading:
• Market Regime: VOLATILE
• Market Score: 45%
• Adaptive Mode: ACTIVE
• Confirmations: Increased to 6
Interpretation:
• Choppy conditions
• Parameters auto-adjusted
• Fewer but higher quality patterns
• Wider stops may be needed
• Consider reducing position size
Below are a few chart examples of the Smart Money Precision Structure (SMPS) indicator in action.
• Example 1 – Bullish Structure Detection on SOLUSD 5m
• Example 2 – Bearish Structure Detected with Strong Confluence on SOLUSD 5m
---
TROUBLESHOOTING GUIDE
No Patterns Appearing
Check these settings:
• High Confirmation Mode may be too restrictive
• Minimum Strength Level may be too high
• Market Clarity threshold may be too high
• Regime filter may be blocking patterns
• Try increasing sensitivity
Too Many Patterns
Adjust these settings:
• Enable High Confirmation Mode
• Increase Minimum Strength Level to 5
• Increase Pattern Separation
• Reduce Sensitivity below 1.0
• Enable all technical filters
Dashboard Shows "CAUTION"
This indicates:
• Market conditions are unfavorable
• Regime is RANGING or QUIET
• Market score is low
• Consider waiting for better conditions
• Or adjust expectations accordingly
Patterns Not Reaching Targets
Consider:
• Market may be choppy
• Volatility may have changed
• Try Dynamic target mode
• Reduce target/risk ratio requirement
• Check if regime is VOLATILE
---
ALERTS CONFIGURATION
Alert Message Format
Alerts include:
• Pattern type (Bullish/Bearish)
• Strength rating
• Market regime
• Analysis price level
• Target and invalidation levels
• Strength percentage
• Target/Risk ratio
• Educational disclaimer
Setting Up Alerts
• Click Alert button on TradingView
• Select SMPS indicator
• Choose alert frequency
• Customize message if desired
• Alerts fire on pattern detection
---
DATA WINDOW INFORMATION
The Data Window displays:
• Market Regime Score (0-100)
• Market Structure Bias (-1 to +1)
• Bullish Strength (0-100)
• Bearish Strength (0-100)
• Bull Target/Risk Ratio
• Bear Target/Risk Ratio
• Relative Volume
• Momentum Value
• Volume Flow Strength
• Bull Confirmations Count
• Bear Confirmations Count
---
BEST PRACTICES AND TIPS
For Beginners
• Start with default settings
• Use High Confirmation Mode
• Focus on TRENDING regime only
• Paper trade first
• Learn one timeframe thoroughly
For Intermediate Users
• Experiment with sensitivity settings
• Try different target modes
• Use multiple timeframes
• Combine with price action analysis
• Track pattern success rate
For Advanced Users
• Customize per instrument
• Create setting templates
• Use regime information for bias
• Combine with other indicators
• Develop systematic rules
---
IMPORTANT DISCLAIMERS
• This indicator is for educational and informational purposes only
• Not financial advice or a trading system
• Past performance does not guarantee future results
• Trading involves substantial risk of loss
• Always use appropriate risk management
• Verify patterns with additional analysis
• The author is not a registered investment advisor
• No liability accepted for trading losses
---
VERSION NOTES
Version 1.0.0 - Initial Release
• Six-layer confluence system
• Adaptive parameter technology
• Institutional volume detection
• Market regime classification
• Structure break identification
• Real-time dashboard
• Multiple display modes
• Comprehensive settings
## My Final Thoughts
Smart Money Precision Structure represents an advanced approach to market analysis, bringing institutional-grade techniques to retail traders through intelligent automation and multi-dimensional evaluation. By combining six analytical frameworks with adaptive parameter adjustment, SMPS provides comprehensive market intelligence that single indicators cannot achieve.
The indicator serves as an educational tool for understanding how professional traders analyze markets, while providing practical pattern detection for those seeking to improve their technical analysis. Remember that all trading involves risk, and this tool should be used as part of a complete analysis approach, not as a standalone trading system.
- BullByte

Adaptive Valuation [BackQuant]Adaptive Valuation
What this is
A composite, zero-centered oscillator that standardizes several classic indicators and blends them into one “valuation” line. It computes RSI, CCI, Demarker, and the Price Zone Oscillator, converts each to a rolling z-score, then forms a weighted average. Optional smoothing, dynamic overbought and oversold bands, and an on-chart table make the inputs and the final score easy to inspect.
How it works
Components
• RSI with its own lookback.
• CCI with its own lookback.
• DM (Demarker) with its own lookback.
• PZO (Price Zone Oscillator) with its own lookback.
Standardization via z-score
Each component is transformed using a rolling z-score over lookback bars:
z = (value − mean) ÷ stdev , where the mean is an EMA and the stdev is rolling.
This puts all inputs on a comparable scale measured in standard deviations.
Weighted blend
The z-scores are combined with user weights w_rsi, w_cci, w_dm, w_pzo to produce a single valuation series. If desired, it is then smoothed with a selected moving average (SMA, EMA, WMA, HMA, RMA, DEMA, TEMA, LINREG, ALMA, T3). ALMA’s sigma input shapes its curve.
Dynamic thresholds (optional)
Two ways to set overbought and oversold:
• Static : fixed levels at ob_thres and os_thres .
• Dynamic : ±k·σ bands, where σ is the rolling standard deviation of the valuation over dynLen .
Bands can be centered at zero or around the valuation’s rolling mean ( centerZero ).
Visualization and UI
• Zero line at 0 with gradient fill that darkens as the valuation moves away from 0.
• Optional plotting of band lines and background highlights when OB or OS is active.
• Optional candle and background coloring driven by the valuation.
• Summary table showing each component’s current z-score, the final score, and a compact status.
How it can be used
• Bias filter : treat crosses above 0 as bullish bias and below 0 as bearish bias.
• Mean-reversion context : look for exhaustion when the valuation enters the OB or OS region, then watch for exits from those regions or a return toward 0.
• Signal confirmation : use the final score to confirm setups from structure or price action.
• Adaptive banding : with dynamic thresholds, OB and OS adjust to prevailing variability rather than relying on fixed lines.
• Component tuning : change weights to emphasize trend (raise DM, reduce RSI/CCI) or range behavior (raise RSI/CCI, reduce DM). PZO can help in swing environments.
Why z-score blending helps
Indicators often live on different scales. Z-scoring places them on a common, unitless axis, so a one-sigma move in RSI has comparable influence to a one-sigma move in CCI. This reduces scale bias and allows transparent weighting. It also facilitates regime-aware thresholds because the dynamic bands scale with recent dispersion.
Inputs to know
• Component lookbacks : rsilb, ccilb, dmlb, pzolb control each raw signal.
• Standardization window : lookback sets the z-score memory. Longer smooths, shorter reacts.
• Weights : w_rsi, w_cci, w_dm, w_pzo determine each component’s influence.
• Smoothing : maType, smoothP, sig govern optional post-blend smoothing.
• Dynamic bands : dyn_thres, dynLen, thres_k, centerZero configure the adaptive OB/OS logic.
• UI : toggle the plot, table, candle coloring, and threshold lines.
Reading the plot
• Above 0 : composite pressure is positive.
• Below 0 : composite pressure is negative.
• OB region : valuation above the chosen OB line. Risk of mean reversion rises and momentum continuation needs evidence.
• OS region : mirror logic on the downside.
• Band exits : leaving OB or OS can serve as a normalization cue.
Strengths
• Normalizes heterogeneous signals into one interpretable series.
• Adjustable component weights to match instrument behavior.
• Dynamic thresholds adapt to changing volatility and drift.
• Transparent diagnostics from the on-chart table.
• Flexible smoothing choices, including ALMA and T3.
Limitations and cautions
• Z-scores assume a reasonably stationary window. Sharp regime shifts can make recent bands unrepresentative.
• Highly correlated components can overweight the same effect. Consider adjusting weights to avoid double counting.
• More smoothing adds lag. Less smoothing adds noise.
• Dynamic bands recalibrate with dynLen ; if set too short, bands may swing excessively. If too long, bands can be slow to adapt.
Practical tuning tips
• Trending symbols: increase w_dm , use a modest smoother like EMA or T3, and use centerZero dynamic bands.
• Choppy symbols: increase w_rsi and w_cci , consider ALMA with a higher sigma , and widen bands with a larger thres_k .
• Multiday swing charts: lengthen lookback and dynLen to stabilize the scale.
• Lower timeframes: shorten component lookbacks slightly and reduce smoothing to keep signals timely.
Alerts
• Enter and exit of Overbought and Oversold, based on the active band choice.
• Bullish and bearish zero crosses.
Use alerts as prompts to review context rather than as stand-alone trade commands.
Final Remarks
We created this to show people a different way of making indicators & trading.
You can process normal indicators in multiple ways to enhance or change the signal, especially with this you can utilise machine learning to optimise the weights, then trade accordingly.
All of the different components were selected to give some sort of signal, its made out of simple components yet is effective. As long as the user calibrates it to their Trading/ investing style you can find good results. Do not use anything standalone, ensure you are backtesting and creating a proper system.

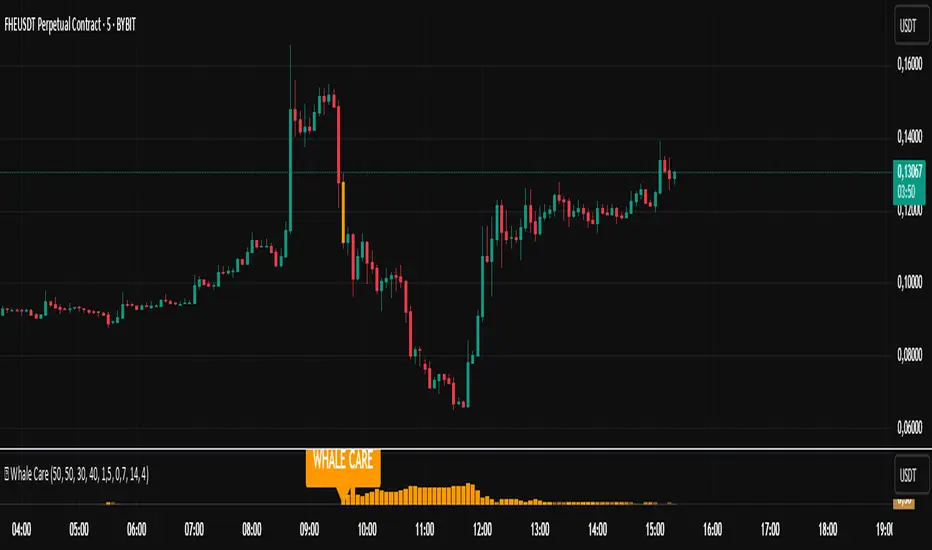
🐋 Whale CareWhale Care 🐋
Indicator for detecting short signals based on the activity of large players ("whales"). Specifically designed for 5 to 15-minute timeframes.
Key Features
🎯 Clear visual signals - orange labels on the chart
📊 Signal strength histogram - measures the power of each signal
⚡ Instant alerts - notifications about large player activity
🏦 Dual filter - analyzes both banking and speculative capital
Optimal Usage
Timeframes: 5M, 10M, 15M
Markets: Stocks, forex, cryptocurrencies
Strategy: Short positions on signal appearance
Signal System
Entry: Orange "WHALE CARE" labels at price peaks
Confirmation: High histogram columns
Filter: Increased market volatility
Default Settings
Optimized for short-term trading:
Banker RSI: period 50
Hot Money: period 40
Volatility threshold: 4.0
Trader Advantages
Fast detection of large orders
Minimal signal delay
Simple visual interpretation
Customizable for individual trading style
A tool for trading decisions, not investment advice
FluidFlow OscillatorFluidFlow Oscillator: Study Material for Traders
Overview
The FluidFlow Oscillator is a custom technical indicator designed to measure price momentum and market flow dynamics by simulating fluid motion concepts such as velocity, viscosity, and turbulence. It helps traders identify potential buy and sell signals along with trend strength, momentum direction, and volatility conditions.
This study explains the underlying calculation concepts, signal logic, visual cues, and how to interpret the professional dashboard table that summarizes key indicator readings.
________________________________________
How the FluidFlow Oscillator Works
Core Mechanisms
1. Price Flow Velocity
o Measures the rate of change of price over a specified flow length (default 40 bars).
o Calculated as a percentage change of closing price: roc=close−closelen_flowcloselen_flow×100\text{roc} = \frac{\text{close} - \text{close}_{len\_flow}}{\text{close}_{len\_flow}} \times 100roc=closelen_flowclose−closelen_flow×100
o Smoothed by an EMA (Exponential Moving Average) to reduce noise, generating a "flow velocity" value.
2. Viscosity Factor
o Analogous to fluid viscosity, it adjusts the flow velocity based on recent price volatility.
o Volatility is computed as the standard deviation of close prices over the flow length.
o The viscosity acts as a damping factor to slow down the flow velocity in highly volatile conditions.
o This results in a "flow with viscosity" value, that smooths out the velocity considering market turbulence.
3. Turbulence Burst
o Captures sudden changes or bursts in the flow by measuring changes between successive viscosity-adjusted flows.
o The turbulence value is a smoothed absolute change in flow.
o A burst boost factor is added to the oscillator to incorporate this rapid change component, amplifying signals during sudden shifts.
4. Oscillator Calculation
o The raw oscillator value is the sum of flow with viscosity plus burst boost, scaled by 10.
o Clamped between -100 and +100 to limit extremes.
o Finally, smoothed again by EMA for cleaner visualization.
________________________________________
Signal Logic
The oscillator works with complementary components to produce actionable signals:
• Signal Line: An EMA-smoothed version of the oscillator for generating crossover-based signals.
• Momentum: The rate of change of the oscillator itself, smoothed by EMA.
• Trend: Uses fast (21-period EMA) and slow (50-period EMA) moving averages of price to identify market trend direction (uptrend, downtrend, or sideways).
Signal Conditions
• Bullish Signal (Buy): Oscillator crosses above the oversold threshold with positive momentum.
• Bearish Signal (Sell): Oscillator crosses below the overbought threshold with negative momentum.
Statuses
The oscillator provides descriptive market states based on level and momentum:
• Overbought
• Oversold
• Buy Signal
• Sell Signal
• Bullish / Bearish (momentum-driven)
• Neutral (no clear trend)
________________________________________
Color System and Visualization
The oscillator uses a sophisticated HSV color model adapting hues according to:
• Oscillator value magnitude and sign (positive or negative)
• Acceleration of oscillator changes
• Smooth color gradients to facilitate intuitive understanding of trend strength and momentum shifts
Background colors highlight overbought (red tint) and oversold (green tint) zones with transparency.
________________________________________
How to Understand the Professional Dashboard Table
The FluidFlow Oscillator offers an integrated table at the bottom center of the chart. This dashboard summarizes critical indicator readings in 8 columns across 3 rows:
Column Description
SIGNAL Current signal status (e.g., Buy, Sell, Overbought) with color coding
OSCILLATOR Current oscillator value (-100 to +100) with color reflecting intensity and direction
MOMENTUM Momentum bias indicating strength/direction of oscillator changes (Strong Up, Up, Sideways, Down, Strong Down)
TREND Current trend status based on EMAs (Strong Uptrend, Uptrend, Sideways, Downtrend, Strong Downtrend)
VOLATILITY Volatility percentage relative to average, indicating market activity level
FLOW Flow velocity value describing price momentum magnitude and direction
TURBULENCE Turbulence level indicating sudden bursts or spikes in price movement
PROGRESS Oscillator's position mapped as a percentage (0% to 100%) showing proximity to extreme levels
Rows Explained
• Row 1 (Header): Labels for each metric.
• Row 2 (Values): Current numerical or descriptive values color-coded along a professional scheme:
o Green or lime tones indicate positive or bullish conditions.
o Red or orange tones indicate caution, sell signals, or bearish conditions.
o Blue tones indicate neutral or stable conditions.
• Row 3 (Status Indicators): Emoji-like icons and bars provide a quick visual gauge of each metric's intensity or signal strength:
o For example, "🟢🟢🟢" suggests very strong bullish momentum, while "🔴🔴🔴" suggests strong bearish momentum.
o Progress bar visually demonstrates oscillator movement toward oversold or overbought extremes.
________________________________________
Practical Interpretation Tips
• A Buy signal with green colors and strong momentum usually precedes upward price moves.
• An Overbought status with red background and red table colors warns of potential price corrections or reversals.
• Watch the Turbulence to gauge market instability; spikes may precede price shocks or volatility bursts.
• Confirm signals with the Trend and Momentum columns to avoid false entries.
• Use the Progress bar to anticipate oscillations approaching key threshold levels for timing trades.
________________________________________
Alerts
The oscillator supports alerts for:
• Buy and sell signals based on oscillator crossovers.
• Overbought and oversold levels reached.
These help traders automate awareness of important market conditions.
________________________________________
Disclaimer
The FluidFlow Oscillator and its signals are for educational and informational purposes only. They do not guarantee profits and should not be considered as financial advice. Always conduct your own research and use proper risk management when trading. Past performance is not indicative of future results.
________________________________________
This detailed explanation should help you understand the workings of the FluidFlow Oscillator, its components, signal logic, and how to analyze its professional dashboard for informed trading decisions.

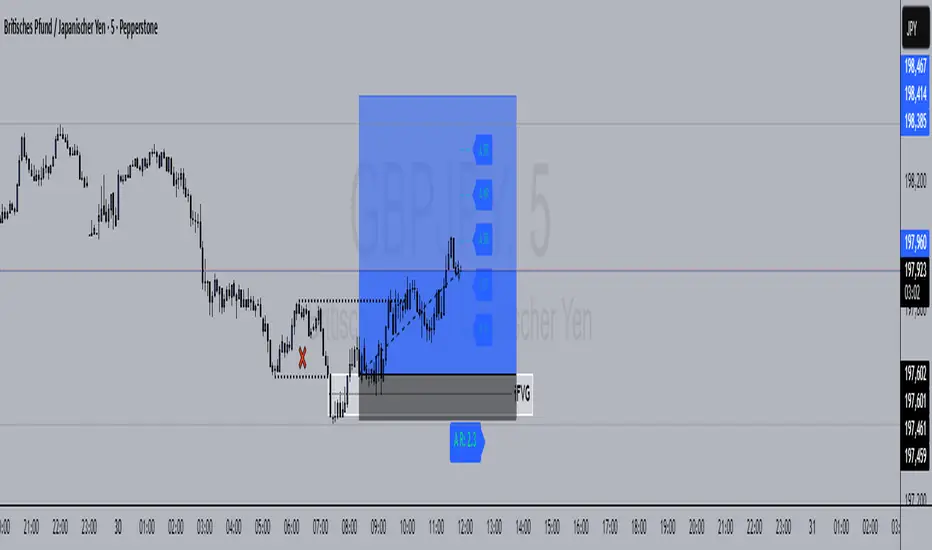
FlowStateTrader FlowState Trader - Advanced Time-Filtered Strategy
## Overview
FlowState Trader is a sophisticated algorithmic trading strategy that combines precision entry signals with intelligent time-based filtering and adaptive risk management. Built for traders seeking to achieve their optimal performance state, FlowState identifies high-probability trading opportunities within user-defined time windows while employing dynamic trailing stops and partial position management.
## Core Strategy Philosophy
FlowState Trader operates on the principle that peak trading performance occurs when three elements align: **Focus** (precise entry signals), **Flow** (optimal time windows), and **State** (intelligent position management). This strategy excels at finding reversal opportunities at key support and resistance levels while filtering out suboptimal trading periods to keep traders in their optimal flow state.
## Key Features
### 🎯 Focus Entry System
**Support/Resistance Zone Trading**:
- Dynamic identification of key price levels using configurable lookback periods
- Entry signals triggered when price interacts with these critical zones
- Volume confirmation ensures genuine breakout/reversal momentum
- Trend filter alignment prevents counter-trend disasters
**Entry Conditions**:
- **Long Signals**: Price closes above support buffer, touches support level, with above-average volume
- **Short Signals**: Price closes below resistance buffer, touches resistance level, with above-average volume
- Optional trend filter using EMA or SMA for directional bias confirmation
### ⏰ FlowState Time Filtering System
**Comprehensive Time Controls**:
- **12-Hour Format Trading Windows**: User-friendly AM/PM time selection
- **Multi-Timezone Support**: UTC, EST, PST, CST with automatic conversion
- **Day-of-Week Filtering**: Trade only weekdays, weekends, or both
- **Lunch Hour Avoidance**: Automatically skips low-volume lunch periods (12-1 PM)
- **Visual Time Indicators**: Background coloring shows active/inactive trading periods
**Smart Time Features**:
- Handles overnight trading sessions seamlessly
- Prevents trades during historically poor performance periods
- Customizable trading hours for different market sessions
- Real-time trading window status in dashboard
### 🛡️ Adaptive Risk Management
**Multi-Level Take Profit System**:
- **TP1**: First profit target with optional partial position closure
- **TP2**: Final profit target for remaining position
- **Flexible Scaling**: Choose number of contracts to close at each level
**Dynamic Trailing Stop Technology**:
- **Three Operating Modes**:
- **Conservative**: Earlier activation, tighter trailing (protect profits)
- **Balanced**: Optimal risk/reward balance (recommended)
- **Aggressive**: Later activation, wider trailing (let winners run)
- **ATR-Based Calculations**: Adapts to current market volatility
- **Automatic Activation**: Engages when position reaches profitability threshold
### 📊 Intelligent Position Sizing
**Contract-Based Management**:
- Configurable entry quantity (1-1000 contracts)
- Partial close quantities for profit-taking
- Clear position tracking and P&L monitoring
- Real-time position status updates
### 🎨 Professional Visualization
**Enhanced Chart Elements**:
- **Entry Zone Highlighting**: Clear visual identification of trading opportunities
- **Dynamic Risk/Reward Lines**: Real-time TP and SL levels with price labels
- **Trailing Stop Visualization**: Live tracking of adaptive stop levels
- **Support/Resistance Lines**: Key level identification
- **Time Window Background**: Visual confirmation of active trading periods
**Dual Dashboard System**:
- **Strategy Dashboard**: Real-time position info, settings status, and current levels
- **Performance Scorecard**: Live P&L tracking, win rates, and trade statistics
- **Customizable Sizing**: Small, Medium, or Large display options
### ⚙️ Comprehensive Customization
**Core Strategy Settings**:
- **Lookback Period**: Support/resistance calculation period (5-100 bars)
- **ATR Configuration**: Period and multipliers for stops/targets
- **Reward-to-Risk Ratios**: Customizable profit target calculations
- **Trend Filter Options**: EMA/SMA selection with adjustable periods
**Time Filter Controls**:
- **Trading Hours**: Start/end times in 12-hour format
- **Timezone Selection**: Four major timezone options
- **Day Restrictions**: Weekend-only, weekday-only, or unrestricted
- **Session Management**: Lunch hour avoidance and custom periods
**Risk Management Options**:
- **Trailing Stop Modes**: Conservative/Balanced/Aggressive presets
- **Partial Close Settings**: Enable/disable with custom quantities
- **Alert System**: Comprehensive notifications for all trade events
### 📈 Performance Tracking
**Real-Time Metrics**:
- Net profit/loss calculation
- Win rate percentage
- Profit factor analysis
- Maximum drawdown tracking
- Total trade count and breakdown
- Current position P&L
**Trade Analytics**:
- Winner/loser ratio tracking
- Real-time performance scorecard
- Strategy effectiveness monitoring
- Risk-adjusted return metrics
### 🔔 Alert System
**Comprehensive Notifications**:
- Entry signal alerts with price and quantity
- Take profit level hits (TP1 and TP2)
- Stop loss activations
- Trailing stop engagements
- Position closure notifications
## Strategy Logic Deep Dive
### Entry Signal Generation
The strategy identifies high-probability reversal points by combining multiple confirmation factors:
1. **Price Action**: Looks for price interaction with key support/resistance levels
2. **Volume Confirmation**: Ensures sufficient market interest and liquidity
3. **Trend Alignment**: Optional filter prevents counter-trend positions
4. **Time Validation**: Only trades during user-defined optimal periods
5. **Zone Analysis**: Entry occurs within calculated buffer zones around key levels
### Risk Management Philosophy
FlowState Trader employs a three-tier risk management approach:
1. **Initial Protection**: ATR-based stop losses set at strategy entry
2. **Profit Preservation**: Trailing stops activate once position becomes profitable
3. **Scaled Exit**: Partial profit-taking allows for both security and potential
### Time-Based Edge
The time filtering system recognizes that not all trading hours are equal:
- Avoids low-volume, high-spread periods
- Focuses on optimal liquidity windows
- Prevents trading during news events (lunch hours)
- Allows customization for different market sessions
## Best Practices and Optimization
### Recommended Settings
**For Scalping (1-5 minute charts)**:
- Lookback Period: 10-20
- ATR Period: 14
- Trailing Stop: Conservative mode
- Time Filter: Major session hours only
**For Day Trading (15-60 minute charts)**:
- Lookback Period: 20-30
- ATR Period: 14-21
- Trailing Stop: Balanced mode
- Time Filter: Extended trading hours
**For Swing Trading (4H+ charts)**:
- Lookback Period: 30-50
- ATR Period: 21+
- Trailing Stop: Aggressive mode
- Time Filter: Disabled or very broad
### Market Compatibility
- **Forex**: Excellent for major pairs during active sessions
- **Stocks**: Ideal for liquid stocks during market hours
- **Futures**: Perfect for index and commodity futures
- **Crypto**: Effective on major cryptocurrencies (24/7 capability)
### Risk Considerations
- **Market Conditions**: Performance varies with volatility regimes
- **Timeframe Selection**: Lower timeframes require tighter risk management
- **Position Sizing**: Never risk more than 1-2% of account per trade
- **Backtesting**: Always test on historical data before live implementation
## Educational Value
FlowState serves as an excellent learning tool for:
- Understanding support/resistance trading
- Learning proper time-based filtering
- Mastering trailing stop techniques
- Developing systematic trading approaches
- Risk management best practices
## Disclaimer
This strategy is for educational and informational purposes only. Past performance does not guarantee future results. Trading involves substantial risk of loss and is not suitable for all investors. Users should thoroughly backtest the strategy and understand all risks before live trading. Always use proper position sizing and never risk more than you can afford to lose.
---
*FlowState Trader represents the evolution of systematic trading - combining classical technical analysis with modern risk management and intelligent time filtering to help traders achieve their optimal performance state through systematic, disciplined execution.*

Price Acceleration Matrix [QuantAlgo]🟢 Overview
The Price Acceleration Matrix indicator is an advanced momentum analysis tool that measures the rate of change in price velocity across multiple timeframes simultaneously. It transforms raw price data into velocity measurements for each timeframe, then calculates the acceleration of these velocities to identify when momentum is building or deteriorating. By analyzing acceleration alignment across all three timeframes, the system can distinguish between strong directional moves (all timeframes accelerating in the same direction) and weak, choppy movements (mixed acceleration signals). This multi-timeframe acceleration matrix provides traders with early warning signals for momentum shifts, trend continuation and reversal opportunities across different timeframes and asset classes.
🟢 How It Works
The indicator employs a three-stage calculation process that transforms price data into actionable acceleration signals. First, it calculates velocity (rate of price change) for each of the three user-defined timeframes by measuring the percentage change in price over the specified lookback periods. These velocity calculations are normalized by their respective timeframe lengths to ensure fair comparison across different periods.
In the second stage, the system calculates acceleration by measuring the change in velocity from one bar to the next for each timeframe, effectively capturing the second derivative of price movement. This acceleration data reveals whether momentum is building (positive acceleration) or deteriorating (negative acceleration) at each timeframe level.
The final stage creates the acceleration matrix score by evaluating alignment across all three timeframes. When all timeframes show positive acceleration, the system averages them for maximum bullish signal strength. When all show negative acceleration, it averages them for maximum bearish signal strength. However, when acceleration signals are mixed across timeframes, the system applies a penalty by dividing the average by two, indicating consolidation or conflicting momentum forces. The resulting signal is then smoothed using an Exponential Moving Average and scaled to the -3 to +3 range using a user-defined threshold parameter.
🟢 How to Use
1. Signal Interpretation and Momentum Analysis
Positive Territory (Above Zero): Indicates accelerating upward momentum with bullish bias and favorable conditions for long positions
Negative Territory (Below Zero): Signals accelerating downward momentum with bearish bias and favorable conditions for short positions
Extreme Levels (±2 to ±3): Represent maximum acceleration alignment across all timeframes, indicating high-probability momentum continuation
Moderate Levels (±1 to ±2): Suggest building momentum with good timeframe alignment but less conviction than extreme readings
Near Zero (-0.5 to +0.5): Indicates mixed signals, consolidation, or momentum exhaustion requiring caution
2. Overbought/Oversold Zone Analysis
Above +2 (Overbought Zone): Markets showing extreme bullish acceleration may be due for profit-taking or short-term pullbacks
Below -2 (Oversold Zone): Markets showing extreme bearish acceleration may present reversal opportunities or bounce potential
Zone Exits: When acceleration retreats from extreme zones, it often signals momentum exhaustion and potential trend changes
🟢 Pro Tips for Trading
→ Early Momentum Detection: Watch for acceleration crossing above zero after periods of negative readings, as this often precedes major price movements by several bars, providing early entry opportunities before traditional indicators signal.
→ Momentum Exhaustion Signals: Exit or take profits when acceleration reaches extreme levels (±2.5 or higher) and begins to decline, even if price continues in the same direction, as momentum deterioration typically precedes price reversals.
→ Acceleration Divergence Strategy: Look for divergences between price highs/lows and acceleration peaks/troughs, as these often signal weakening momentum and potential reversal opportunities before they become apparent on price charts.
→ Threshold Optimization: Adjust the acceleration threshold based on asset volatility - higher thresholds (0.7-1.0) for volatile assets to reduce false signals, lower thresholds (0.3-0.5) for stable assets to maintain sensitivity.
→ Alert-Based Trading: Utilize the built-in alert system for bullish/bearish reversals (±2 level crosses) and trend changes (zero line crosses) to capture momentum shifts without constant chart monitoring, especially effective for swing trading approaches.
→ Risk Management Integration: Reduce position sizes when acceleration readings are weak (below ±1.0) and increase allocation when strong acceleration alignment occurs (above ±2.0), as signal strength correlates directly with probability of successful trades.

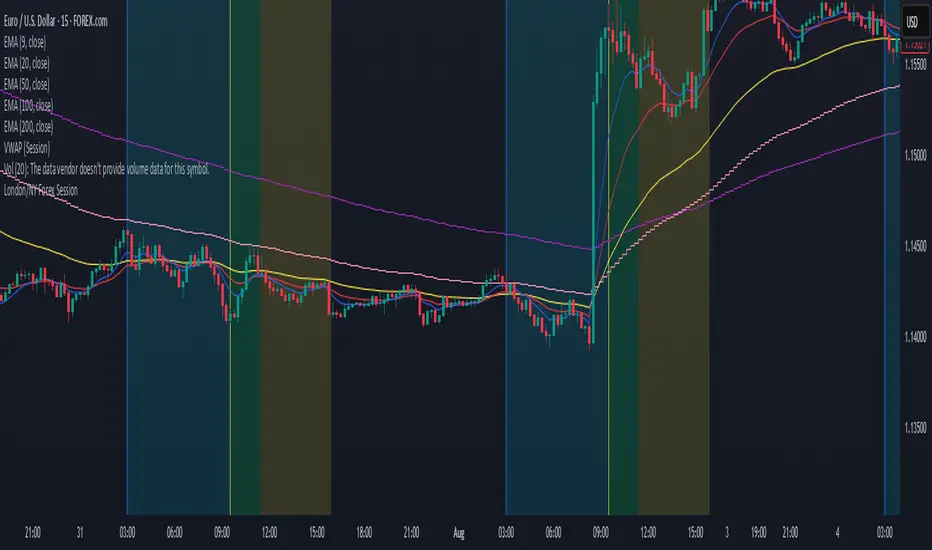
London/NY Forex SessionDesigned for Forex traders who want a clear view of market dynamics.
This tool highlights the most active trading windows of the day, helping you align with institutional moves and avoid low-liquidity periods.
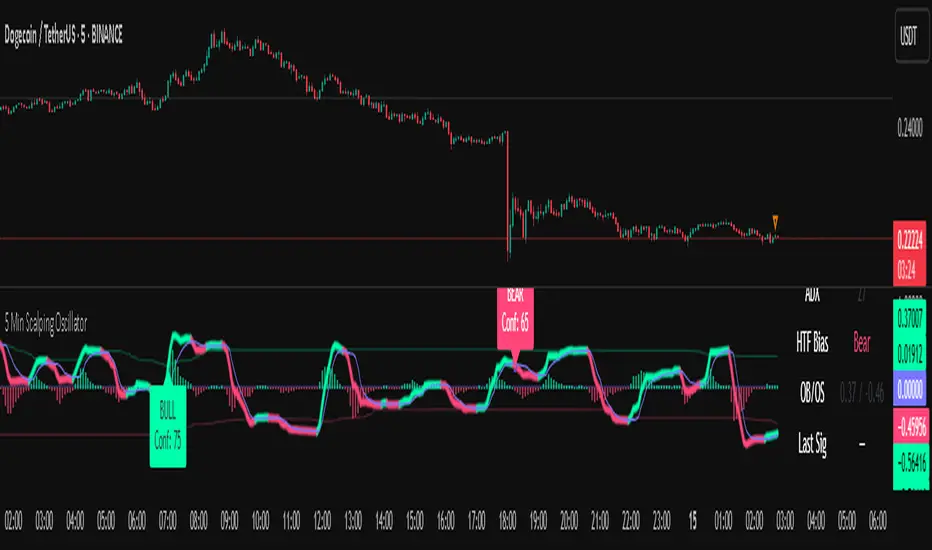
5 Min Scalping Oscillator### Overview
The 5 Min Scalping Oscillator is a custom oscillator designed to provide traders with a unified momentum signal by fusing normalized versions of the Relative Strength Index (RSI), Stochastic RSI, and Commodity Channel Index (CCI). This combination creates a more balanced view of market momentum, overbought/oversold conditions, and potential reversals, while incorporating adaptive smoothing, dynamic thresholds, and market condition filters to reduce noise and false signals. Unlike standalone oscillators, the 5 Min Scalping Oscillator adapts to trending or sideways regimes, volatility levels, and higher timeframe biases, making it particularly suited for short-term charts like 5-minute timeframes where quick, filtered signals are valuable.
### Purpose and Originality of the Fusion
Traditional oscillators like RSI measure momentum but can lag in volatile markets; Stochastic RSI adds sensitivity to RSI extremes but often generates excessive noise; and CCI identifies cyclical deviations but may overreact to minor price swings. The 5 Min Scalping Oscillator addresses these limitations by weighting and blending their normalized outputs (RSI at 45%, Stochastic RSI at 35%, and CCI at 20%) into a single raw oscillator value. This weighted fusion creates a hybrid signal that balances lag reduction with noise filtering, resulting in a more robust indicator for identifying reversal opportunities.
The originality lies in extending this fusion with:
- **Adaptive Smoothing via KAMA (Kaufman's Adaptive Moving Average):** Adjusts responsiveness based on market efficiency, speeding up in trends and slowing in ranges—unlike fixed EMAs, this helps preserve signal integrity without over-smoothing.
- **Dynamic Overbought/Oversold Thresholds:** Calculated using rolling percentiles over a user-defined lookback (default 200+ periods), these levels adapt to recent oscillator behavior rather than relying on static values like 70/30, making the indicator more responsive to asset-specific volatility.
- **Multi-Factor Filters:** Integrates ADX for trend detection, ATR percentiles for volatility confirmation, and optional higher timeframe RSI bias to ensure signals align with broader market context. This layered approach reduces false positives (e.g., ignoring low-volatility crossovers) and adds a confidence score based on filter alignment, which is not typically found in simple mashups.
This design justifies the combination: it's not a mere overlay of indicators but a purposeful integration that enhances usefulness by providing context-aware signals, helping traders avoid common pitfalls like trading against the trend or in low-volatility chop. The result is an original tool that performs better in diverse conditions, especially on 5-minute charts for intraday trading, where rapid adaptations are key.
### How It Works
The 5 Min Scalping Oscillator processes price data through these steps:
1. **Normalization and Fusion:**
- RSI (default length 10) is normalized to a -1 to +1 scale using a tanh transformation for bounded output.
- Stochastic RSI (default length 14) is derived from RSI highs/lows and scaled similarly.
- CCI (default length 14) is tanh-normalized to align with the others.
- These are weighted and summed into a raw value, emphasizing RSI for core momentum while using Stochastic RSI for edge sensitivity and CCI for cycle detection.
2. **Smoothing and Signal Line:**
- The raw value is smoothed (default KAMA with fast/slow periods 2/30 and efficiency length 10) to reduce whipsaws.
- A shorter signal line (half the smoothing length) is added for crossover detections.
3. **Filters and Enhancements:**
- **Trend Regime:** ADX (default length 14, threshold 20) classifies markets as trending (ADX > threshold) or sideways, allowing signals in both but prioritizing alignment.
- **Volatility Check:** ATR (default length 14) percentile (default 85%) ensures signals only trigger in above-average volatility, filtering out flat markets.
- **Higher Timeframe Bias:** Optional RSI (default length 14 on 60-minute timeframe) provides bull/neutral/bear bias (above 55, 45-55, below 45), requiring signal alignment (e.g., bullish signals only if bias is neutral or bull).
- **Dynamic Levels:** Percentiles (default OB 85%, OS 15%) over recent oscillator values set adaptive overbought/oversold lines.
4. **Signal Generation:**
- Bullish (B) signals on upward crossovers of the smoothed line over the signal line, filtered by conditions.
- Bearish (S) signals on downward crossunders.
- Each signal includes a confidence score (0-100) based on factors like trend alignment (25 points), volatility (15 points), and bias (20 points if strong, 10 if neutral).
The output includes a glowing oscillator line, histogram for divergence spotting, dynamic levels, shapes/labels for signals, and a dashboard table summarizing regime, ADX, bias, levels, and last signal.
### How to Use It
This indicator is easy to apply and interpret, even for beginners:
- **Adding to Chart:** Apply the 5 Min Scalping Oscillator to a clean chart (no other indicators unless explained). It's non-overlay, so it appears in a separate pane. For 5-minute timeframes, keep defaults or tweak lengths shorter for faster response (e.g., RSI 8-12).
- **Interpreting Signals:**
- Look for green upward triangles labeled "B" (bullish) at the bottom for potential entry opportunities in uptrends or reversals.
- Red downward triangles labeled "S" (bearish) at the top signal potential exits or shorts.
- Higher confidence scores (e.g., 70+) indicate stronger alignment—use these for priority trades.
- Watch the histogram for divergences (e.g., price higher highs but histogram lower highs suggest weakening momentum).
- Dynamic OB (green line) and OS (red line) help gauge extremes; signals near these are more reliable.
- **Dashboard:** At the bottom-right, it shows real-time info like "Trending" or "Sideways" regime, ADX value, HTF bias (Bull/Neutral/Bear), OB/OS levels, and last signal—use this for quick context.
- **Customization:** Adjust inputs via the settings panel:
- Toggle KAMA for adaptive vs. EMA smoothing.
- Set HTF to "60" for 1-hour bias on 5-min charts.
- Increase ADX threshold to 25 for stricter trend filtering.
- **Best Practices:** Combine with price action (e.g., support/resistance) or volume for confirmation. On 5-min charts, pair with a 1-hour HTF for intraday scalping. Always use stop-losses and risk no more than 1-2% per trade.
### Default Settings Explanation
Defaults are optimized for 5-minute charts on volatile assets like stocks or forex:
- RSI/Stoch/CCI lengths (10/14/14): Shorter for quick momentum capture.
- Signal smoothing (5): Responsive without excessive lag.
- ADX threshold (20): Balances trend detection.
- ATR percentile (0.85): Filters ~15% of low-vol signals.
- HTF RSI (14 on 60-min): Aligns with hourly trends.
- Percentiles (OB 85%, OS 15%): Adaptive to recent data.
If changing, test on historical data to ensure fit—e.g., longer lengths for less noisy assets.
### Disclaimer
The 5 Min Scalping Oscillator is an educational tool to visualize momentum and does not guarantee profits or predict future performance. All signals are based on historical calculations and should not be used as standalone trading advice. Past results are not indicative of future outcomes. Traders must conduct their own analysis, use proper risk management, and consider market conditions. No claims are made about accuracy, reliability, or performance.
Advanced VWAP Multi-MA System with Bollinger Bands & Dashboard📊 Key Features:
Core Functionality:
* VWAP Calculation with customizable anchor periods (Session/Week/Month/Quarter/Year)
* Multiple Moving Average Types (EMA, SMA, WMA, HMA, RMA, VWMA)
* Three MA Lengths (Fast: 9, Medium: 21, Slow: 50)
* Standard Deviation Bands with 3 levels (1σ, 2σ, 3σ)
* Dynamic band multipliers (adjustable from 0.5 to 5.0)
🎨 Visual Theme System:
* Theme Types: Dark, Light, Pro
* Visual Styles: Quantum, Holographic, Crystalline, Plasma, Nebula
* Visual Intensity Control (20-100%)
* Multi-layer Harmonic Nodes with gradient effects
* Energy Flow Lines based on momentum
* Minimal signal dots for buy/sell conditions
📈 Holographic Dashboard:
* Real-time VWAP position tracking
* MA trend analysis (Bullish/Bearish/Neutral)
* Band position indicator (±1σ, ±2σ, ±3σ)
* Volatility percentage
* Momentum direction
* Current visual theme display
✨ Visual Effects:
* Quantum Fields: Multi-layer boxes with dynamic transparency
* Energy Flow: Momentum-based directional lines
* Gradient Fills: Between bands and MAs
* Borderless Design: Clean, modern appearance
* Emoji Headers: Enhanced visual appeal (⚡ 🌌 📊 🔮)
🎯 Trading Signals:
* Bullish Signal: Close > VWAP AND Close > Fast MA AND Fast MA > Medium MA
* Bearish Signal: Close < VWAP AND Close < Fast MA AND Fast MA < Medium MA

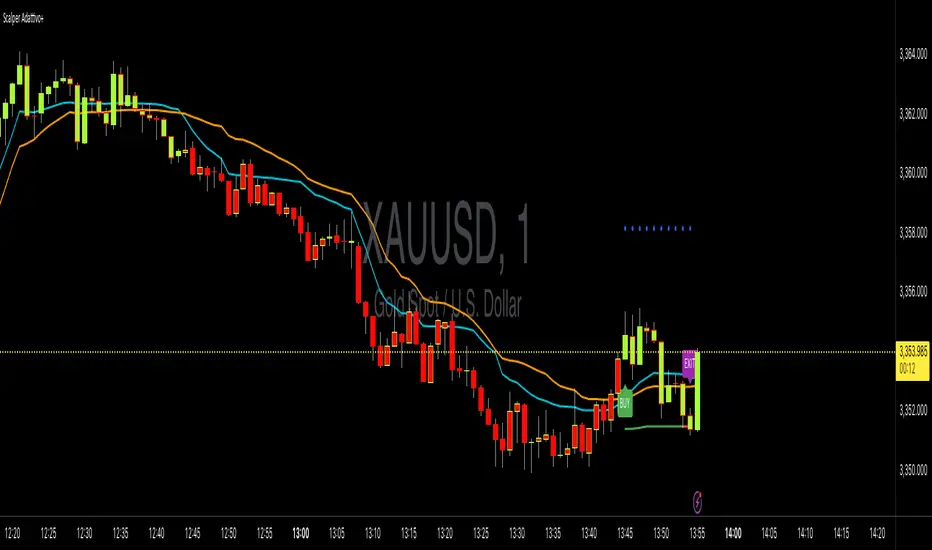
Adaptive Scalping with Take ProfitThis is a comprehensive and adaptive trading system designed specifically for scalping XAUUSD (Gold) on a 3-minute timeframe. Its main feature is that it "adapts" to current market conditions rather than using fixed parameters. It provides clear BUY, SELL, and EXIT signals directly on the chart.
Key Components
1. Adaptive Entry Signal (KAMA)
Instead of using standard moving averages (like EMA or SMA), the entry logic is based on Kaufman's Adaptive Moving Average (KAMA).
How it's adaptive: KAMA automatically adjusts its speed based on market noise. It moves slowly when the market is choppy and sideways, filtering out many false signals. It speeds up when a clear trend emerges, allowing you to enter a move early.
A BUY signal is generated when the faster KAMA crosses above the slower KAMA. A SELL signal is generated on a cross-under.
2. Volatility Filter
The system includes an optional filter that uses the Average True Range (ATR) to measure market volatility.
A trade signal will only appear if the market is volatile enough for scalping. This prevents you from entering trades when the market is flat and there's little opportunity for profit.
3. Dual Exit Strategy (Adaptive)
This is the most advanced part of the system. It gives you two ways to exit a trade to maximize and protect profits:
Dynamic Take Profit: When a trade starts, a profit target (the blue circles) is immediately plotted on the chart. This target is calculated using the ATR, so on a volatile day, the target will be further away. If the price hits this level, it's a signal to take your profits.
ATR Trailing Stop: This is your safety net. It's a stop loss that automatically "trails" behind the price as it moves in your favor (the green/red line). If the market suddenly reverses, the trade is closed when the price hits this trailing stop, locking in any accumulated profit.
An EXIT label appears on the chart as soon as one of these two conditions is met.
4. On-Chart Visuals
BUY/SELL/EXIT Labels: Clear, unmissable labels appear to show you exactly when to enter and exit.
Bar Coloring: The chart candles are colored green when the trend is bullish (fast KAMA > slow KAMA) and red when the trend is bearish, giving you an instant visual confirmation of the market sentiment.
OctaScalp Precision Pro [By TraderMan]What is OctaScalp Precision Pro ? 🚀
OctaScalp Precision is a powerful scalping indicator designed for fast, short-term trades. It combines eight technical indicators to generate 💪 high-accuracy buy 📗 and sell 📕 signals. Optimized for scalpers, this tool targets small price movements in low timeframes (1M, 5M). With visual lines 📈, labels 🎯, and Telegram alerts 📬, it simplifies quick decision-making, enhances risk management, and tracks trade performance.
What Does It Do? 🎯
Fast Signals: Produces reliable buy/sell signals using a consensus of eight indicators.
Risk Management: Offers automated Take Profit (TP) 🟢 and Stop Loss (SL) 🔴 levels with a 2:1 reward/risk ratio.
Trend Confirmation: Validates short-term trends with a 30-period EMA zone.
Performance Tracking: Records trade success rates (%) and the last 5 trades 📊.
User-Friendly: Displays market strength, signal type, and trade details in a top-right table.
Alerts: Sends Telegram-compatible notifications for new positions and trade results 📲.
How Does It Work? 🛠️
OctaScalp Precision integrates eight technical indicators (RSI, MACD, Stochastic, Momentum, 200-period EMA, Supertrend, CCI, OBV) for robust analysis. Each indicator contributes 0 or 1 point to a bullish 📈 or bearish 📉 score (max 8 points). Signals are generated as follows:
Buy Signal 📗: Bullish score ≥6 and higher than bearish score.
Sell Signal 📕: Bearish score ≥6 and higher than bullish score.
EMA Zone 📏: A zone (default 0.1%) around a 30-period EMA confirms trends. Price staying above or below the zone for 4 bars validates the direction:
Up Direction: Price above zone, color green 🟢.
Down Direction: Price below zone, color red 🔴.
Neutral: Price within zone, color gray ⚪.
Entry/Exit: Entries are triggered on new signals, with TP (2% profit) and SL (1% risk) auto-calculated.
Table & Alerts: Displays market strength (% bull/bear), signal type, entry/TP/SL, and success rate in a table. Telegram alerts provide instant notifications.
How to Use It? 📚
Setup 🖥️:
Add the indicator to TradingView and use default settings or customize (EMA length, zone width, etc.).
Best for low timeframes (1M, 5M).
Signal Monitoring 🔍:
Check the table: Bull Strength 📗 and Bear Strength 📕 percentages indicate signal reliability.
Confirm Buy (📗 BUY) or Sell (📕 SELL) signals when trendSignal is 1 or -1.
Entering a Position 🎯:
Buy: trendSignal = 1, bullish score ≥6, and higher than bearish score, enter at the entry price.
Sell: trendSignal = -1, bearish score ≥6, and higher than bullish score, enter at the entry price.
TP and SL: Follow the green (TP) 🟢 and red (SL) 🔴 lines on the chart.
Exiting 🏁:
If price hits TP, trade is marked ✅ successful; if SL, marked ❌ failed.
Results are shown in the “Last 5 Trades” 📜 section of the table.
Setting Alerts 📬:
Enable alerts in TradingView. Receive Telegram notifications for new positions and trade outcomes.
Position Entry Strategy 💡
Entry Conditions:
For Buy: Bullish score ≥6, trendSignal = 1, price above EMA zone 🟢.
For Sell: Bearish score ≥6, trendSignal = -1, price below EMA zone 🔴.
Check bull/bear strength in the table (70%+ is ideal for strong signals).
Additional Confirmation:
Use on high-volume assets (e.g., BTC/USD, EUR/USD).
Validate signals with support/resistance levels.
Be cautious in ranging markets; false signals may increase.
Risk Management:
Stick to the 2:1 reward/risk ratio (TP 2%, SL 1%).
Limit position size to 1-2% of your account.
Tips and Recommendations 🌟
Best Markets: Ideal for volatile markets (crypto, forex) and low timeframes (1M, 5M).
Settings: Adjust EMA length (default 30) or zone width (0.1%) based on the market.
Backtesting: Test on historical data to evaluate success rate 📊.
Discipline: Follow signals strictly and avoid emotional decisions.
OctaScalp Precision makes scalping fast, precise, and reliable! 🚀

AI-Powered ScalpMaster Pro [By TraderMan]🧠 AI-Powered ScalpMaster Pro How It Works
📊 What Is the Indicator and What Does It Do?
🧠 AI-Powered ScalpMaster Pro is a powerful technical analysis tool designed for scalping (short-term, fast-paced trading) in financial markets such as forex, crypto, or stocks. It combines multiple technical indicators (RSI, MACD, Stochastic, Momentum, EMA, SuperTrend, CCI, and OBV) to identify market trends and generate AI-driven buy (🟢) or sell (🔴) signals. The goal is to help traders seize profitable scalping opportunities with quick and precise decisions. 🚀
Key Features:
🧠 AI-Driven Logic: Analyzes signals from multiple indicators to produce reliable trend signals.
📈 Signal Strength: Displays buy (bull) and sell (bear) signal strength as percentages.
✅ Success Rate: Tracks the performance of the last 5 trades and calculates the success rate.
🎯 Entry, TP, and SL Levels: Automatically sets entry points, take profit (TP), and stop loss (SL) levels.
📏 EMA Zone: Analyzes price movement around the EMA 200 to confirm trend direction.
⚙️ How Does It Work?
The indicator uses a scoring system by combining the following technical indicators:
RSI (14): Evaluates whether the price is in overbought or oversold zones.
MACD (12, 26, 9): Analyzes trend direction and momentum.
Stochastic (%K): Measures the speed of price movement.
Momentum: Checks the price change over the last 10 bars.
EMA 200: Determines the long-term trend direction.
SuperTrend: Tracks trends based on volatility.
CCI (20): Measures price deviation from its normal range.
OBV ROC: Analyzes volume changes.
Each indicator generates a buy (bull) or sell (bear) signal. If 6 or more indicators align in the same direction (e.g., bullScore >= 6 for buy), the indicator produces a strong trend signal:
📈 Strong Buy Signal: bullScore >= 6 and bullScore > bearScore.
📉 Strong Sell Signal: bearScore >= 6 and bearScore > bullScore.
🔸 Neutral: No dominant direction.
Additionally, the EMA Zone feature confirms the trend based on the price’s position relative to a zone around the EMA 200:
Price above the zone and sufficiently distant → Uptrend (UP). 🟢
Price below the zone and sufficiently distant → Downtrend (DOWN). 🔴
Price within the zone → Neutral. 🔸
🖥️ Display on the Chart
Table: A table in the top-right corner shows the status of all indicators (✅ Buy / ❌ Sell), signal strength (as %), success rate, and results of the last 5 trades.
Lines and Labels:
🎯 Entry Level: A gray line at the price level when a new signal is generated.
🟢 TP (Take Profit): A green line showing the take-profit level.
🔴 SL (Stop Loss): A red line showing the stop-loss level.
EMA Zone: The EMA 200 and its surrounding colored zone visualize the trend direction (green: uptrend, red: downtrend, gray: neutral).
📝 How to Use It?
Platform Setup:
Add the indicator to the TradingView platform.
Customize settings as needed (e.g., EMA length, risk/reward ratio).
Monitoring Signals:
Check the table: Look for 📈 STRONG BUY or 📉 STRONG SELL signals to prepare for a trade.
AI Text: Trust signals more when it says "🧠 FULL CONFIDENCE" (success rate ≥ 50%). Be cautious if it says "⚠️ LOW CONFIDENCE."
Entering a Position:
🟢 Buy Signal:
Table shows "📈 STRONG BUY" and bullScore >= 6.
Price is above the EMA Zone (green zone).
Entry: Current price (🎯 entry line).
TP: 2% above the entry price (🟢 TP line).
SL: 1% below the entry price (🔴 SL line).
🔴 Sell Signal:
Table shows "📉 STRONG SELL" and bearScore >= 6.
Price is below the EMA Zone (red zone).
Entry: Current price (🎯 entry line).
TP: 2% below the entry price (🟢 TP line).
SL: 1% above the entry price (🔴 SL line).
Position Management:
If the price hits TP, the trade closes profitably (✅ Successful).
If the price hits SL, the trade closes with a loss (❌ Failed).
Results are updated in the "Last 5 Trades" section of the table.
Risk Management:
Default risk/reward ratio is 1:2 (1% risk, 2% reward).
Always adjust position size based on your capital.
Consider smaller lot sizes for "⚠️ LOW CONFIDENCE" signals.
💡 Tips
Timeframe: Use 1-minute, 5-minute, or 15-minute charts for scalping.
Market Selection: Works best in volatile markets (e.g., BTC/USD, EUR/USD).
Confirmation: Ensure the EMA Zone trend aligns with the signal.
Discipline: Stick to TP and SL levels, avoid emotional decisions.
⚠️ Warnings
No indicator is 100% accurate. Always use additional analysis (e.g., support/resistance).
Be cautious during high-volatility periods (e.g., news events).
The success rate is based on past performance and does not guarantee future results.
E³ ROC (slope): SMAsThis is a very powerful script for helping you understand the speed of moves. It measures the RATE OF CHANGE (ROC in %) of 5 key moving averages from the 10 to the 200. For example, a chart with a 200sma ROC of 0.3% usually corresponds to a faster moving asset (stock, crypto, etc) which likely also has a higher ATR and ADR%.
Additionally, the indicator shows you the maximum the slope has performed within the last 126 bars (6 months on a daily chart) (or period of your preference). This helps you understand what you could potentially expect from the asset.
For example, a 10sma which shows a max ROC of 1.5% on a chart with a 200sma max ROC of 0.3%, has therefore the potential for large bursts comparatively (5x the 200sma in this case) and helps you understand that the stock/asset has the potential for leaps and bounds.
For high-growth stock swing traders, a 200sma slope of 0.25% is a great minimum criteria, and having at least 5x for the max on the faster smas such as the 10 or 20 or even 50.
Interestingly, on a slow stock, such as NYSE:WMT (max 200sma = 0.18%), it can have runs of 0.78% as indicated by the max of the 10sma. This reading tells you that although it's a slower stock, it can act like a monster when it's got the heat.
Typically, a stock's ADR% is about 8x to 12x the max ROC of the 200sma (10x easy rule of thumb). So for traders who only like to trade high ADR% stocks, overlooking a stock like NYSE:WMT with a 1.5% ADR and a 200sma ROC of only 0.18% could be a mistake if you didn't notice that the 10sma and 20sma show MAX ROC runs of almost 0.8% (the equivalent of a 8% ADR& stock). So clearly in that situation, knowing all this would allow you to take a breakout or the likes on NYSE:WMT with the intention of capturing the High ROC shorter term run.
Bottom line: this insight is indispensable for short term swing traders, and this script likely has similarly profound use to day traders, FOREX traders, and crypto traders as well.
Being able to know the rate of change (slope) of price change on a stock across different speeds (MAs) allows you to better assess the potential for hidden or outright opportunity.
PURCHASE NOW:
payhip.com

Smart Trend Signals [QuantAlgo]🟢 Overview
The Smart Trend Signals indicator is created to address a fundamental challenge in technical analysis: generating timely trend signals while adapting to varying market volatility conditions. The indicator distinguishes itself by employing volatility-adjusted calculations that automatically modify signal sensitivity based on current market conditions, rather than using fixed parameters that perform inconsistently across different market environments. By processing Long and Short signals through separate dynamic calculation engines, each optimized for its respective directional bias, the indicator reduces the common issue of delayed or conflicting signals that plague many traditional trend-following tools. Additionally, the integration of linear regression-based trend confirmation adds another layer of signal validation, helping to filter market noise while maintaining responsiveness to genuine price movements. This adaptive approach makes the indicator practical for both traders and investors across different asset classes and timeframes, from short-term forex/crypto scalping to long-term equity position analysis.
🟢 How It Works
The indicator uses a straightforward calculation process that combines volatility measurement with momentum detection to generate directional signals. The system first calculates Average True Range (ATR) over a user-defined period to measure current market volatility. This ATR value is then multiplied by the Smart Trend Multiplier setting to create dynamic reference levels that expand during volatile periods and contract during calmer market conditions.
For signal generation, the indicator maintains separate calculation paths for Long/Buy and Short/Sell opportunities. Long signals are generated when price moves above a dynamically calculated level below the current price, confirmed by an exponential moving average crossover in the same direction. Short signals work in reverse, triggering when price moves below a calculated level above the current price, also requiring EMA confirmation. This dual-path approach allows each signal type to operate with parameters suited to its directional bias.
🟢 How to Use
Long Signals (Green Labels): Appear as "Long" labels below price bars when the indicator detects upward price momentum above the calculated reference level, confirmed by EMA crossover. These signals identify moments when price action demonstrates bullish characteristics based on the volatility-adjusted calculations.
Short Signals (Red Labels): Display as "Short" labels above price bars when downward price momentum below the reference level is detected and confirmed by EMA crossover. These signals highlight instances where price action exhibits bearish characteristics according to the indicator's mathematical framework.
Customizable Bar Coloring: This feature colors individual price bars to match the current signal direction. When enabled, each bar reflects the indicator's current directional bias, creating a continuous visual representation of trend periods across the chart timeline.
Built-in Alert System: Provides automatic notifications for new signals with detailed exchange and ticker information. The alert system monitors the indicator's calculations continuously and triggers notifications when new long or short signals are generated, allowing traders/investors to track multiple instruments simultaneously.
🟢 Pro Tips for Trading and Investing
→ Parameter Adjustment: Higher Smart Trend Multiplier settings generate fewer signals that may be more selective, while lower settings produce more frequent signals that may include more false positives. Test different settings to find what works for your trading style and market conditions.
→ Timeframe Analysis: Using higher timeframes for general trend direction and lower timeframes for entry timing is a common approach.
→ Risk Management: No indicator eliminates the need for proper risk management. Use appropriate position sizing and stop-loss strategies regardless of signal quality or frequency.
→ Market Conditions: The indicator may perform differently in trending versus ranging markets. Frequent signal changes might indicate choppy conditions. Backtest and paper trade before risking real capital.

Mayfair Fx Scalper✅ Mayfair FX Scalper — By EastWave Capital
The Mayfair FX Scalper is a precision-focused, closed-source indicator designed for short-term intraday trading, particularly scalping on lower timeframes such as 1-minute, 3-minute, and 5-minute charts. This tool is developed by EastWave Capital and is based on a combination of Relative Strength Index (RSI) extremes and specific candlestick structure patterns to detect potential exhaustion and reversal points in the market.
🔍 How It Works:
The algorithm operates by evaluating three core elements:
RSI Extremes:
RSI is calculated using default settings.
Buy signals are considered only when the RSI on the previous candle is below 22 (oversold), and the current candle is bullish, while the previous one was bearish.
Sell signals are considered when the RSI on the previous candle is above 78 (overbought), and the current candle is bearish, while the previous one was bullish.
Candle Confirmation Logic:
The system waits for candle confirmation (e.g., shift in bullish/bearish structure) rather than triggering signals based on RSI alone.
This avoids false triggers in strong trends and filters weak entries.
SL/TP Estimation (Visual):
While not automatically placing orders, the indicator can optionally display lines or small labels showing a Stop Loss at the previous swing high/low (±0.5) and TP levels at 1R, 2R, and 3R based on that stop.
These visual aids help traders plan risk/reward and exits manually.
📈 How to Use:
Timeframes: Best suited for 1M, 3M, and 5M charts
Markets: Works well on Gold (XAU/USD), Forex majors, Indices, and Crypto
Session: Performs best during high volatility sessions (London & NY)
Use Case:
Wait for a signal label to appear after a clear momentum move.
Confirm price action and trend context.
Use provided visual SL/TP labels or apply your manual RR planning.
Combine with structure breaks, FVG zones, or liquidity sweeps for confluence.
⚠️ Important Notes:
This indicator does not repaint.
No automatic trades are executed. Signals are visual.
Not intended for use in isolation; best when combined with proper trade management and confirmation tools.
Past performance does not guarantee future results. Always manage risk appropriately

Ultimate Scalping Strategy v2Strategy Overview
This is a versatile scalping strategy designed primarily for low timeframes (like 1-min, 3-min, or 5-min charts). Its core logic is based on a classic EMA (Exponential Moving Average) crossover system, which is then filtered by the VWAP (Volume-Weighted Average Price) to confirm the trade's direction in alignment with the market's current intraday sentiment.
The strategy is highly customizable, allowing traders to add layers of confirmation, control trade direction, and manage exits with precision.
Core Strategy Logic
The strategy's entry signals are generated when two primary conditions are met simultaneously:
Momentum Shift (EMA Crossover): It looks for a crossover between a fast EMA (default length 9) and a slow EMA (default length 21).
Buy Signal: The fast EMA crosses above the slow EMA, indicating a potential shift to bullish momentum.
Sell Signal: The fast EMA crosses below the slow EMA, indicating a potential shift to bearish momentum.
Trend/Sentiment Filter (VWAP): The crossover signal is only considered valid if the price is on the "correct" side of the VWAP.
For a Buy Signal: The price must be trading above the VWAP. This confirms that, on average, buyers are in control for the day.
For a Sell Signal: The price must be trading below the VWAP. This confirms that sellers are generally in control.
Confirmation Filters (Optional)
To increase the reliability of the signals and reduce false entries, the strategy includes two optional confirmation filters:
Price Action Filter (Engulfing Candle): If enabled (Use Price Action), the entry signal is only valid if the crossover candle is also an "engulfing" candle.
A Bullish Engulfing candle is a large green candle that completely "engulfs" the body of the previous smaller red candle, signaling strong buying pressure.
A Bearish Engulfing candle is a large red candle that engulfs the previous smaller green candle, signaling strong selling pressure.
Volume Filter (Volume Spike): If enabled (Use Volume Confirmation), the entry signal must be accompanied by a surge in volume. This is confirmed if the volume of the entry candle is greater than its recent moving average (default 20 periods). This ensures the move has strong participation behind it.
Exit Strategy
A position can be closed in one of three ways, creating a comprehensive exit plan:
Stop Loss (SL): A fixed stop loss is set at a level determined by a multiple of the Average True Range (ATR). For example, a 1.5 multiplier places the stop 1.5 times the current ATR value away from the entry price. This makes the stop dynamic, adapting to market volatility.
Take Profit (TP): A fixed take profit is also set using an ATR multiplier. By setting the TP multiplier higher than the SL multiplier (e.g., 2.0 for TP vs. 1.5 for SL), the strategy aims for a positive risk-to-reward ratio on each trade.
Exit on Opposite Signal (Reversal): If enabled, an open position will be closed automatically if a valid entry signal in the opposite direction appears. For example, if you are in a long trade and a valid short signal occurs, the strategy will exit the long position immediately. This feature turns the strategy into more of a reversal system.
Key Features & Customization
Trade Direction Control: You can enable or disable long and short trades independently using the Allow Longs and Allow Shorts toggles. This is useful for trading in harmony with a higher-timeframe trend (e.g., only allowing longs in a bull market).
Visual Plots: The strategy plots the Fast EMA, Slow EMA, and VWAP on the chart for easy visualization of the setup. It also plots up/down arrows to mark where valid buy and sell signals occurred.
Dynamic SL/TP Line Plotting: A standout feature is that the strategy automatically draws the exact Stop Loss and Take Profit price lines on the chart for every active trade. These lines appear when a trade is entered and disappear as soon as it is closed, providing a clear visual of your risk and reward targets.
Alerts: The script includes built-in alertcondition calls. This allows you to create alerts in TradingView that can notify you on your phone or execute trades automatically via a webhook when a long or short signal is generated.

Time-Price Velocity [QuantAlgo]🟢 Overview
The Time-Price Velocity indicator uses advanced velocity-based analysis to measure the rate of price change normalized against typical market movement, creating a dynamic momentum oscillator that identifies market acceleration patterns and momentum shifts. Unlike traditional momentum indicators that focus solely on price change magnitude, this indicator incorporates time-weighted displacement calculations and ATR normalization to create a sophisticated velocity measurement system that adapts to varying market volatility conditions.
This indicator displays a velocity signal line that oscillates around zero, with positive values indicating upward price velocity and negative values indicating downward price velocity. The signal incorporates acceleration background columns and statistical normalization to help traders identify momentum shifts and potential reversal or continuation opportunities across different timeframes and asset classes.
🟢 How It Works
The indicator's key insight lies in its time-price velocity calculation system, where velocity is measured using the fundamental physics formula:
velocity = priceChange / timeWeight
The system normalizes this raw velocity against typical price movement using Average True Range (ATR) to create market-adjusted readings:
normalizedVelocity = typicalMove > 0 ? velocity / typicalMove : 0
where "typicalMove = ta.atr(lookback)" provides the baseline for normal price movement over the specified lookback period.
The Time-Price Velocity indicator calculation combines multiple sophisticated components. First, it calculates acceleration as the change in velocity over time:
acceleration = normalizedVelocity - normalizedVelocity
Then, the signal generation applies EMA smoothing to reduce noise while preserving responsiveness:
signal = ta.ema(normalizedVelocity, smooth)
This creates a velocity-based momentum indicator that combines price displacement analysis with statistical normalization, providing traders with both directional signals and acceleration insights for enhanced market timing.
🟢 How to Use
1. Signal Interpretation and Threshold Zones
Positive Values (Above Zero): Time-price velocity indicating bullish momentum with upward price displacement relative to normalized baseline
Negative Values (Below Zero): Time-price velocity indicating bearish momentum with downward price displacement relative to normalized baseline
Zero Line Crosses: Velocity transitions between bullish and bearish regimes, indicating potential trend changes or momentum shifts
Upper Threshold Zone: Area above positive threshold (default 1.0) indicating strong bullish velocity and potential reversal point
Lower Threshold Zone: Area below negative threshold (default -1.0) indicating strong bearish velocity and potential reversal point
2. Acceleration Analysis and Visual Features
Acceleration Columns: Background histogram showing velocity acceleration (the rate of change of velocity), with green columns indicating accelerating velocity and red columns indicating decelerating velocity. The interpretation depends on trend context: red columns in downtrends indicate strengthening bearish momentum, while red columns in uptrends indicate weakening bullish momentum
Acceleration Column Height: The height of each column represents the magnitude of acceleration, with taller columns indicating stronger acceleration or deceleration forces
Bar Coloring: Optional price bar coloring matches velocity direction for immediate visual trend confirmation
Info Table: Real-time display of current velocity and acceleration values with trend arrows and change indicators
3. Additional Features:
Confirmed vs Live Data: Toggle between confirmed (closed) bar analysis for stable signals or current bar inclusion for real-time updates
Multi-timeframe Adaptability: Velocity normalization ensures consistent readings across different chart timeframes and asset volatilities
Alert System: Built-in alerts for threshold crossovers and direction changes
🟢 Examples with Preconfigured Settings
Default : Balanced configuration suitable for most timeframes and general trading applications, providing optimal balance between sensitivity and noise filtering for medium-term analysis.
Scalping : High sensitivity setup with shorter lookback period and reduced smoothing for ultra-short-term trades on 1-15 minute charts, optimized for capturing rapid momentum shifts and frequent trading opportunities.
Swing Trading : Extended lookback period with enhanced smoothing and higher threshold for multi-day positions, designed to filter market noise while capturing significant momentum moves on 1-4 hour and daily timeframes.

Parallax Momentum MNQ Strategy# 📈 Parallax Momentum MNQ Strategy
## Overview
The Parallax Momentum MNQ Strategy is a sophisticated support/resistance breakout system specifically designed for Micro Nasdaq futures (MNQ) trading (also works on minis). This strategy combines dynamic level detection with momentum confirmation to identify high-probability entry opportunities while maintaining strict risk management protocols.
## 🎯 Key Features
### Core Strategy Logic
- **Dynamic Support/Resistance Detection**: Automatically identifies key levels using configurable lookback periods
- **Momentum Confirmation**: Volume-based filtering ensures trades align with market momentum
- **ATR-Based Risk Management**: Adaptive stop losses and take profits based on market volatility
- **Dual Entry System**: Both long and short opportunities with limit order execution
### Risk Management
- **ATR-Adaptive Stops**: Stop losses and take profits automatically adjust to market volatility
- **Reward-to-Risk Ratios**: Configurable R:R ratios with default 2:1 minimum
- **Maximum Loss Protection**: Optional daily loss limits to prevent overtrading
- **Session Time Filtering**: Trade only during specified market hours
### Strategy Modes
- **Conservative Mode**: 0.8x risk multiplier for cautious trading
- **Balanced Mode**: Standard 1.0x risk multiplier (default)
- **Aggressive Mode**: 1.2x risk multiplier for active trading
## 📊 Visual Features
### Dashboard Display
- Real-time strategy status and performance metrics
- Current support/resistance levels and ATR values
- Live risk-to-reward ratios for potential trades
- Win rate, profit factor, and drawdown statistics
- Adjustable dashboard size and positioning
### Chart Indicators
- Support and resistance lines with labels
- ATR-based levels (+/-1 ATR and +/-2 ATR)
- Dynamic visual updates as levels change
- Configurable line extensions and styling
## ⚙️ Configuration Options
### Entry Filters
- **Volume Filter**: Optional volume confirmation above SMA
- **Session Time Filter**: 12-hour format time restrictions
- **ATR vs Fixed Stops**: Choose between adaptive or fixed tick-based exits
### Risk Controls
- **ATR Period**: Default 14-period ATR calculation
- **Stop Loss Multiplier**: ATR-based stop distance (default 1.5x)
- **Take Profit Multiplier**: ATR-based target distance (default 1.5x)
- **Secondary Take Profit**: Optional TP2 with position scaling
## 📋 How It Works
### Entry Conditions
**Long Trades**: Triggered when price closes above support buffer but low touches support level, with volume and session confirmation
**Short Trades**: Triggered when price closes below resistance buffer but high touches resistance level, with volume and session confirmation
### Exit Strategy
- **Primary Take Profit**: ATR-based target with 2:1 R:R minimum
- **Stop Loss**: ATR-based protective stop
- **Optional TP2**: Extended target for partial profit taking
- **One Trade at a Time**: No overlapping positions
## 🎛️ Default Settings
- **Lookback Period**: 20 bars for support/resistance detection
- **ATR Period**: 14 bars for volatility calculation
- **Stop Loss**: 1.5x ATR from entry
- **Take Profit**: 1.5x ATR with 2:1 reward-to-risk ratio
- **Session**: 7:30 AM - 2:00 PM (configurable)
## ⚠️ Important Notes
### Risk Disclaimer
- This strategy is for educational and informational purposes only
- Past performance does not guarantee future results
- Always use proper position sizing and risk management
- Test thoroughly on historical data before live trading
- Consider market conditions and volatility when using
### Best Practices
- Backtest on sufficient historical data
- Start with conservative mode for new users
- Monitor performance regularly and adjust parameters as needed
- Use appropriate position sizing for your account
- Consider broker commissions and slippage in live trading
## 🔧 Customization
The strategy offers extensive customization options including:
- Adjustable time sessions with AM/PM format
- Configurable ATR and risk parameters
- Optional maximum daily loss limits
- Dashboard size and position controls
- Visual element toggles and styling
## 📈 Ideal For
- MNQ (Micro Nasdaq) futures traders
- Intraday momentum strategies
- Traders seeking systematic entry/exit rules
- Risk-conscious traders wanting automated stops
- Both beginner and experienced algorithmic traders
---
**Version**: Pine Script v5 Compatible
**Timeframe**: Works on multiple timeframes (test on 1m, 3m, 5m, 15m)
**Market**: Optimized for MNQ but adaptable to other instruments
**Strategy Type**: Trend following with momentum confirmation

XRP Scalping with EMA Crossover Anticipation This script is designed to detect scalping opportunities on XRP by anticipating EMA crossovers, reinforced with technical confirmation filters.
Methodology
- The core signal is based on the crossover between a fast EMA (9) and a slow EMA (21).
- RSI (14) conditions are applied to avoid weak setups: RSI must be above 40 for buy signals and below 70 for sell signals.
- Before any crossover is validated, the script requires at least two consecutive “pre-crossover” signals. These indicate favorable momentum and convergence conditions before the crossover occurs.
- Final signals are only displayed if this minimum number of preconditions is met.
Application
This system is optimized for scalping on the 1-minute to 5-minute timeframes but can be adapted for longer-term setups by adjusting parameters. The anticipation logic helps reduce lagging entries and improves signal selectivity during volatile conditions.
Both pre-crossover and confirmed crossover conditions include alert options. The code is fully editable and customizable.
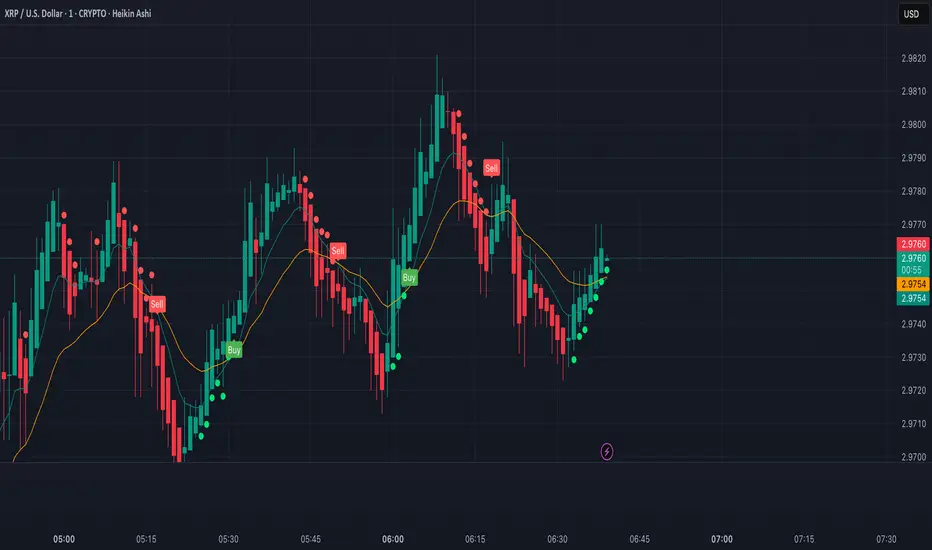
Quality Buy/Sell Indicator with Scalping Mode + SL OnlyQuality Buy/Sell Indicator with Scalping Mode + SL Only is designed for traders who want clean and reliable signals for both swing and scalping strategies.
✅ Features:
Buy & Sell signals based on EMA and MACD logic
Scalping Mode (switch ON for faster, more frequent signals)
SL (Stop Loss) line displayed for every trade for easy risk management
Clean chart – no TP1, TP2, TP3 clutter
Option to show only the latest signal or the entire signal history
✅ How it works:
In normal mode you get fewer, more reliable signals – perfect for intraday or swing trading.
In scalping mode the indicator generates more signals for short-term trades (1–15m charts).
The Show All Signals switch allows you to keep the entire history visible, or only the latest trade setup for maximum clarity.
✅ Best suited for:
Traders who want clean charts without TP lines
Intraday and scalping traders looking for multiple setups per session
Swing traders who prefer clear Buy/Sell with risk control

R Manager PRO++ – Multi-Setup Risk/Reward ToolDescription
The R Manager PRO++ V1.3d is an advanced risk/reward management tool designed for traders who want to visually plan, track, and manage multiple trade setups directly on their charts.
This script allows you to plot up to three independent setups (A, B, and C) simultaneously. For each setup, you can manually input your Entry and Stop Loss levels, and the tool will automatically calculate and display R-multiple levels (1R to 5R), providing a clear overview of your potential profit targets.
Key Features
Multi-Setup Management (A, B, C)
Track up to three separate trades at the same time, each with individual colors and controls.
Manual Entry & Stop Loss Input
Enter your trade levels manually for flexible usage across any market or strategy.
Automatic R-Multiple Calculation (1R to 5R)
The indicator automatically draws lines and labels for 1R to 5R targets based on your risk distance.
Live R Display
Real-time calculation of your current R multiple, updating with every price move.
Custom Symbol Selection
Link each setup to a specific symbol (e.g., EURUSD, XAUUSD, NAS100) to manage multiple markets without clutter.
Reset Function
One-click reset button to quickly clear individual setups.
Alerts for Reached R-Levels
Receive alerts when price reaches each R level (1R to 5R) to monitor trades without constant chart-watching.
How to Use
- Select Entry and Stop Loss levels manually in the input panel.
- Choose the symbol for each setup (supports Forex, Indices, Gold).
- Enable or disable setups individually with the Activate checkbox.
- Optional: Use the Reset button to clear a setup quickly.
- Monitor R-multiples visually and via alerts as price evolves.
Suitable For
- Swing traders
- Day traders
- Risk-based trading strategies (R-multiples)
- Multi-market portfolio management