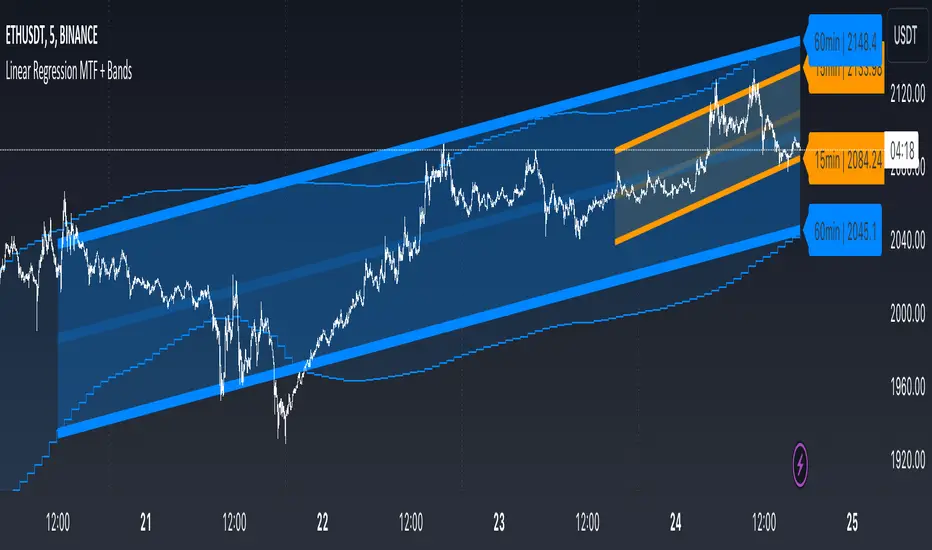
Linear Regression MTF + Bands
Multiple Time Frames (MTFs): The indicator allows you to view linear regression trends over three different time frames (TF1, TF2, TF3) simultaneously. This means a trader can observe short, medium, and long-term trends on a single chart, which is valuable for understanding overall market direction and making cross-timeframe comparisons.
Linear Regression Bands: For each time frame, the indicator calculates linear regression bands. These bands represent the expected price range based on past prices. The middle line is the linear regression line, and the upper and lower lines are set at a specified deviation from this line. Traders can use these bands to spot potential overbought or oversold conditions, or to anticipate future price movements.
History Bands: Looking at linear regression channels can be deceiving if the user does not understand the calculation. In order to see where the channel was at in history the user can display the history bands to see where price actual was in a non-repainting fashion.
Customization Options: Traders can customize various aspects of the indicator, such as whether to display each time frame, the length of the linear regression (how many past data points it considers), and the deviation for the bands. This flexibility allows traders to adapt the indicator to their specific trading style and the asset they are analyzing.
Alerts: The script includes functionality to set alerts based on the price crossing the upper or lower bands of any time frame. This feature helps traders to be notified of potential trading opportunities or risks without constantly monitoring the chart.
Examples
The 15minute linear regression is overlayed onto a 5 minute chart. We are able to see higher timeframe average and extremes. The average is the middle of the channel and the extremes are the outer edges of the bands. The bands are non-repainting meaning that is the actual value of the channel at that place in time.
Here multiple channels are shown at once. We have a linear regression for the 5, 15, and 60 minute charts. If your strategy uses those timeframes you can see the average and overbought/oversold areas without having to flip through charts.
In this example we show just the history bands. The bands could be thought of as a "don't diddle in the middle" area if your strategy is looking for reversals
You can extend the channel into the future via the various input settings.
Cari dalam skrip untuk "市值60亿的股票"
Multi VWAP for Wick HunterCredit: honeybadgermakesfunnymoney for this Open Source Script
Published:
This is a tool that will allow you to visualize Wick Hunter's calcation of VWAP. Wick Hunter uses this calcuation for its Liqudations Bots.
There are four settings that you need to be configured to visualize your VWAP Band:
Long VWAP - The distance from current VWAP price, in %, that price must be UNDER when a liquidation event occurs to meet your you VWAP condition. The higher the value, the more price must move below the current VWAP price for it to enter a LONG position.
Short VWAP - The distance from current VWAP price, in %, that price must be ABOVE when a liquidation event occurs to meet your you VWAP condition. The higher the value, the more price must move above the current VWAP price for it to enter a SHORT position.
VWAP Timeframe - Select the timeframe you want the VWAP to be measured on.
VWAP Periods: Input the time period over which you want the VWAP to be measured over. For example, if you use "5" for this and "15" for VWAP Timeframe. The VWAP will be calculated based on the last five 15 minute candles.
You can play around with these settings using the indicator provide above. The indicator will print a triangle when the conditon for VWAP is met for a long for short trade. Play around with these settings. A few good timeframes that are popular are 5 minute, 15 minute, and one hour (60 minute). As far as periods, the most common settings are between 5 periods and 15 periods. In general the lower the timeframe and periods and closer VWAP will follow price.

MTF Breakout/RetestIntroducing the MTF (Multi Timeframe) Breakout and Retest Indicator:
This indicator is designed to enhance your trading strategy by providing a clear view of support and resistance levels across multiple timeframes. What this simply means is that you can input your levels, and be on a lower timeframe such as the 1 minute timeframe, and are able to see when your support or resistance level has a breakout
📈 Short Trade Breakout Condition:
- Definition: A short breakout occurs when a candle closes below your specified support level on any chosen timeframe.
- Confirmation: It confirms as a valid short signal when a second candle closes below the support level without retesting.
- Visual Clarity: The indicator highlights the timeframe in which this breakout has occurred.
(Long conditions are same but reversed, and will be displayed in color green)
📊 Multi-Timeframe Insights:
- Scope: You can analyze support and resistance levels across various timeframes, including 5, 15, 30, and 60 minutes, while trading on a lower timeframe like 1 minute.
🎨 Dynamic Color-Coding:
- Visual Signaling: The indicator employs color-coding to visually signal breakout events. When a short breakout occurs on any timeframe the timeframe color will highlight red, and vice versa for long will highlight green. The physical line will change color based on the current timeframe you are viewing
- Real-Time Tracking: Colors reset when a level is retested, helping you track market sentiment in real-time.
🪙 Need Your Help
- I am still very much new to coding, and this code is clearly not optimized well. This code was mainly the based idea, and over the next coming months I will be working to enhance the code but I need tradingview help. If you are a coder and see a way to optimize this code please please let me know :)

EphemerisLibrary "Ephemeris"
TODO: add library description here
mercuryElements()
mercuryRates()
venusElements()
venusRates()
earthElements()
earthRates()
marsElements()
marsRates()
jupiterElements()
jupiterRates()
saturnElements()
saturnRates()
uranusElements()
uranusRates()
neptuneElements()
neptuneRates()
rev360(x)
Normalize degrees to within [0, 360)
Parameters:
x (float) : degrees to be normalized
Returns: Normalized degrees
scaleAngle(longitude, magnitude, harmonic)
Scale angle in degrees
Parameters:
longitude (float)
magnitude (float)
harmonic (int)
Returns: Scaled angle in degrees
julianCenturyInJulianDays()
Constant Julian days per century
Returns: 36525
julianEpochJ2000()
Julian date on J2000 epoch start (2000-01-01)
Returns: 2451545.0
meanObliquityForJ2000()
Mean obliquity of the ecliptic on J2000 epoch start (2000-01-01)
Returns: 23.43928
getJulianDate(Year, Month, Day, Hour, Minute)
Convert calendar date to Julian date
Parameters:
Year (int) : calendar year as integer (e.g. 2018)
Month (int) : calendar month (January = 1, December = 12)
Day (int) : calendar day of month (e.g. January valid days are 1-31)
Hour (int) : valid values 0-23
Minute (int) : valid values 0-60
julianCenturies(date, epoch_start)
Centuries since Julian Epoch 2000-01-01
Parameters:
date (float) : Julian date to conver to Julian centuries
epoch_start (float) : Julian date of epoch start (e.g. J2000 epoch = 2451545)
Returns: Julian date converted to Julian centuries
julianCenturiesSinceEpochJ2000(julianDate)
Calculate Julian centuries since epoch J2000 (2000-01-01)
Parameters:
julianDate (float) : Julian Date in days
Returns: Julian centuries since epoch J2000 (2000-01-01)
atan2(y, x)
Specialized arctan function
Parameters:
y (float) : radians
x (float) : radians
Returns: special arctan of y/x
eccAnom(ec, m_param, dp)
Compute eccentricity of the anomaly
Parameters:
ec (float) : Eccentricity of Orbit
m_param (float) : Mean Anomaly ?
dp (int) : Decimal places to round to
Returns: Eccentricity of the Anomaly
planetEphemerisCalc(TGen, planetElementId, planetRatesId)
Compute planetary ephemeris (longtude relative to Earth or Sun) on a Julian date
Parameters:
TGen (float) : Julian Date
planetElementId (float ) : All planet orbital elements in an array. This index references a specific planet's elements.
planetRatesId (float ) : All planet orbital rates in an array. This index references a specific planet's rates.
Returns: X,Y,Z ecliptic rectangular coordinates and R radius from reference body.
calculateRightAscensionAndDeclination(earthX, earthY, earthZ, planetX, planetY, planetZ)
Calculate right ascension and declination for a planet relative to Earth
Parameters:
earthX (float) : Earth X ecliptic rectangular coordinate relative to Sun
earthY (float) : Earth Y ecliptic rectangular coordinate relative to Sun
earthZ (float) : Earth Z ecliptic rectangular coordinate relative to Sun
planetX (float) : Planet X ecliptic rectangular coordinate relative to Sun
planetY (float) : Planet Y ecliptic rectangular coordinate relative to Sun
planetZ (float) : Planet Z ecliptic rectangular coordinate relative to Sun
Returns: Planet geocentric orbital radius, geocentric right ascension, and geocentric declination
mercuryHelio(T)
Compute Mercury heliocentric longitude on date
Parameters:
T (float)
Returns: Mercury heliocentric longitude on date
venusHelio(T)
Compute Venus heliocentric longitude on date
Parameters:
T (float)
Returns: Venus heliocentric longitude on date
earthHelio(T)
Compute Earth heliocentric longitude on date
Parameters:
T (float)
Returns: Earth heliocentric longitude on date
marsHelio(T)
Compute Mars heliocentric longitude on date
Parameters:
T (float)
Returns: Mars heliocentric longitude on date
jupiterHelio(T)
Compute Jupiter heliocentric longitude on date
Parameters:
T (float)
Returns: Jupiter heliocentric longitude on date
saturnHelio(T)
Compute Saturn heliocentric longitude on date
Parameters:
T (float)
Returns: Saturn heliocentric longitude on date
neptuneHelio(T)
Compute Neptune heliocentric longitude on date
Parameters:
T (float)
Returns: Neptune heliocentric longitude on date
uranusHelio(T)
Compute Uranus heliocentric longitude on date
Parameters:
T (float)
Returns: Uranus heliocentric longitude on date
sunGeo(T)
Parameters:
T (float)
mercuryGeo(T)
Parameters:
T (float)
venusGeo(T)
Parameters:
T (float)
marsGeo(T)
Parameters:
T (float)
jupiterGeo(T)
Parameters:
T (float)
saturnGeo(T)
Parameters:
T (float)
neptuneGeo(T)
Parameters:
T (float)
uranusGeo(T)
Parameters:
T (float)
moonGeo(T_JD)
Parameters:
T_JD (float)
mercuryOrbitalPeriod()
Mercury orbital period in Earth days
Returns: 87.9691
venusOrbitalPeriod()
Venus orbital period in Earth days
Returns: 224.701
earthOrbitalPeriod()
Earth orbital period in Earth days
Returns: 365.256363004
marsOrbitalPeriod()
Mars orbital period in Earth days
Returns: 686.980
jupiterOrbitalPeriod()
Jupiter orbital period in Earth days
Returns: 4332.59
saturnOrbitalPeriod()
Saturn orbital period in Earth days
Returns: 10759.22
uranusOrbitalPeriod()
Uranus orbital period in Earth days
Returns: 30688.5
neptuneOrbitalPeriod()
Neptune orbital period in Earth days
Returns: 60195.0
jupiterSaturnCompositePeriod()
jupiterNeptuneCompositePeriod()
jupiterUranusCompositePeriod()
saturnNeptuneCompositePeriod()
saturnUranusCompositePeriod()
planetSineWave(julianDateInCenturies, planetOrbitalPeriod, planetHelio)
Convert heliocentric longitude of planet into a sine wave
Parameters:
julianDateInCenturies (float)
planetOrbitalPeriod (float) : Orbital period of planet in Earth days
planetHelio (float) : Heliocentric longitude of planet in degrees
Returns: Sine of heliocentric longitude on a Julian date

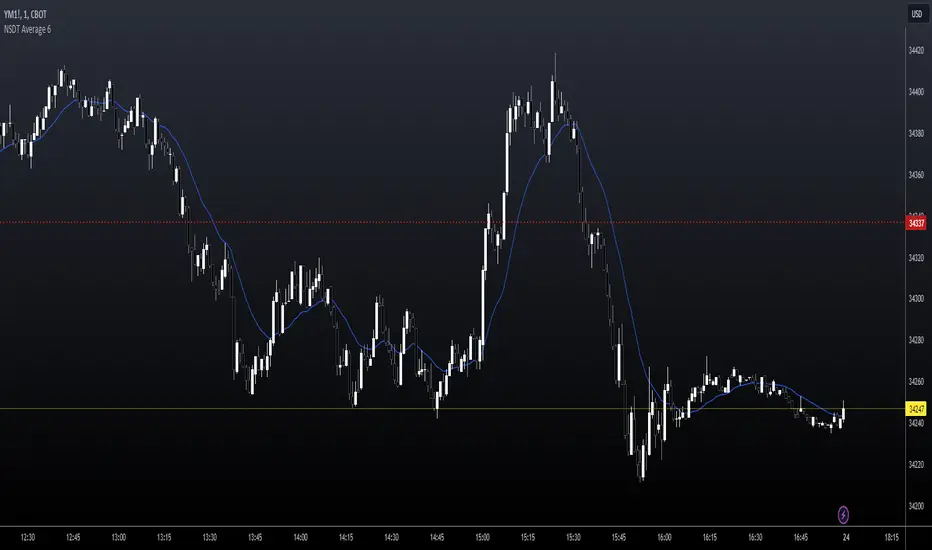
NSDT Average 6This is a pretty simple concept that we were asked to put together. It uses 6 Moving Averages, and takes the average of each one, then averages them all together.
If you don't want to use 6, and only 3 for example, then just enter the same length in two of the input fields as pairs.
Example:
For 6, you could use 10, 20, 30, 40, 50, 60
For 3, you could use 10, 10, 50, 50, 100, 100
It doesn't ploy 6 MA's, it only plots one - the result of the average of an average of an average, etc..
Publishing open source so other can modify as needed.
Statistical Package for the Trading Sciences [SS]
This is SPTS.
It stands for Statistical Package for the Trading Sciences.
Its a play on SPSS (Statistical Package for the Social Sciences) by IBM (software that, prior to Pinescript, I would use on a daily basis for trading).
Let's preface this indicator first:
This isn't so much an indicator as it is a project. A passion project really.
This has been in the works for months and I still feel like its incomplete. But the plan here is to continue to add functionality to it and actually have the Pinecoding and Tradingview community contribute to it.
As a math based trader, I relied on Excel, SPSS and R constantly to plan my trades. Since learning a functional amount of Pinescript and coding a lot of what I do and what I relied on SPSS, Excel and R for, I use it perhaps maybe a few times a week.
This indicator, or package, has some of the key things I used Excel and SPSS for on a daily and weekly basis. This also adds a lot of, I would say, fairly complex math functionality to Pinescript. Because this is adding functionality not necessarily native to Pinescript, I have placed most, if not all, of the functionality into actual exportable functions. I have also set it up as a kind of library, with explanations and tips on how other coders can take these functions and implement them into other scripts.
The hope here is that other coders will take it, build upon it, improve it and hopefully share additional functionality that can be added into this package. Hence why I call it a project. Okay, let's get into an overview:
Current Functions of SPTS:
SPTS currently has the following functionality (further explanations will be offered below):
Ability to Perform a One-Tailed, Two-Tailed and Paired Sample T-Test, with corresponding P value.
Standard Pearson Correlation (with functionality to be able to calculate the Pearson Correlation between 2 arrays).
Quadratic (or Curvlinear) correlation assessments.
R squared Assessments.
Standard Linear Regression.
Multiple Regression of 2 independent variables.
Tests of Normality (with Kurtosis and Skewness) and recognition of up to 7 Different Distributions.
ARIMA Modeller (Sort of, more details below)
Okay, so let's go over each of them!
T-Tests
So traditionally, most correlation assessments on Pinescript are done with a generic Pearson Correlation using the "ta.correlation" argument. However, this is not always the best test to be used for correlations and determine effects. One approach to correlation assessments used frequently in economics is the T-Test assessment.
The t-test is a statistical hypothesis test used to determine if there is a significant difference between the means of two groups. It assesses whether the sample means are likely to have come from populations with the same mean. The test produces a t-statistic, which is then compared to a critical value from the t-distribution to determine statistical significance. Lower p-values indicate stronger evidence against the null hypothesis of equal means.
A significant t-test result, indicating the rejection of the null hypothesis, suggests that there is statistical evidence to support that there is a significant difference between the means of the two groups being compared. In practical terms, it means that the observed difference in sample means is unlikely to have occurred by random chance alone. Researchers typically interpret this as evidence that there is a real, meaningful difference between the groups being studied.
Some uses of the T-Test in finance include:
Risk Assessment: The t-test can be used to compare the risk profiles of different financial assets or portfolios. It helps investors assess whether the differences in returns or volatility are statistically significant.
Pairs Trading: Traders often apply the t-test when engaging in pairs trading, a strategy that involves trading two correlated securities. It helps determine when the price spread between the two assets is statistically significant and may revert to the mean.
Volatility Analysis: Traders and risk managers use t-tests to compare the volatility of different assets or portfolios, assessing whether one is significantly more or less volatile than another.
Market Efficiency Tests: Financial researchers use t-tests to test the Efficient Market Hypothesis by assessing whether stock price movements follow a random walk or if there are statistically significant deviations from it.
Value at Risk (VaR) Calculation: Risk managers use t-tests to calculate VaR, a measure of potential losses in a portfolio. It helps assess whether a portfolio's value is likely to fall below a certain threshold.
There are many other applications, but these are a few of the highlights. SPTS permits 3 different types of T-Test analyses, these being the One Tailed T-Test (if you want to test a single direction), two tailed T-Test (if you are unsure of which direction is significant) and a paired sample t-test.
Which T is the Right T?
Generally, a one-tailed t-test is used to determine if a sample mean is significantly greater than or less than a specified population mean, whereas a two-tailed t-test assesses if the sample mean is significantly different (either greater or less) from the population mean. In contrast, a paired sample t-test compares two sets of paired observations (e.g., before and after treatment) to assess if there's a significant difference in their means, typically used when the data points in each pair are related or dependent.
So which do you use? Well, it depends on what you want to know. As a general rule a one tailed t-test is sufficient and will help you pinpoint directionality of the relationship (that one ticker or economic indicator has a significant affect on another in a linear way).
A two tailed is more broad and looks for significance in either direction.
A paired sample t-test usually looks at identical groups to see if one group has a statistically different outcome. This is usually used in clinical trials to compare treatment interventions in identical groups. It's use in finance is somewhat limited, but it is invaluable when you want to compare equities that track the same thing (for example SPX vs SPY vs ES1!) or you want to test a hypothesis about an index and a leveraged share (for example, the relationship between FNGU and, say, MSFT or NVDA).
Statistical Significance
In general, with a t-test you would need to reference a T-Table to determine the statistical significance of the degree of Freedom and the T-Statistic.
However, because I wanted Pinescript to full fledge replace SPSS and Excel, I went ahead and threw the T-Table into an array, so that Pinescript can make the determination itself of the actual P value for a t-test, no cross referencing required :-).
Left tail (Significant):
Both tails (Significant):
Distributed throughout (insignificant):
As you can see in the images above, the t-test will also display a bell-curve analysis of where the significance falls (left tail, both tails or insignificant, distributed throughout).
That said, I have not included this function for the paired sample t-test because that is a bit more nuanced. But for the one and two tailed assessments, the indicator will provide you the P value.
Pearson Correlation Assessment
I don't think I need to go into too much detail on this one.
I have put in functionality to quickly calculate the Pearson Correlation of two array's, which is not currently possible with the "ta.correlation" function.
Quadratic (Curvlinear) Correlation
Not everything in life is linear, sometimes things are curved!
The Pearson Correlation is great for linear assessments, but tends to under-estimate the degree of the relationship in curved relationships. There currently is no native function to t-test for quadratic/curvlinear relationships, so I went ahead and created one.
You can see an example of how Quadratic and Pearson Correlations vary when you look at CME_MINI:ES1! against AMEX:DIA for the past 10 ish months:
Pearson Correlation:
Quadratic Correlation:
One or the other is not always the best, so it is important to check both!
R-Squared Assessments:
The R-squared value, or the square of the Pearson correlation coefficient (r), is used to measure the proportion of variance in one variable that can be explained by the linear relationship with another variable. It represents the goodness-of-fit of a linear regression model with a single predictor variable.
R-Squared is offered in 3 separate forms within this indicator. First, there is the generic R squared which is taking the square root of a Pearson Correlation assessment to assess the variance.
The next is the R-Squared which is calculated from an actual linear regression model done within the indicator.
The first is the R-Squared which is calculated from a multiple regression model done within the indicator.
Regardless of which R-Squared value you are using, the meaning is the same. R-Square assesses the variance between the variables under assessment and can offer an insight into the goodness of fit and the ability of the model to account for the degree of variance.
Here is the R Squared assessment of the SPX against the US Money Supply:
Standard Linear Regression
The indicator contains the ability to do a standard linear regression model. You can convert one ticker or economic indicator into a stock, ticker or other economic indicator. The indicator will provide you with all of the expected information from a linear regression model, including the coefficients, intercept, error assessments, correlation and R2 value.
Here is AAPL and MSFT as an example:
Multiple Regression
Oh man, this was something I really wanted in Pinescript, and now we have it!
I have created a function for multiple regression, which, if you export the function, will permit you to perform multiple regression on any variables available in Pinescript!
Using this functionality in the indicator, you will need to select 2, dependent variables and a single independent variable.
Here is an example of multiple regression for NASDAQ:AAPL using NASDAQ:MSFT and NASDAQ:NVDA :
And an example of SPX using the US Money Supply (M2) and AMEX:GLD :
Tests of Normality:
Many indicators perform a lot of functions on the assumption of normality, yet there are no indicators that actually test that assumption!
So, I have inputted a function to assess for normality. It uses the Kurtosis and Skewness to determine up to 7 different distribution types and it will explain the implication of the distribution. Here is an example of SP:SPX on the Monthly Perspective since 2010:
And NYSE:BA since the 60s:
And NVDA since 2015:
ARIMA Modeller
Okay, so let me disclose, this isn't a full fledge ARIMA modeller. I took some shortcuts.
True ARIMA modelling would involve decomposing the seasonality from the trend. I omitted this step for simplicity sake. Instead, you can select between using an EMA or SMA based approach, and it will perform an autogressive type analysis on the EMA or SMA.
I have tested it on lookback with results provided by SPSS and this actually works better than SPSS' ARIMA function. So I am actually kind of impressed.
You will need to input your parameters for the ARIMA model, I usually would do a 14, 21 and 50 day EMA of the close price, and it will forecast out that range over the length of the EMA.
So for example, if you select the EMA 50 on the daily, it will plot out the forecast for the next 50 days based on an autoregressive model created on the EMA 50. Here is how it looks on AMEX:SPY :
You can also elect to plot the upper and lower confidence bands:
Closing Remarks
So that is the indicator/package.
I do hope to continue expanding its functionality, but as of now, it does already have quite a lot of functionality.
I really hope you enjoy it and find it helpful. This. Has. Taken. AGES! No joke. Between referencing my old statistics textbooks, trying to remember how to calculate some of these things, and wanting to throw my computer against the wall because of errors in the code, this was a task, that's for sure. So I really hope you find some usefulness in it all and enjoy the ability to be able to do functions that previously could really only be done in external software.
As always, leave your comments, suggestions and feedback below!
Take care!

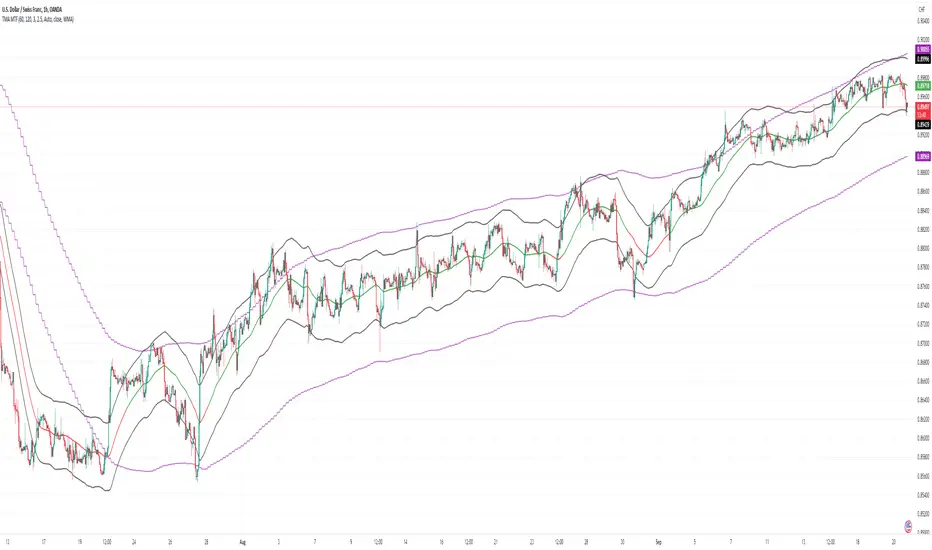
TMA MTFThis indicator plots three different Triple Moving Averages (TMAs) for two different time frames on a price chart:
Middle TMA Line: This is the main TMA line, calculated based on a user-defined number of past bars. It's represented by a solid line on the chart.
Upper TMA Line: This line is calculated by adding a certain multiple of the Average True Range (ATR) to the main TMA line. It helps identify potential resistance levels and is plotted as a solid line.
Lower TMA Line: Similar to the upper line, this line is calculated by subtracting a multiple of the ATR from the main TMA line. It helps identify potential support levels and is also plotted as a solid line.
Additionally, you have the option to overlay these TMA lines on a higher timeframe (HTF) if desired. When you enable this feature, it plots the same three TMA lines but calculated using data from a higher timeframe, which can provide additional context for your trading decisions.
The indicator uses different colors for the TMA lines based on their relationships:
Green: The middle TMA line is above the higher timeframe middle TMA line, suggesting a potential bullish (upward) trend.
Red: The middle TMA line is below the higher timeframe middle TMA line, suggesting a potential bearish (downward) trend.
In addition, it plots the upper and lower TMA lines in shades of purple and maroon, respectively, on the higher timeframe for reference.
Overall, this indicator helps traders identify potential areas of support and resistance and assess the trend direction by comparing the TMA lines of different timeframes.
Variable:
TMA_Period:
This input variable allows you to specify the number of past bars that are used to calculate the main Triple Moving Average (TMA) line. A larger value will result in a smoother TMA line, while a smaller value will make it more responsive to recent price changes.
ATR_Period:
This input variable determines the number of past bars used to calculate the Average True Range (ATR). The ATR is a measure of price volatility. A longer ATR period considers a broader range of price movement, while a shorter period reacts more quickly to recent volatility.
ATR_Multiplier:
This input allows you to set a multiplier for the ATR on the current timeframe. The ATR value is multiplied by this factor to calculate the upper and lower TMA lines. A higher multiplier will result in wider TMA bands, while a lower multiplier will make them narrower.
ATR_Multiplier_HTF:
Similar to ATR_Multiplier, this input sets a multiplier for the ATR on a higher timeframe (HTF). It affects the width of the HTF TMA bands.
TF_1:
This input variable lets you choose the desired higher timeframe (HTF) for the indicator. You can select from various timeframes, including 1 minute, 5 minutes, 15 minutes, 30 minutes, 60 minutes, 240 minutes (4 hours), daily (D), weekly (W), monthly (M), or choose "Auto" to let the script automatically determine the HTF based on the current timeframe.
src:
This input allows you to choose the price source used for calculations. By default, it's set to 'close,' which means the closing prices of each bar are used. You can change this to other price sources like 'open,' 'high,' 'low,' or 'ohlc4' (a combination of open, high, low, and close prices).
ma_type:
This input lets you select the type of moving average used in the calculations. You have three options: Weighted Moving Average (WMA), Double Weighted Moving Average (DWMA), and Triple Weighted Moving Average (TWMA).
Plot_TMA_HTF_Midline:
If set to 'true,' it will plot the middle TMA line of the higher timeframe (HTF) on the chart. If set to 'false,' the HTF middle TMA line will not be displayed.
RSI Trend Detector PSAR BasedRSI Trend Detector is based on the Direction of PSAR. This indicator helps the easy detection of Trend Direction and Sideways Movement of Price. It was difficult to determine the RSI Trend Direction in a basic RSI indicator. one cannot decide the exact entry point where to enter.
RSI Trend Detector helps with the direction of trend using PSAR direction which is almost instant direction changing indicator with Zero Lag. The color of the RSI changes immediately based on PSAR direction. One can determine the trend whether its in UP / Down or Sideways.
One can easily detect Pullback and entry points using this indicator.
The basic working can be interpreted with a normal default RSI, The only additional feature is the direction of trend using a SAR signal.
Oversold Zone is below 30
Overbought Zone is above 70
how ever RSI above 50 is treated a UP trend and Below 50 as Down Trend.
when RSI is between 40 and 60 price must be considered as Sideways. One can easily interpret the TREND.
Yellow Line = RSI Moving Average
RED and Green Line= RSI
Grey Zone = Sideways
Horizontal line = RSI level 50
Settings can be changed as required.
RSI Line:
RSI Above 50 up trend and Entry when color is green
RSI Below 50 down trend and Entry when color is Red
RSI in Grey Zone is sideways, wait for a breakout
RSI above 50 and color is red then its a pullback in uptrend
RSI below 50 and color is green then its a pullback in downtrend
ALERTS:
Up signal and Down Signal are provided when ever RSI crosses RSIMA
Up Signal: RSI crosses RSI Moving Average upwards
Down Signal: RSI crosses RSI Moving Average Downwards
Hope the Tradingview community likes this.

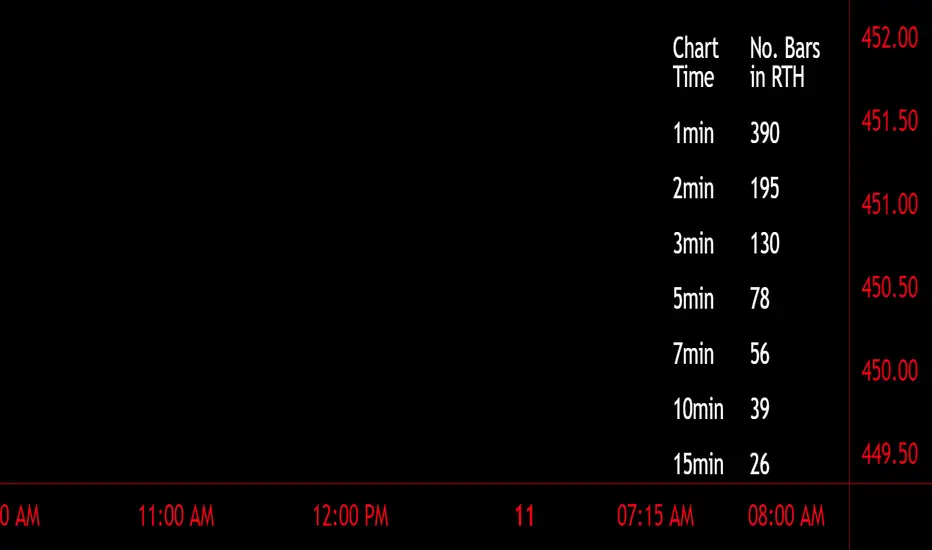
Number of Bars CheatSheetA regular trading day on the New York Stock Exchange (NYSE) consists of two main sessions: the Opening Auction and the Closing Auction, separated by a continuous trading session. Here's a breakdown of the trading day:
1. **Pre-Opening Session**: This session starts at 4:00 AM Eastern Time (ET) and lasts until 9:30 AM ET. During this time, there is limited trading activity, and orders can be entered and canceled. However, most of the trading activity doesn't occur until the regular trading session begins.
2. **Regular Trading Session**: The regular trading session on the NYSE starts at 9:30 AM ET and lasts until 4:00 PM ET. This is the primary trading session where the majority of price bars are formed.
3. **Closing Auction**: After the regular trading session ends at 4:00 PM ET, there is a closing auction period that typically lasts until 4:10 PM ET. During this time, there is a final price discovery process where orders are matched to determine the closing price for each security.
So, during the regular trading session, which is the main focus for most traders and investors, there are a total of 6.5 hours of trading. Trading occurs continuously during this time, with price bars being formed based on the time frame you're looking at. The most common time frames for price bars are one minute, five minutes, 15 minutes, 30 minutes, and one hour, among others. Therefore, the number of price bars in a regular trading day on the NYSE will depend on the time frame you are using for your analysis. For example, if you are using one-minute bars, there will be 6.5 x 60 = 390 price bars in a regular trading day.
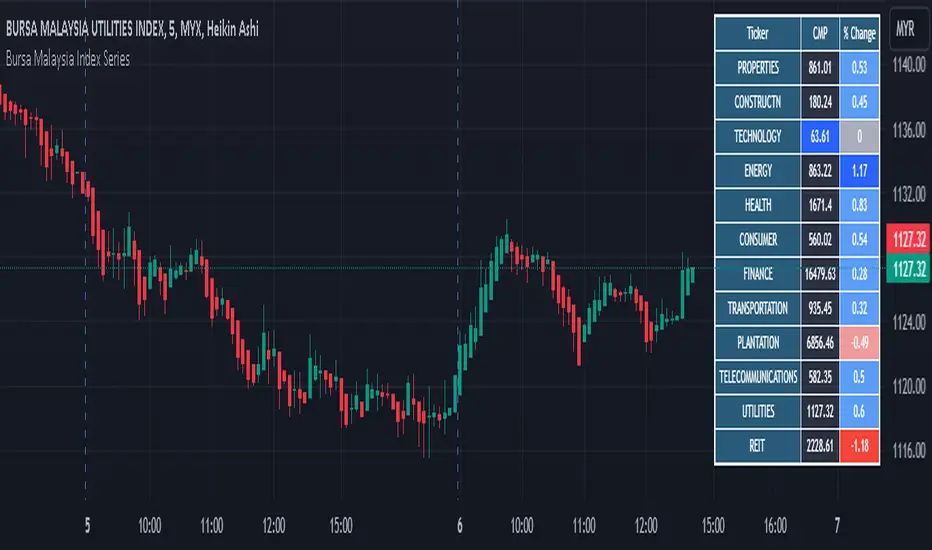
Bursa Malaysia Index SeriesBursa Malaysia Index Series. The index computation is as follows:-
Current aggregate Market Capitalisation/Base Aggregate Market Capitalisation x 100.
The Bursa Malaysia Index Series is calculated and disseminated on a real-time basis at 60-second intervals during Bursa’s trading hours.
External Indicator Analysis Overlay | Buy/Sell | HTF Heikin-AshiThis chart overlay offers multiple candlestick display options. The Regular (Japanese) and the Heikin-Ashi candles are well known. The Mari-Ashi (or Renko) option is something special as it should be timeframe independent, so that sideways action should be represented in one candle. That is difficult to realize as an overlay on the normal candlestick structure, but perhaps the chosen implementation is useful nonetheless. The Velocity option is experimental and is designed to show if the price has accelerated too much in a trend direction. In this case, the highs and lows do not reflect the actual highs and lows, but indicate the overshooting velocity. The opening of the candle also depends on the inherent velocity, but the close of the candle is always the actual close. Anyway, it doesn't look very useful, but the option is there.
All options can be applied to higher timeframes. A usable setting is obtained by disabling only the body of the TradingView candles in regular mode and enabling this overlay.
A large part of this overlay consists of buy/sell indication settings. For activation it is necessary to select an external source. For example the “Relative Bi-Directional Volatility Range”, specifically the Trend Shift Signal (TSS). This signal switches from 0 to 1, if the trend becomes bullish or from 0 to -1, if the trend becomes bearish. It will be automatically detected without specifying the Indication Type. Alternatively, the Volatility Moving Average (VMA) would meet the requirements for the Indication Type “Buy = positive | Sell = negative”. The Moving Average Convergence Divergence (MACD) also fulfills these conditions. Another example is to use any Moving Average with the Indication Type “Buy = rising | Sell = falling”. In the chart above the Hull Moving Average (HMA) is used. In addition, it is possible to reverse the signal, so that positive signals become negative and vice versa. The signals will be labeled as Buy or Sell on the chart.
The user can analyze whether the provided signals are good or bad indications for going long or short or simply for rebalancing a portfolio. Therefore, it is possible to set a starting point for the analysis and choose a weighting for the investments from 0% to 100% of the portfolio. To avoid sleepless nights, a very reliable (and conservative) setting seems to be Rebalancing with 50% (very similar to the well-known 60/40 portfolio). The calculation results are shown in a table.
As a small addition there is the possibility to label the peaks by setting the distance between the highs/lows. This will make the quality of the buy and sell signals even more clear.

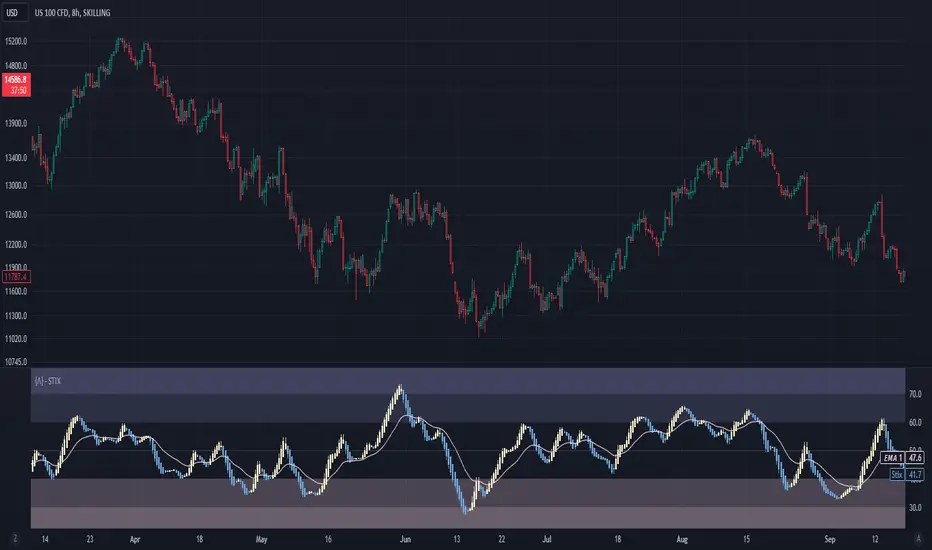
Short Term IndeXThe Short-Term Index (STIX) is a simple market indicator designed to assess short-term overbought or oversold conditions in the stock market. Leveraging a combination of advancing and declining issues, STIX provides valuable insights into market sentiment and potential reversals. To enhance its interpretability and reveal the underlying trend with greater clarity, STIX has been refined through a Heiken-Ashi transformation, ensuring a smoother representation of market dynamics.
Calculation and Methodology:
stix = ta.ema(adv / (adv + dec) * 100, len)
STIX is calculated by dividing the difference between the sum of advancing issues (ADV) by the total number of issues traded (ADV + DEC). This quotient is multiplied by 100 to express the result as a percentage. The STIX index ranges from 0 to 100, where extreme values indicate potential overbought (mainly above 60) or oversold (mainly below 40) market conditions.
Heiken-Ashi Transformation:
By applying a Heiken-Ashi transformation to STIX, the indicator gains improved visual clarity and noise reduction. This transformation enhances the ability to identify trend shifts and potential reversal points, making it an even more valuable tool for traders and investors.
Utility and Use Cases:
-The Short-Term Index (STIX) offers a range of practical applications-
1. Overbought/Oversold Conditions: STIX provides a clear indication of short-term overbought or oversold conditions, helping traders anticipate potential market reversals.
2. Reversal Points: STIX can help pinpoint potential reversal points in short-term market trends, providing traders with opportunities to enter or exit positions.
3. Trend Analysis: By observing STIX values over time, traders can assess the strength and sustainability of short-term trends, aiding in trend-following strategies.
The Short-Term Index (STIX), enhanced by its Heiken-Ashi transformation, equips traders and investors with a tool for assessing short-term market conditions, confirming price movements, and identifying potential reversal points. Its robust methodology and refined presentation contribute to a more comprehensive understanding of short-term market dynamics, enabling traders to make well-informed trading decisions.
See Also:
- Other Market Breadth Indicators-
HighLowBox+220MAs[libHTF]HighLowBox+220MAs
This is a sample script of libHTF to use HTF values without request.security().
import nazomobile/libHTFwoRS/1
HTF candles are calculated internally using 'GMT+3' from current TF candles by libHTF .
To calcurate Higher TF candles, please display many past bars at first.
The advantage and disadvantage is that the data can be generated at the current TF granularity.
Although the signal can be displayed more sensitively, plots such as MAs are not smooth.
In this script, assigned ➊,➋,➌,➍ for htf1,htf2,htf3,htf4.
HTF candles
Draw candles for HTF1-4 on the right edge of the chart. 2 candles for each HTF.
They are updated with every current TF bar update.
Left edge of HTF candles is located at the x-postion latest bar_index + offset.
DMI HTF
ADX/+DI/DI arrows(8lines) are shown each timeframes range.
Current TF's is located at left side of the HighLowBox.
HTF's are located at HighLowBox of HTF candles.
The top of HighLowBox is 100, The bottom of HighLowBox is 0.
HighLowBox HTF
Enclose in a square high and low range in each timeframe.
Shows price range and duration of each box.
In current timeframe, shows Fibonacci Scale inside(23.6%, 38.2%, 50.0%, 61.8%, 76.4%)/outside of each box.
Outside(161.8%,261.8,361.8%) would be shown as next target, if break top/bottom of each box.
In HTF, shows Fibonacci Level of the current price at latest box only.
Boxes:
1 for current timeframe.
4 for higher timeframes.(Steps of timeframe: 5, 15, 60, 240, D, W, M, 3M, 6M, Y)
HighLowBox TrendLine
Draw TrendLine for each HighLow Range. TrendLine is drawn between high and return high(or low and return low) of each HighLowBox.
Style of TrendLine is same as each HighLowBox.
HighLowBox RSI
RSI Signals are shown at the bottom(RSI<=30) or the top(RSI>=70) of HighLowBox in each timeframe.
RSI Signal is color coded by RSI9 and RSI14 in each timeframe.(current TF: ●, HTF1-4: ➊➋➌➍)
In case of RSI<=30, Location: bottom of the HighLowBox
white: only RSI9 is <=30
aqua: RSI9&RSI14; <=30 and RSI9RSI14
green: only RSI14 <=30
In case of RSI>=70, Location: top of the HighLowBox
white: only RSI9 is >=70
yellow: RSI9&RSI14; >=70 and RSI9>RSI14
orange: RSI9&RSI14; >=70 and RSI9=70
blue/green and orange/red could be a oversold/overbought sign.
20/200 MAs
Shows 20 and 200 MAs in each TFs(tfChart and 4 Higher).
TFs:
current TF
HTF1-4
MAs:
20SMA
20EMA
200SMA
200EMA

Indicator Based Market Exposure (IBME)The Indicator Based Market Exposure (IBME) system was created by Big Wave Chartist as a way to navigate the markets using a confluence of three different signals to determine when the "internals" of the market are in your favor and how heavily invested to be at any point. The idea of the system is also to flash warning signs when the market internals are beginning to deteriorate so as to take a defensive stance. Of course this system can be strictly adhered to, or it can be incorporated into a more discretionary style of trading, and be combined with progressive exposure into (and out of) the market as positions gain (or lose) traction.
The IBME displays a straightforward action signal based on the combination of the 3 separate signals:
Green 🟢 Full size-longs permitted
Yellow 🟡 Pilot positions permitted
Red 🔴 No longs allowed
So let's get into the signals used:
McClellan Summation Index
Net New Highs/Lows
Net New Highs Crossover
McClellan Summation Index (MSI)
The McClellan Summation Index is a long-term version of the McClellan Oscillator, which is a market breadth indicator based on stock advances and declines. Interpretation is similar to that of the McClellan Oscillator, except that it is more suited to intermediate to major trends and related reversals. The McClellan Summation Index can be calculated as the sum of all the daily values of the McClellan Oscillator. This is used along with the 10-sma to watch for a crossover indicating an uptrend or downtrend beginning.
Net New Highs/Lows
This is the net number of stocks making 52-week highs or lows. For instance, if there are 60 new 52-week highs and 20 new 52-week lows, the net number will be 40 net new 52 week highs. This signal is particularly useful in gauging breadth.
Net New Highs Crossover
This is the description of NNHC from the original separate version of this indicator created by HikoStory: "Net New Highs can guide you to increase or decrease your exposure based on the current market health. They are calculated by subtracting the new highs from the new lows, based on all stocks of the...NASDAQ. A positive value shows that the market is doing good, since more stocks are making new highs compared to new lows. A negative value shows that the market is doing bad, since more stocks are making new lows compared to new highs. Combined with a moving average you can see crossovers that can warn you early when there is a change in the current market health."
The default index for the IBME is the Nasdaq.
The IBME is meant to be used on a daily time frame chart, therefore the signal will only show on a daily time frame chart.
Display options include:
Show/hide individual signals
Table background/font color
Table size/placement

Average Range LinesThis Average Range Lines indicator identifies high and low price levels based on a chosen time period (day, week, month, etc.) and then uses a simple moving average over the length of the lookback period chosen to project support and resistance levels, otherwise referred to as average range. The calculation of these levels are slightly different than Average True Range and I have found this to be more accurate for intraday price bounces.
Lines are plotted and labeled on the chart based on the following methodology:
+3.0: 3x the average high over the chosen timeframe and lookback period.
+2.5: 2.5x the average high over the chosen timeframe and lookback period.
+2.0: 2x the average high over the chosen timeframe and lookback period.
+1.5: 1.5x the average high over the chosen timeframe and lookback period.
+1.0: The average high over the chosen timeframe and lookback period.
+0.5: One-half the average high over the chosen timeframe and lookback period.
Open: Opening price for the chosen time period.
-0.5: One-half the average low over the chosen timeframe and lookback period.
-1.0: The average low over the chosen timeframe and lookback period.
-1.5: 1.5x the average low over the chosen timeframe and lookback period.
-2.0: 2x the average low over the chosen timeframe and lookback period.
-2.5: 2.5x the average low over the chosen timeframe and lookback period.
-3.0: 3x the average low over the chosen timeframe and lookback period.
Look for price to find support or resistance at these levels for either entries or to take profit. When price crosses the +/- 2.0 or beyond, the likelihood of a reversal is very high, especially if set to weekly and monthly levels.
This indicator can be used/viewed on any timeframe. For intraday trading and viewing on a 15 minute or less timeframe, I recommend using the 4 hour, 1 day, and/or 1 week levels. For swing trading and viewing on a 30 minute or higher timeframe, I recommend using the 1 week, 1 month, or longer timeframes. I don’t believe this would be useful on a 1 hour or less timeframe, but let me know if the comments if you find otherwise.
Based on my testing, recommended lookback periods by timeframe include:
Timeframe: 4 hour; Lookback period: 60 (recommend viewing on a 5 minute or less timeframe)
Timeframe: 1 day; Lookback period: 10 (also check out 25 if your chart doesn’t show good support/resistance at 10 days lookback – I have found 25 to be useful on charts like SPX)
Timeframe: 1 week; Lookback period: 14
Timeframe: 1 month; Lookback period: 10
The line style and colors are all editable. You can apply a global coloring scheme in the event you want to add this indicator to your chart multiple times with different time frames like I do for the weekly and monthly.
I appreciate your comments/feedback on this indicator to improve. Also let me know if you find this useful, and what settings/ticker you find it works best with!
Also check out my profile for more indicators!

Bullish Divergence Short-term Long Trade FinderThis script is a Bullish divergence trade finder built to find small periods where Bitcoin will likely rise from. It looks for bullish divergence followed by a higher low as long as the hour RSI value is below the 40 mark, if then it will enter an long. It marks out Buy signals on the RSI if the value dips below 'RSI Bull Condition Minimum' (Default 40) on the current time frame in view. It also marks out Sell signals found when the RSI is above the 'RSI Bearish Condition Minimum' (Default 50). The sell signals are bearish divergence that has occurred recently on the RSI. When a long is in play it will sell if it finds bearish divergence or the time frame in view reaches RSI value higher than the 'RSI Sell Value'(Default 75). You can set your stop loss value with the 'Stop loss Percentage' (default 5).
Available inputs:
RSI Period: relative strength measurement length(Typically 14)
RSI Oversold Level: the bottom bar of the RSI (Typically 30)
RSI Overbought Level: the top bar of the RSI (Typically 70)
RSI Bearish Condition Minimum: The minimum value the script will use to look for a pivot high that starts the Bearish condition to Sell (Default 50)
RSI Bearish Condition Sell Min: the minimum value the script will accept a bearish condition (Default 60)
RSI Bull Condition Minimum: the minimum value it will consider a pivot low value in the RSI to find a divergence buy (Default 40)
Look Back this many candles: the amount of candles thee script will look back to find a low value in the RSI (Default 25)
RSI Sell Value: The RSI value of the exit condition for a long when value is reached (Default 75)
Stop loss Percentage: Percentage value for amount to lose (Default 5)
The formula to enter a long is stated below:
If price finds a lower low and there is a higher low found following a lower low and price has just made another dip and price closes lower than the last divergence and Relative strength index hour value is less than 40 enter a long.
The formula to exit a long is stated below:
If the value drops below the stop loss percentage OR (the RSI value is greater than the value of the parameter 'RSI Sell Value' or bearish divergence is found greater than the parameter 'RSI Bearish Condition Minimum' )
This script was built from much strategy testing on BTC but works with alts (occasionally) also. It is most successful to my knowledge using the 15 min and 7 min time frames with default values. Hope it helps! Follow for further possible updates to this script or other entry or exit strategies.
snapshot:
I only have a Pro trading view account so I cannot share a larger data set about this script because the buy signals happen pretty rarely. The most amount that I could find within a view for me was 40 trades within a viewable time. The suggested/default parameters that I have do not occur very often so it limits the data set. Adjustments can be made to the parameters so that trades can be entered more often. The scripts success is dependent on the values of the parameters set by the user. This script was written to be used for BTC/USD or BTC/USDT trading. I am unable to share a larger dataset without putting out results that are intended to fail or having a premium account so reaching the 100 trade minimum is not possible with my account.

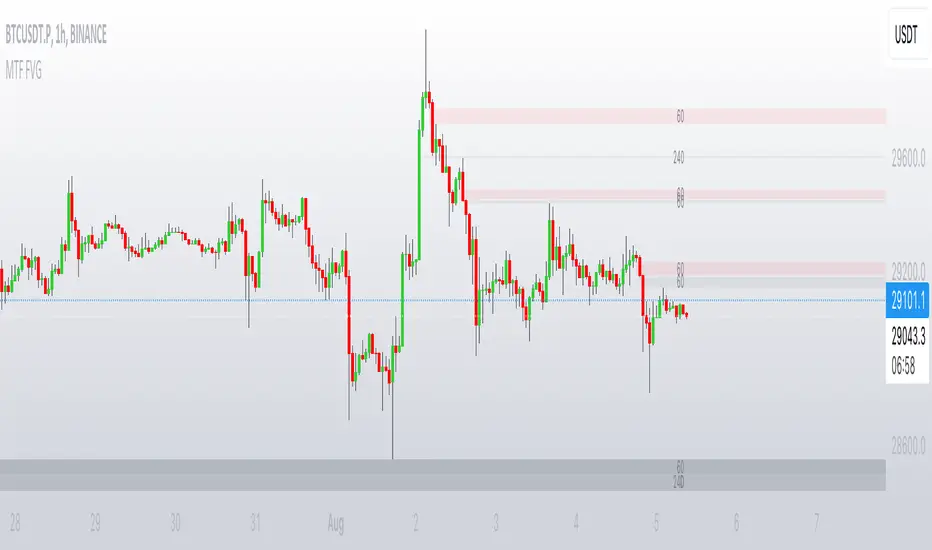
MTF FVGThis script finds Imbalance (Fair Value Gap (FVG)) on multi timeframes.
If needed all TF can be used at once: 1, 3, 5, 15, 30, 45, 60, 120, 180, 240, D, W.
It finds FVG on any desired TF that is greater or equal than TF on the chart.
FVG stands for fair value gap, which is a three-candle structure that indicates an imbalance or inefficiency in the market. An imbalance means that the buying and selling is not equal, and there is a gap between the fair value and the market value of an asset. A bullish FVG shows that the market value is lower than the fair value, and a bearish FVG shows the opposite.
FVG takes place in a series of 3 candles when the middle candle gaps up or down. This signals strong buying or selling pressure in the direction of the gap. When a gap occurs the wicks of the candles do not overlap each other.
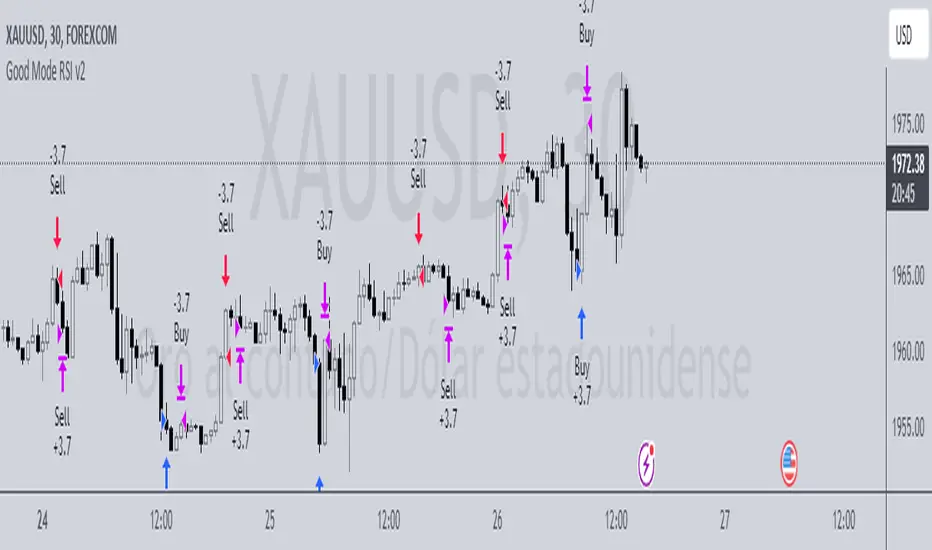
Good Mode RSI v2► Description:
"Good Mode RSI v2" is a powerful trading strategy designed to provide informed trading decisions. This script utilizes the popular RSI (Relative Strength Index) indicator to identify potential buying and selling opportunities in the market. It goes beyond the traditional use of RSI by incorporating carefully selected parameters to enhance its effectiveness. The strategy stands out for its customized combination of RSI levels and stop-loss/take-profit thresholds, allowing for precise trade entries and exits while effectively managing risk.
► How to Use:
To utilize the "Good Mode RSI v2" strategy, follow these steps:
1. Apply the script to your desired trading instrument and timeframe in TradingView.
2. Monitor the chart for trade signals generated by the strategy.
3. When the RSI reaches the sell level of 96, a sell signal is generated. Consider placing a sell order to take advantage of potential downward price movements.
4. take-profit level at 60 to secure profits in a strong downtrend.
5. When the RSI drops below the buy level of 4, a buy signal is generated. Consider placing a buy order to enter the market at a favorable price.
6. take-profit level at 30 to secure profits in a strong uptrend.
7. Monitor the RSI indicator on the chart to stay updated on its current value and anticipate potential trade signals.
Please note that trading decisions should be made based on a comprehensive analysis of multiple factors, including market conditions, trend analysis, and risk management. The "Good Mode RSI v2" strategy can serve as a valuable tool in your trading journey, but it should be used in conjunction with your own research and analysis.
► About it:
The "Good Mode RSI v2" strategy is not a mere replication or slight modification of existing strategies or indicators. It has been carefully crafted to provide traders with an original and purposeful approach to trading using the RSI indicator. The strategy's unique configuration of RSI levels and stop-loss/take-profit thresholds allows for improved performance and profitability. Backtesting results have shown impressive metrics, including a gain factor of 2.445 and a compelling profitability of 78.07% during the testing period.
► Referrals:
If you have any questions or need further assistance with the "Good Mode RSI v2" strategy, feel free to ask. Good luck with your trading endeavors!
12&50 RSI + %R2/50 RSI+ %R is a PineScript indicator that combines two popular technical indicators, the Relative Strength Index (RSI) and the Williams %R. The indicator plots two lines, K and D, which represent the smoothed moving averages of the RSI. It also plots the RSI with a 60-period length and the Williams %R with a 21-period length. The indicator can be used to identify overbought and oversold conditions, as well as potential reversals.
Here are some of the key features of the script:
It uses two different RSI lengths to provide a more comprehensive view of the market.
It plots the Williams %R, which can be used to identify overbought and oversold conditions.
It includes overbought and oversold levels to help traders identify potential entry and exit points.

Baseline Indicator [SS]Hello,
This is the Baseline Indicator. I modelled it after one of my favourite Tradingview chart types, the baseline type (shown in image below):
I really love this chart, but I wanted a way for it to:
a) Be static and not move with the chart; and
b) Auto calculate the baseline average for a specified period of time.
So I created this indicator which does essentially that.
What it does:
The indicator will calculate the average between the high and low of a user defined timeframe. The timeframe is customizable, but it defaults to daily. It will then plot the average (or baseline) of the high and low over that specified timeframe. The default plot is a candle plot. It will change the colours of the candles to green (for above the baseline) and red (for below the baseline). The chart below shows an example of the indicator with candles on SPY. The Baseline timeframe is set to 1 hour:
You can choose whether you want to plot the current baseline average or the previous.
The advantage to plotting the previous is that this provide a static reference point and can be helpful on the 30 and 60 minute timeframe. Here is an example:
In this example on SPY, the indicator is plotting the previous average. You can see SPY is using this as support and creating a "staircase" pattern. This is indicative of a trend.
The example above is using the previous day average on the daily timeframe during a sideways day. You can see that the price action accumulates and is consistently drawn to this point.
Inversely, you can manually select your own baseline price if you want a static, self-calculated baseline reference point.
Options and Settings:
Below is an outline of the menu as well as a brief explanation of the options and settings:
To view your chart as a baseline chart, make sure you select the "Line" input and then hide the candles on your chart using your chart settings (see image below):
The purple arrow shows how to hide the candles. You select the "Eye" Icon which should then become greyed out and you will be left with the baseline chart from the indicator.
Why use baseline average?
The average between the high and low of a designated timeframe is a very helpful value. In choppy markets, this acts as a key point of frequent return. In trendy markets, this acts as a reference point of trend direction and strength. I encourage you to play around with the indicator and review some historical charts using it, and you will see some patterns emerge!
Final thoughts:
I have also done a quick tutorial video on the indicator for your reference, you can check that out below:
Thanks for checking out the indicator and I hope you like it!

TimeLy Moving Average - TMAHello traders, I'm Only Fibonacci.
With this indicator, you will see the averages according to the hourly, weekly and monthly price movements in many periods on the chart.
This will show you the moving average values of the price over different periods in a progressive manner on the chart that is open to you.
Options and Usage
To see the hourly average, your chart's time range must be less than or equal to 60 minutes, otherwise it will produce a NaN value.
In order to see the daily average, your chart must be open for any minute period or (even if the second is open, it must be greater than 6 seconds). Otherwise, it does not produce any value.
Your chart must be larger than the second chart to see the weekly average. In other words, you can see the weekly average with at least 1 minute chart open.
In order to see the monthly average, your chart time interval must be above 10 minutes, otherwise you will not be able to see data again.
Settings
You choose the moving average type and the time interval value you want to see from the indicator settings.
You can also select a source for moving averages.
Enjoy it, you can make improvements on it.
Please do not forget to comment for various bug reports.

HTF Candle Support & Resistance «NoaTrader»This script uses higher timeframe candle's High, Low & Close as a source for drawing a line representing potential Supports and Resistances.
The more lines you see on a level, probably the more important that level is.
The script has a single input for setting the source candle's timeframe, so it can be used on any timeframe with the proper settings. For example, higher timeframes like weekly and monthly can use "3M" or "12M" settings, Daily timeframes with "W", or even lower timeframes like minutes and seconds with "240" and "60" (M means monthly candle, W is weekly, and numbers are for minutes.)
As you can see on the code:
Red lines represent candle's High.
Green lines represent candle's Low.
Blue lines represent candle's Close.
Give it a try on different timeframes with different settings to see interesting gaps between lines!
Banded Chikou Breakout — Quantifying Ichimoku MomentumTitle: Banded Chikou Breakout — Quantifying Ichimoku Momentum
Overview:
Banded Chikou Breakout (BCB) is a unique, algorithmic script designed to augment the capabilities of traders seeking substantial breakout opportunities. Constructed on the robust principles of the Ichimoku trading strategy, BCB is designed to quantify and filter the Chikou Span's significant breakouts above or below the price action. This script does not aim to replace the Ichimoku system; instead, it enhances it, providing an optimized tool for momentum trading.
Rationale:
Ichimoku traders often scrutinize the Chikou Span's position relative to price action to identify market trends. However, determining whether the Chikou Span is above or below due to a genuine trend or mere market noise can be challenging in choppy markets. BCB resolves this predicament by offering a unique way to interpret the Chikou Span's movement. It does so by quantifying the Chikou Span's momentum and utilizing Bollinger Bands to determine its significance. By effectively differentiating substantial movements from the insignificant, BCB can help traders better navigate the market and increase their potential for profitable trades.
How it Works:
BCB combines three key elements: a Momentum Script (simulating Chikou Span), a Bollinger Band Script, and a Timeframe Switcher, all working together to provide a refined trading perspective.
Momentum Script: Calculates the price difference between the current price and the price 'n' periods ago, transforming the Chikou Span into a quantifiable momentum value that signifies the strength and speed of a market move.
Bollinger Band Script: Computes a Simple Moving Average (SMA) around the momentum, plotting two 'bands' at a specified standard deviation from this SMA. This functionality allows traders to discern when the Chikou Span's momentum is abnormally high or low, signifying a potential significant breakout.
Timeframe Switcher: This feature lets traders apply the BCB script to a different timeframe from the one they are currently viewing. This capability can help traders identify higher timeframe breakouts and trade them with precision on the lower timeframe.
How to Use:
BCB is designed to complement the Ichimoku strategy for effective breakout identification.
Add the BCB script to your trading chart. It plots the momentum (yellow line) and Bollinger Bands (green lines) with the area between the bands shaded blue.
Utilize the Ichimoku strategy to identify larger and smaller timeframe trends.
Optional: Leverage the timeframe switcher to synchronize your trades with higher timeframe trends while operating on lower timeframes.
If the BCB momentum line crosses the upper Bollinger Band while the Ichimoku indicates a bullish trend, it signifies a potential significant upward breakout. Similarly, a cross below the lower band during a bearish trend could denote a significant downward breakout.
Remember, without the context provided by the Ichimoku system's trend analysis, BCB can yield false breakouts. It is, therefore, crucial to use these tools in tandem. I like to check for an Ichimoku trend on the 4H and 1H charts, and then use BCB on charts <60 minutes to capture trends with precision.
