MarketSmith Stochasticversion=5
This version of the stochastic produces the identical stochastic as used in MarketSmith
The three primary differences from a classic stochastic are as follows:
1. Close values only
2. 5-day ema instead of 3-day simple moving averages for smoothing the fast and slow lines
3. Slow and fast lines are truncated to integer values
by Mike Scott
2023-09-11
Cari dalam skrip untuk "荣昌生物+2023年收入+利润+研发投入+毛利率+净利率"
Dynamic GANN Square Of 9 BandsDynamic GANN Square Of 9 Bands
Created on 3 Sept 2023
Adjust Increment Value:
Customize increment to match symbol and price characteristics for accuracy.
Green Line:
200 EMA. Identifies trend direction; moves with the prevailing trend.
Red Lines:
Mark prominent reversal levels closer to the red range; ideal for mean reversion strategies.
Crossing red levels may indicate trend continuation to the next red level.
Grey Lines:
Show immediate target reversal levels; watch for potential reversals.
Key Features:
Levels are different from Standard Deviation Lines.
Levels remain fixed and parallel, unaffected by volatility.
Despite its dynamism, it can serve as a leading indicator, revealing potential trend changes.
Primarily designed for trend-following strategies.
Additional Tips:
Use additional confirmations
Manage predefined risk and quantity
Additional Resources:
GANN Square Of 9 Pivots:

Velocity Acceleration Indicator [CC]The Velocity Acceleration Indicator was created by Scott Cong (Stocks and Commodities Sep 2023, pgs 8-15). This is another personal variation of his formula designed to capture the overall velocity acceleration of the underlying stock by applying the velocity formula to the original indicator to find the acceleration of the underlying velocity. I changed a few things around and managed actually to get less lag and quicker signals for this version, so make sure you compare the Velocity Indicator script that I published yesterday. This indicator is also visually similar to a typical stochastic indicator but uses a different underlying calculation. This works well as a momentum indicator, and the values are completely unbounded, so the best ways to determine bullish or bearish trends is either by using a crossover or crossunder between the indicator and the midline or to buy or sell the indicator when it reaches a high or low point and starts to fall or rise respectively. I used the zero line for my default version to help determine the bullish or bearish trends. I have also included multiple colors to differentiate between very strong signals and normal signals, so very strong signals are darker in color, and normal signals use lighter colors. Buy when the line turns green and sell when it turns red.
Let me know if there are any other indicators or scripts you would like to see me publish! I will have some more new scripts in the next week or so.

Velocity Indicator [CC]The Velocity Indicator was created by Scott Cong (Stocks and Commodities Sep 2023, pgs 8-15). This is my variation of his formula designed to capture the overall velocity of the underlying stock by applying the typical velocity formula. This indicator is visually similar to a typical stochastic indicator but uses a different underlying calculation. This works well as a momentum indicator, and the values are completely unbounded, so the best ways to determine bullish or bearish trends is either by using a crossover or crossunder between the indicator and the midline or to buy or sell the indicator when it reaches a high or low point and starts to fall or rise respectively. For my default version, I used the zero line to help determine the bullish or bearish trends. I have also included multiple colors to differentiate between very strong signals and normal signals, so very strong signals are darker in color, and normal signals use lighter colors. Buy when the line turns green and sell when it turns red.
Let me know if there are any other indicators or scripts you would like to see me publish! I will have some more new scripts in the next week or so.

Volume ValueWhen VelocityTitle: Volume ValueWhen Velocity Trading Strategy
▶ Introduction:
The " Volume ValueWhen Velocity " trading strategy is designed to generate long position signals based on various technical conditions, including volume thresholds, RSI (Relative Strength Index), and price action relative to the Simple Moving Average (SMA). The strategy aims to identify potential buy opportunities when specific criteria are met, helping traders capitalize on potential bullish movements.
▶ How to use and conditions
★ Important : Only on Spot Binance BINANCE:BTCUSDT
Name: Volume ValueWhen Velocity
Operating mode: Long on Spot BINANCE BINANCE:BTCUSDT
Timeframe: Only one hour
Market: Crypto
currency: Bitcoin only
Signal type: Medium or short term
Entry: All sections in the Technical Indicators and Conditions section must be saved to enter (This is explained below)
Exit: Based on loss limit and profit limit It is removed in the settings section
Backtesting:
⁃ Exchange: BINANCE BINANCE:BTCUSDT
⁃ Pair: BTCUSDT
⁃ Timeframe:1h
⁃ Fee: 0.1%
- Initial Capital: 1,000 USDT
- Position sizing: 500 usdt
-Trading Range: 2022-07-01 11:30 ___ 2023-07-21 14:30
▶ Strategy Settings and Parameters:
1. `strategy(title='Volume ValueWhen Velocity', ...`: Sets the strategy title, initial capital, default quantity type, default quantity value, commission value, and trading currency.
↬ Stop-Loss and Take-Profit Settings:
1. long_stoploss_value and long_stoploss_percentage : Define the stop-loss percentage for long positions.
2. long_takeprofit_value and long_takeprofit_percentage : Define the take-profit percentage for long positions.
↬ ValueWhen Occurrence Parameters:
1. occurrence_ValueWhen_1 and occurrence_ValueWhen_2 : Control the occurrences of value events.
2. `distance_value`: Specifies the minimum distance between occurrences of ValueWhen 1 and ValueWhen 2.
↬ RSI Settings:
1. rsi_over_sold and rsi_length : Define the oversold level and RSI length for RSI calculations.
↬ Volume Thresholds:
1. volume_threshold1 , volume_threshold2 , and volume_threshold3 : Set the volume thresholds for multiple volume conditions.
↬ ATR (Average True Range) Settings:
1. atr_small and atr_big : Specify the periods used to calculate the Average True Range.
▶ Date Range for Back-Testing:
1. start_date, end_date, start_month, end_month, start_year, and end_year : Define the date range for back-testing the strategy.
▶ Technical Indicators and Conditions:
1. rsi: Calculates the Relative Strength Index (RSI) based on the defined RSI length and the closing prices.
2. was_over_sold: Checks if the RSI was oversold in the last 10 bars.
3. getVolume and getVolume2 : Custom functions to retrieve volume data for specific bars.
4. firstCandleColor : Evaluates the color of the first candle based on different timeframes.
5. sma : Calculates the Simple Moving Average (SMA) of the closing price over 13 periods.
6. numCandles : Counts the number of candles since the close price crossed above the SMA.
7. atr1 : Checks if the ATR_small is less than ATR_big for the specified security and timeframe.
8. prevClose, prevCloseBarsAgo, and prevCloseChange : ValueWhen functions to calculate the change in the close price between specific occurrences.
9. atrval: A condition based on the ATR_value3.
▶ Buy Signal Condition:
Condition: A combination of multiple volume conditions.
buy_signal: The final buy signal condition that considers various technical conditions and their interactions.
▶ Long Strategy Execution:
1. The strategy will enter a long position (buy) when the buy_signal condition is met and within the specified date range.
2. A stop-loss and take-profit will be set for the long position to manage risk and potential profits.
▶ Conclusion:
The " Volume ValueWhen Velocity " trading strategy is designed to identify long position opportunities based on a combination of volume conditions, RSI, and price action. The strategy aims to capitalize on potential bullish movements and utilizes a stop-loss and take-profit mechanism to manage risk and optimize potential returns. Traders can use this strategy as a starting point for their own trading systems or further customize it to suit their preferences and risk appetite. It is crucial to thoroughly back-test and validate any trading strategy before deploying it in live markets.
↯ Disclaimer:
Risk Management is crucial, so adjust stop loss to your comfort level. A tight stop loss can help minimise potential losses. Use at your own risk.
How you or we can improve? Source code is open so share your ideas!
Leave a comment and smash the boost button!

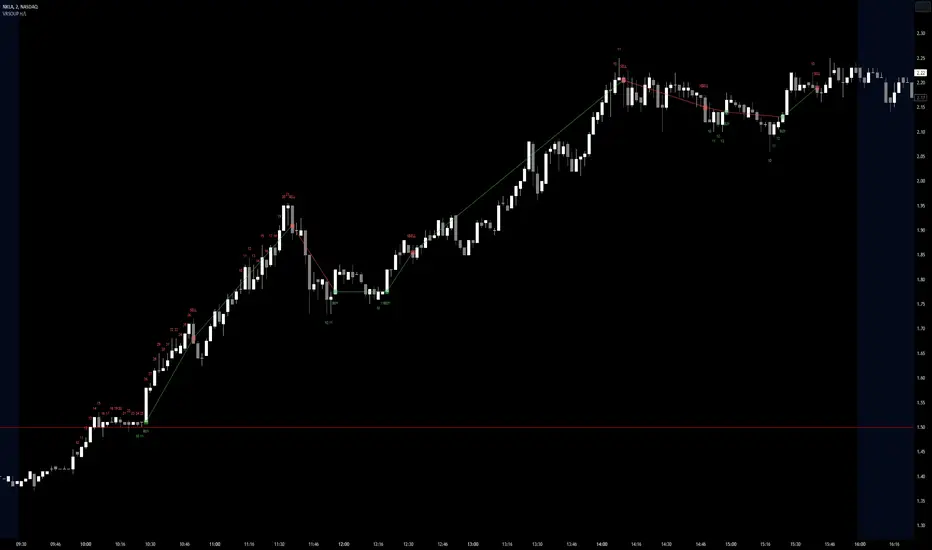
Visible Range Streaks of Unbroken Prior Highs/Lows [vnhilton](OVERVIEW)
This indicator keeps track of the number of unbroken prior highs/lows (unbroken being no price closes above/below the prior high/low). Great for entries and take profits. The indicator calculates on visible bars for convenience when looking back into the history without having to use bar replay, which those on the TradingView free plan cannot use intraday bar replay, so the visible range is a perfect work-around. The 2 minute chart above shows NASDAQ:NKLA on Thursday 13th July, 2023, with a significant level of $1.5 leading to a breakout. Streaks lower than 10 were hidden in the chart.
(FEATURES)
- Custom minimum streak size to start displaying plots (the smaller the size the more signals)
- Ability to show/hide numbers (that keep count of unbroken streaks), text signals (for when a streak is broken), break shapes (where the prior high/low was broken), and Zig Zag (lines between break shapes)
- Customisable Zig Zag line width, style, and colours (1 colour for a positive gradient line, and another for a negative gradient line)
- Customisable text signal text
- Customisable numbers, text signal, break shape, number label & text signal label colours
- Customisable number label, text signal label and break shape styles and sizes (number and text signal label share the same size)
Opening Range Gap + Std Dev [starclique]The ICT Opening Range Gap is a concept taught by Inner Circle Trader and is discussed in the videos: 'One Trading Setup For Life' and 2023 ICT Mentorship - Opening Range Gap Repricing Macro
ORGs, or Opening Range Gaps, are gaps that form only on the Regular Trading Hours chart.
The Regular Trading Hours gap occurs between 16:15 PM - 9:29 AM EST (UTC-4)
These times are considered overnight trading, so it is useful to filter the PA (price action) formed there.
The RTH option is only available for futures contracts and continuous futures from CME Group.
To change your chart to RTH, first things first, make sure you’re looking at a futures contract for an asset class, then on the bottom right of your chart, you’ll see ETH (by default) - Click on that, and change it to RTH.
Now your charts are filtering the price action that happened overnight.
To draw out your gap, use the Close of the 4:14 PM candle and the open of the 9:30 AM candle.
How is this concept useful?
Well, It can be used in many ways.
---
How To Use The ORG
One of the ways you can use the opening range gap is simply as support and resistance
If we extend out the ORG from the example above, we can see that there is a clean retest of the opening range gap high after breaking structure to the upside and showing acceptance outside of the gap after consolidating within it.
The ORG High (4:14 Candle Close in this case) was used as support.
We then see an expansion to the upside.
Another way to implement the ORG is by using it as a draw on liquidity (magnet for price)
In this example, if we looked to the left, there was a huge ORG to the downside, leaving a massive gap.
The market will want to rebalance that gap during the regular trading hours.
The market rallies higher, rejects, comes down to clear the current days ORG low, then closes.
That is one example of how you can combine liquidity & ICT market structure concepts with Opening Range Gaps to create a story in the charts.
Now let’s discuss standard deviations.
---
Standard Deviations
Standard Deviations are essentially projection levels for ranges / POIs (Point of Interests)
By this I mean, if you have a range, and you would like to see where it could potentially expand to, you’d place your fibonacci retracement tool on and high and low of the range, then use extension levels to find specific price points where price might reject from.
Since 0 and 1 are your Range High and Low respectively, your projection levels would be something like 1.5, 2, 2.5, and 3, for the extension from your 1 Fib Level, and -0.5, -1, -1.5, and -2 for your 0 Fib level.
The -1 and 2 level produce a 1:1 projection of your range low and high, meaning, if you expect price to expand as much as it did from the range low to range high, then you can project a -1 and 2 on your Fib, and it would show you what ICT calls “symmetrical price”
Now, how are standard deviations relevant here?
Well, if you’ve been paying attention to ICT’s recent videos, you would’ve caught that he’s recently started using Standard Deviation levels on breakers.
So my brain got going while watching his video on ORGs, and I decided to place the fib on the ORG high and low and see what it’d produce.
The results were very interesting.
Using this same example, if we place our fib on the ORG High and Low, and add some projection levels, we can see that we rejected right at the -2 Standard Deviation Level.
---
You can see that I also marked out the EQ (Equilibrium, 50%, 0.5 of Fib) of the ORG. This is because we can use this level as a take profit level if we’re using an old ORG as our draw.
In days like these, where the gap formed was within a consolidation, and it continued to consolidate within the ORG zone that we extended, we can use the EQ in the same way we’d use an EQ for a range.
If it’s showing acceptance above the EQ, we are bullish, and expect the high of the ORG to be tapped, and vice versa.
---
Using The Indicator
Here’s where our indicator comes in play.
To avoid having to do all this work of zooming in and marking out the close and open of the respective ORG candles, we created the Opening Range Gap + Standard Deviations Indicator, with the help of our dedicated Star Clique coder, a1tmaniac.
With the ORG + STD DEV indicator, you will be able to view ORG’s and their projections on the ETH (Electronic Trading Hours) chart.
---
Features
Range Box
- Change the color of your Opening Range Gap to your liking
- Enable or disable the box from appearing using the checkbox
Range Midline
- Change the color of your Opening Range Gap Equilibrium
- Enable or disable the midline from appearing using the checkbox
Std. Dev
- Add whichever standard deviation levels you’d like.
- By default, the indicator comes with 0.5, 1, 1.5, and 2 standard deviation levels.
- Ensure that you add a comma ( , ) in between each standard deviation level
- Enable or disable the standard deviations from appearing using the opacity of the color (change to 0%)
Labels / Offset
- Adjust the offset of the label for the Standard Deviations
- Enable or disable the Labels from appearing using the checkbox
Time
- Adjust the time used for the indicators range
- If you’d like to use this for a Session or ICT Killzone instead, adjust the time
- Adjust the timezone used for the time referenced
- Options are UTC, US (UTC-4, New York Local Time) or UK (UTC+1, London Time)
- By default, the indicator is set to US

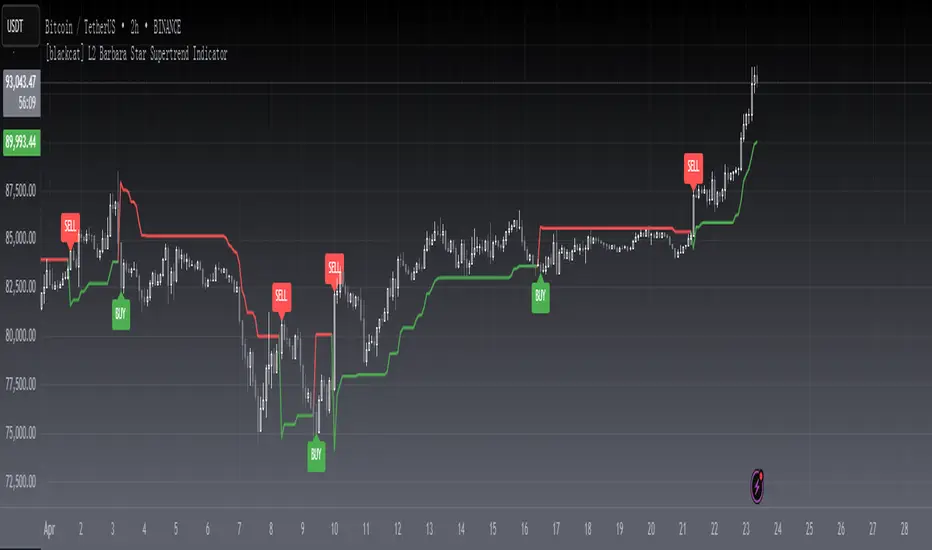
[blackcat] L2 Barbara Star Supertrend IndicatorLevel 2
Background
Barbara Star’s article on July 2023, “Stay On Track With The Supertrend Indicator”, I rewrote it as pine script for your information.
Function
A supertrend indicator is displayed either above or below the closing price to signal a buy or sell. The indicator changes color depending on whether you should buy or not. When the Supertrend indicator falls below the closing price, the indicator turns green, signaling one or more entry points to buy.
Author Barbara Star describes the Supertrend indicator and how it can be used as a means for traders to stay in sync with the larger trend. She explains how J. Welles Wilder's Average True Range (ATR) forms a basis for supertrend calculations. ATR does not measure price direction, but rather provides a measure of volatility over a period of time. The Supertrend indicator, on the other hand, provides a more comprehensive view of trend direction. In addition, the indicator provides price levels at which a trend reversal would occur.
Green color stands for up trend;
Red color stands for down trend.
Remarks
Feedbacks are appreciated.
Discrete Fourier Transformed Money Flow IndexThe Discrete Fourier Transform Money Flow Index indicator integrates the Money Flow Index (MFI) with Discrete Fourier Transform (credit to author wbburgin - May 26 2023 ) smoothing to offer a refined and smoothed depiction of the MFI's underlying trend. The MFI is calculated using the formula: MFI = 100 - (100 / (1 + MR)), where a high MFI value indicates robust buying pressure (signaling an overbought condition), and a low MFI value indicates substantial selling pressure (signaling an oversold condition).
Why is the DFT and MFI combined?
The aim of this combination between DFT and MFI is to effectively filter out short-term fluctuations and noise, enabling a clearer assessment of the overall trend. This smoothing process enhances the reliability of the MFI by emphasizing dominant and sustained buying or selling pressures. This script executes a full DFT but only uses filtering from one frequency component. The choice to focus on the magnitude at index 0 is significant as it captures the dominant or fundamental frequency in the data. By analyzing this primary cyclic behavior, we can identify recurring patterns and potential turning points more easily. This streamlined approach simplifies interpretation and enhances efficiency by reducing complexity associated with multiple frequency components. Overall, focusing on the dominant frequency and applying it to the MFI provides a concise and actionable assessment of the underlying data.
Note: The FMFI indicator provides both smoothed and non-smoothed versions of the MFI, with the option to toggle the original non-smoothed MFI on or off in the settings.
Application
FMFI functions as a trend-following indicator. Bullish trends are denoted by the color white, while bearish trends are represented by the color purple. Circles plotted on the FMFI indicate regular bull and bear signals. Additionally, red arrows indicate a strong negative trend, while green arrows indicate a strong positive trend. These arrows are calculated based on the presence of regular bull and bear signals within overbought and oversold zones. To enhance its effectiveness, it is recommended to combine this indicator with other complementary technical analysis tools and integrate it into a comprehensive trading strategy. Traders are encouraged to explore a wide range of settings and timeframes to align the indicator with their unique trading preferences and adapt it to the current market conditions. By doing so, traders can optimize the indicator's performance and increase their potential for successful trading outcomes.
Utility
Traders and investors can employ this indicator to enhance their trend-following strategies. The white-colored components of the FMFI can help identify potential buying zones, while the purple-colored components can assist in identifying potential selling points. The red and green arrows can be used to pinpoint moments of strong bull or bear momentum, allowing traders to position themselves advantageously in their trading activities. Please note that future performance of any trading strategy is fundamentally unknowable, and past results do not guarantee future performance.

CalendarCadLibrary "CalendarCad"
This library provides date and time data of the important events on CAD. Data source is csv exported from www.fxstreet.com and transformed into perfered format by C# script.
HighImpactNews2015To2023()
CAD high impact news date and time from 2015 to 2023

CalendarEurLibrary "CalendarEur"
This library provides date and time data of the important events on EUR. Data source is csv exported from www.fxstreet.com and transformed into perfered format by C# script.
HighImpactNews2015To2019()
EUR high impact news date and time from 2015 to 2019
HighImpactNews2020To2023()
EUR high impact news date and time from 2020 to 2023
CalendarGbpLibrary "CalendarGbp"
This library provides date and time data of the important events on GBP. Data source is csv exported from www.fxstreet.com and transformed into perfered format by C# script.
HighImpactNews2015To2019()
GBP high impact news date and time from 2015 to 2019
HighImpactNews2020To2023()
GBP high impact news date and time from 2020 to 2023

CalendarJpyLibrary "CalendarJpy"
This library provides date and time data of the important events on JPY. Data source is csv exported from www.fxstreet.com and transformed into perfered format by C# script.
HighImpactNews2015To2023()
JPY high impact news date and time from 2015 to 2023
CalendarUsdLibrary "CalendarUsd"
This library provides date and time data of the important events on USD. Data source is csv exported from www.fxstreet.com and transformed into perfered format by C# script.
HighImpactNews2015To2019()
USD high impact news date and time from 2015 to 2019
HighImpactNews2020To2023()
USD high impact news date and time from 2020 to 2023

NewsEventsGbpLibrary "NewsEventsGbp"
This library provides date and time data of the high imact news events on GBP. Data source is csv exported from www.fxstreet.com and transformed into perfered format by C# script.
gbpNews2015To2019()
GBP high imact news date and time from 2015 to 2019
gbpNews2020To2023()
GBP high imact news date and time from 2020 to 2023

NewsEventsEurLibrary "NewsEventsEur"
This library provides date and time data of the high imact news events on EUR. Data source is csv exported from www.fxstreet.com and transformed into perfered format by C# script.
eurNews2015To2019()
EUR high imact news date and time from 2015 to 2019
eurNews2020To2023()
EUR high imact news date and time from 2020 to 2023

NewsEventsJpyLibrary "NewsEventsJpy"
This library provides date and time data of the high imact news events on JPY. Data source is csv exported from www.fxstreet.com and transformed into perfered format by C# script.
jpyNews2015To2023()
JPY high imact news date and time from 2015 to 2023

NewsEventsCadLibrary "NewsEventsCad"
This library provides date and time data of the high imact news events on CAD. Data source is csv exported from www.fxstreet.com and transformed into perfered format by C# script.
cadNews2015To2023()
CAD high imact news date and time from 2015 to 2023
NewsEventsUsdLibrary "NewsEventsUsd"
This library provides date and time data of the high imact news events on USD. Data source is csv exported from www.fxstreet.com and transformed into perfered format by C# script.
usdNews2015To2019()
USD high imact news date and time from 2015 to 2019
usdNews2020To2023()
USD high imact news date and time from 2020 to 2023
Futures All List / Sell SignalAs of May 2023, there are more than 180 usdt perpetual coins on the binance futures exchange. These coins are included in the indicator in lists of 40. They are sorted instantly in the table from largest to smallest. The sorting style can be changed in the indicator settings. This indicator collects RSI and TSI values at desired values. The result has a maximum value of 600. A value of 600 signals that the price will decrease or remain stable for a certain period of time. Generally, a short can be expected from the closest point to 600. If 3 separate lists are selected by using 3 of these indicators, 120 coins can be analyzed at the same time. Available in all time zones. Examine it in a 3-minute timeframe. The line inside the indicator draws the instantaneous values of the relevant coin.

Visible Range Linear Regression Channel [vnhilton](OVERVIEW)
This indicator calculates the linear regression channel for the visible bars shown on the chart instead of the traditional fixed length linear regression channel TradingView provides (and is more accurate I believe). Inspired by TradingView's Linear Regression Channel and Visible Average Price indicator, and the DAS Trader linear regression indicator.
(FEATURES)
- Ability to extend lines to the right
- Show/hide individual lines
- Adjust standard deviation of bands
- Adjust line style and width of basis and band lines
- Change individual line colours and plot fills between the lines
(DIFFERENCES)
If you compare this indicator to TradingView's Linear Regression Channel, you will notice some differences (as of 11th June, 2023). Differences and reasons are:
1) The intercept is wrong. The formula TradingView uses to calculate the intercept includes the addition of the gradient, which I believe is incorrect. Difference #2 is also why the intercept is wrong. This indicator omits that addition. This was verified by comparing the gradient calculated in this indicator with the gradient determined by Excel with the same data.
2) The gradient is "wrong". In quotations as essentially TradingView's code attempts to find the line of best fit, with the y-axis on the most recent bar instead of the oldest bar. This leads to the gradient being the opposite to the gradient found in this indicator, which isn't wrong, but the later formula used to calculate the intercept doesn't take this into account, resulting in an incorrect intercept value. The gradient and intercept values in this indicator matches those found in Excel.
3) Standard deviation bands of both indicators. I believe the code TradingView uses to calculate standard deviation is incorrect (basing this just through visuals). This indicator uses the array.stdev function to find the correct value (verified with Excel numbers).

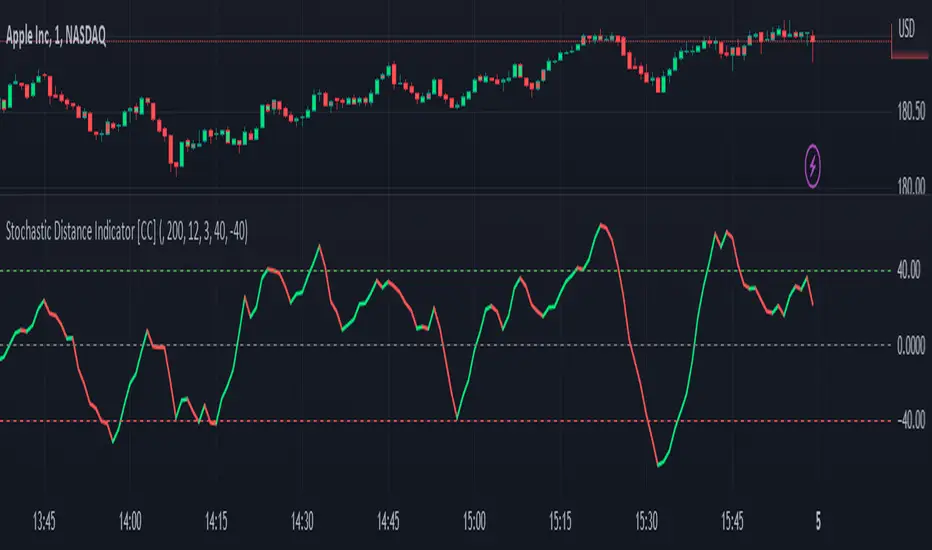
Stochastic Distance Indicator [CC]The Stochastic Distance Indicator was created by Vitali Apirine (Stocks and Commodities Jun 2023 pgs 16-21), and this is a new method that measures the absolute distance between a price and its highest and lowest values over a long period. It uses the stochastic formula to create an oscillator using this distance value and smooths the value. Obviously, there is a lag in signals due to the lookback periods, but it does a good job of staying above the midline when the stock is in a strong uptrend and vice versa. Of course, I'm open to suggestions, but I'm deciding to create buy and sell signals based on comparing the unsmoothed and smoothed values. Buy when the line turns green and sell when it turns red.
Let me know if there are any other indicators you would like to see me publish!
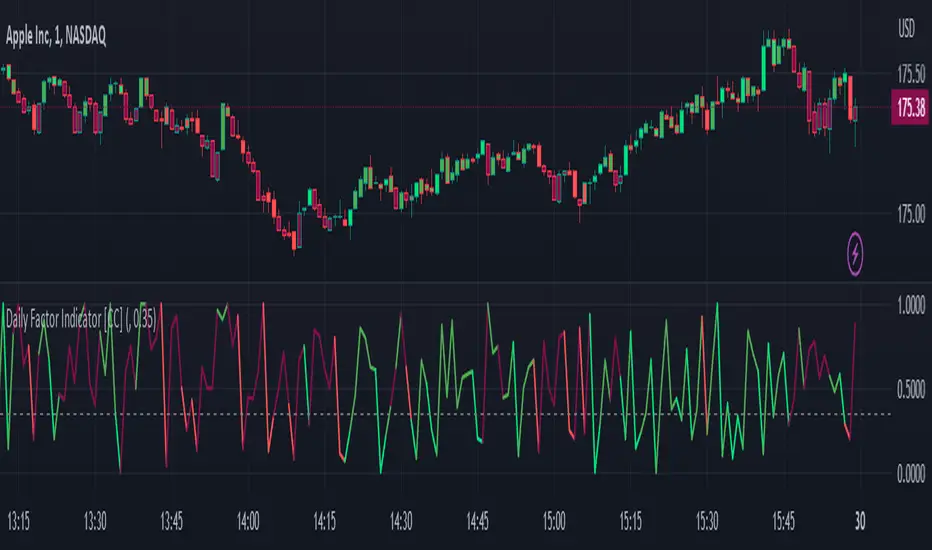
Daily Factor Indicator [CC]The Daily Factor Indicator was created by Andrea Unger (Stocks and Commodities Jun 2023 pgs 26-31), and this is a new volatility indicator that compares the body, which is the absolute difference between the previous open and previous close, and the range which is the difference between the previous high and previous low. The indicator is calculated by dividing the body and range to determine the volatility for the previous bar. This indicator will range between 0 and 1. Values closer to 1 mean very high volatility, and values closer to 0 mean very low volatility. I have introduced a simple moving average strategy to decide buy or sell signals and colors. Darker colors mean the indicator is above the threshold level, and lighter colors mean the indicator is below the threshold level. Colors are shades of green when the price is above the moving average and shades of red when the price is below the moving average. Feel free to try out your own threshold level and general buy and sell signals.
Let me know if there are any other indicators you would like me to publish!