Cari dalam skrip untuk "Divergence"

[RS]MACD Divergence V0EXPERIMENTAL:
MACD Divergence detection.
looks like macd is more prone for missing the extremes in price then the rsi due to lag.


Divergence RSI [mado]Divergence screener for OBV RSI
Regular Bullish: "D" navy label
Hidden Bullish: "H" navy label
Regular Bearish: "D" red label
Hidden Bearish: "H" red label

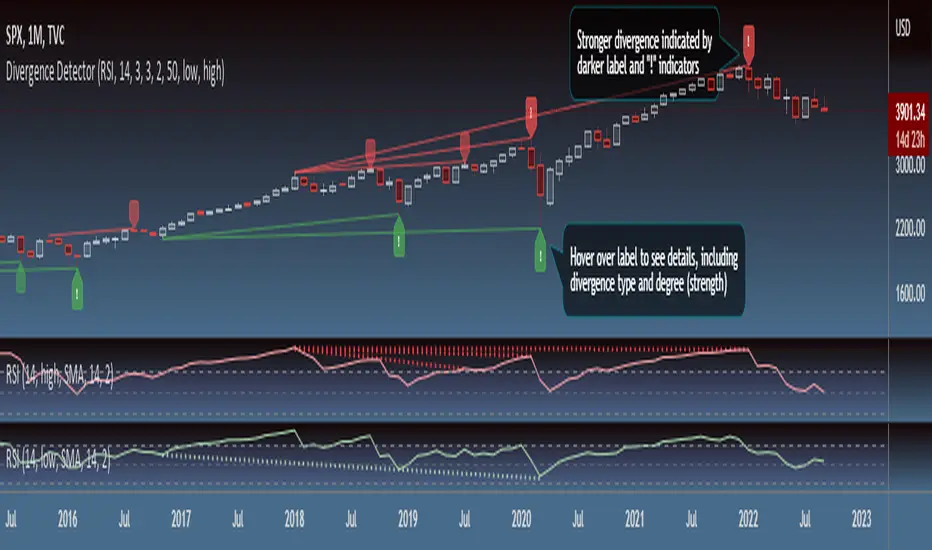
DivergenceUnderstanding the Divergence Indicator
This indicator is designed to identify and analyze divergences between price action and multiple technical indicators across different timeframes. Divergence occurs when the price of an asset moves in one direction while a technical indicator moves in the opposite direction, potentially signaling a trend reversal or continuation.
Key Features
1. Customizable Parameters: Users can adjust settings for divergence detection, including:
- Bullish/Bearish divergence detection
- Regular/Hidden divergence identification
- Pivot lookback periods
- Weighting for different divergence types
2. Strength Calculation: The indicator calculates divergence strength based on the magnitude of divergence and user-defined weightings.
3. Visual Representation: Divergences are displayed on the chart with lines connecting price and indicator pivots, along with labels showing divergence strength.
Utility in Trading
1. Early Trend Reversal Signals: By identifying divergences, traders can anticipate potential trend reversals before they occur in price action.
2. Trend Continuation Confirmation: Hidden divergences can help confirm the continuation of an existing trend.
3. Multi-Timeframe Analysis: The indicator allows for divergence detection across various timeframes, enhancing the reliability of signals.
4. Risk Management: Traders can use divergence signals to adjust their stop-loss levels or take profits on existing positions.
5. Comprehensive Market View: By analyzing multiple indicators simultaneously, traders gain a more robust assessment of market conditions.
6. Objective Strength Evaluation: The divergence strength calculation provides an objective measure of signal significance.
By incorporating this divergence indicator into their trading strategy, traders can potentially improve their market timing, risk management, and overall trading performance.
divergenceLibrary "divergence"
divergence: divergence algorithm with top and bottom kline tolerance
regular_bull(series, series, simple, simple, simple, simple, simple) regular_bull: regular bull divergence, lower low src but higher low osc
Parameters:
series : float src: the source series
series : float osc: the oscillator index
simple : int lbL: look back left
simple : int lbR: look back right
simple : int rangeL: min look back range
simple : int rangeU: max look back range
simple : int tolerance: the number of tolerant klines
Returns: array:
hidden_bull(series, series, simple, simple, simple, simple, simple) hidden_bull: hidden bull divergence, higher low src but lower low osc
Parameters:
series : float src: the source series
series : float osc: the oscillator index
simple : int lbL: look back left
simple : int lbR: look back right
simple : int rangeL: min look back range
simple : int rangeU: max look back range
simple : int tolerance: the number of tolerant klines
Returns: array:
regular_bear(series, series, simple, simple, simple, simple, simple) regular_bear: regular bear divergence, higher high src but lower high osc
Parameters:
series : float src: the source series
series : float osc: the oscillator index
simple : int lbL: look back left
simple : int lbR: look back right
simple : int rangeL: min look back range
simple : int rangeU: max look back range
simple : int tolerance: the number of tolerant klines
Returns: array:
hidden_bear(series, series, simple, simple, simple, simple, simple) hidden_bear: hidden bear divergence, lower high src but higher high osc
Parameters:
series : float src: the source series
series : float osc: the oscillator index
simple : int lbL: look back left
simple : int lbR: look back right
simple : int rangeL: min look back range
simple : int rangeU: max look back range
simple : int tolerance: the number of tolerant klines
Returns: array:
Divergence Indicator with Multi-Length Pivot DetectionThis Pine Script, titled “Divergence Indicator with Multi-Length Pivot Detection”, tool that detects both regular and hidden divergences between price action and an oscillator (defaulting to close, but configurable). It features multi-length pivot logic, angle-based validation, no-cross filtering, and OB/OS region filtering, making it a robust and precise divergence engine. Below is a detailed breakdown:
⸻
🔧 Inputs and Configuration
• osc_src: Oscillator source (e.g. close, RSI, MACD).
• show_hidden: Toggles detection of hidden divergences.
• min_*_angle settings: Control the minimum angle thresholds (in degrees) for confirming valid divergences (ensures momentum is strong enough).
• validate_no_cross: Ensures oscillator and price slopes don’t “cross” the actual values (i.e. filters out invalid or messy trends).
• oversold_level, overbought_level: Used when use_ob_os_filter is enabled to require oscillator to be in OS/OB zones for regular divergence.
• min_div_length: Minimum distance in bars between previous and current pivot points.
⸻
🔁 Internal Engine Mechanics
1. Pivot Detection Engine (Phase 1: Historical Memory)
• For all combinations of left1 and right1 in the range :
• Records all valid pivot lows and pivot highs.
• Stores their:
• bar index
• price value
• oscillator value
This forms a “memory buffer” of past pivots that future price pivots are compared against.
2. Current Pivot Detection (Phase 2: Scanning)
• Loops through larger pivot configurations (left2 ∈ , right2 = 1) to detect new current pivots.
• For each new pivot, it compares against the historical pivots from phase 1.
⸻
📐 Slope and Angle Calculation
For each matching pivot pair (historical vs current):
• Price and Oscillator Slopes are calculated via linear regression, producing:
• price_angle
• osc_angle
• These are converted using math.atan() and math.todegrees() to get proper angular direction and intensity of trend.
⸻
🧠 Divergence Logic
✅ Bullish Divergence
• Regular Bullish: Price makes a lower low, oscillator makes a higher low.
• Hidden Bullish: Price makes a higher low, oscillator makes a lower low.
• Conditions:
• Must meet minimum angle thresholds.
• Optional: Must be in oversold region (osc_src < oversold_level).
• If validate_no_cross is enabled, linearly interpolated slope must not be violated.
✅ Bearish Divergence
• Regular Bearish: Price makes a higher high, oscillator makes a lower high.
• Hidden Bearish: Price makes a lower high, oscillator makes a higher high.
• Conditions mirror the bullish case (with polarity reversed).
⸻
🖍️ Visualization
• Draws colored lines between pivots for visual clarity:
• Green: Regular Bullish
• Lime: Hidden Bullish
• Red: Regular Bearish
• Maroon: Hidden Bearish
• Uses plotshape() to mark divergence bars:
• Triangle-up for bullish
• Triangle-down for bearish
The lines and shapes help quickly identify divergence zones with strong momentum structure.
⸻
🧪 Filtering Enhancements
• No Cross Slope Filter: Checks that oscillator and price values stay above/below their respective slope lines throughout the interval.
• OB/OS Filter: Restricts divergence signals to occur only in oversold/overbought conditions for regular divergences.
• Signal Thinning: Keeps line count to 100 using array.shift() and line.delete().
⸻
🧬 Design Philosophy
• Built to mimic institutional-grade divergence detection, avoiding common false positives.
• Uses adaptive pivots, rigorous angle validation, and noise filtering.

Divergences RefurbishedJust as "a butterfly can flap its wings over a flower in China and cause a hurricane in the Caribbean" (Edward Lorenz), small divergences in markets can signal big trading opportunities.
█Introduction
This is a script forked from LonesomeTheBlue's Divergence for Many Indicators v4.
It is a script that checks for divergence between price and many indicators.
In this version, I added more indicators and also added 40 symbols to check for divergences.
More info on the original script can be found here:
█ Improvements
The following improvements have been implemented over v4:
1. Added parameters to customize indicators.
2. Added new indicators:
- Stoch RSI
- Volume Oscillator
- PVT (Price Volume Trend)
- Ultimate Oscillator
- Fisher Transform
- Z-Score/T-Score
3. Now there is the possibility of using 2 external indicators.
4. New option to show tooltips inside labels.
This allows you to save space on the screen if you choose the option to only show the number of divergences or just the abbreviations.
5. New option to show additional text next to the indicator name.
This allows for grouping of indicators and symbols and better visualization, whether through emojis, for example.
6. Added 40 customizable symbols to check for divergences.
7. Option "show only the first letter" of the indicator replaced by: "show the abbreviation of the indicator".
Reason: the indicator abbreviation is more informative and easier to read.
8. Script converted to PineScript version 5.
█ CONCEPTS
Below I present a brief description of the available indicators.
1. Moving Average Convergence/Divergence (MACD):
Shows the difference between short-term and long-term exponential moving averages.
2. MACD Histogram:
Shows the difference between MACD and its signal line.
3. Relative Strength Index (RSI):
Measures the relative strength of recent price gains to recent price losses of an asset.
4. Stochastic Oscillator (Stoch):
Compares the current price of an asset to its price range over a specified time period.
5. Stoch RSI:
Stochastic of RSI.
6. Commodity Channel Index (CCI):
Measures the relationship between an asset's current price and its moving average.
7. Momentum: Shows the difference between the current price and the price a few periods ago.
Shows the difference between the current price and the price of a certain period in the past.
8. Chaikin Money Flow (CMF):
A variation of A/D that takes into account the daily price variation and weighs trading volume accordingly. Accumulation/Distribution (A/D) identifies buying and selling pressure by tracking the flow of money into and out of an asset based on volume patterns.
9. On-Balance Volume (OBV):
Identify divergences between trading volume and an asset's price.
Sum of trading volume when the price rises and subtracts volume when the price falls.
10. Money Flow Index (MFI):
Measures volume pressure in a range of 0 to 100.
Calculates the ratio of volume when the price goes up and when the price goes down.
11. Volume Oscillator (VO):
Identify divergences between trading volume and an asset's price. Ratio of change of volume, from a fast period in relation to a long period.
12. Price-Volume Trend (PVT):
Identify the strength of an asset's price trend based on its trading volume. Cumulative change in price with volume factor. The PVT calculation is similar to the OBV calculation, but it takes into account the percentage price change multiplied by the current volume, plus the previous PVT value.
13. Ultimate Oscillator (UO):
Combines three different time periods to help identify possible reversal points.
14. Fisher Transform (FT):
Normalize prices into a Gaussian normal distribution.
15. Z-Score/T-Score: Shows the difference between the current price and the price a few periods ago. I is a statistical measurement that indicates how many standard deviations a data point is from the mean of a data set.
When to use t-score instead of z-score? When the sample size is small (length < 30).
Here, the use of z-score or t-score is chosen automatically based on the length parameter.
█ What to look for
The operation is simple. The script checks for divergences between the price and the selected indicators.
Now with the possibility of using multiple symbols, it is possible to check divergences between different assets.
A well-described view on divergences can be found in this cheat sheet:
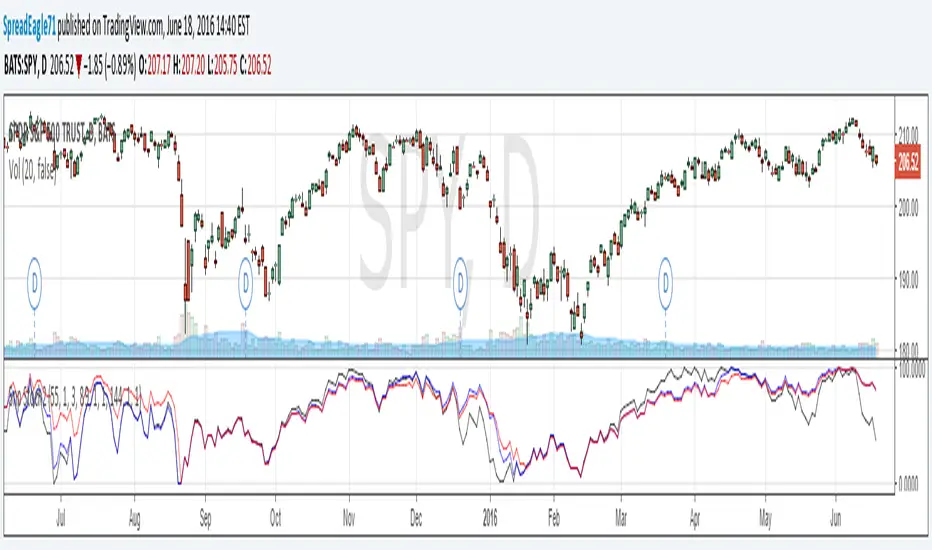
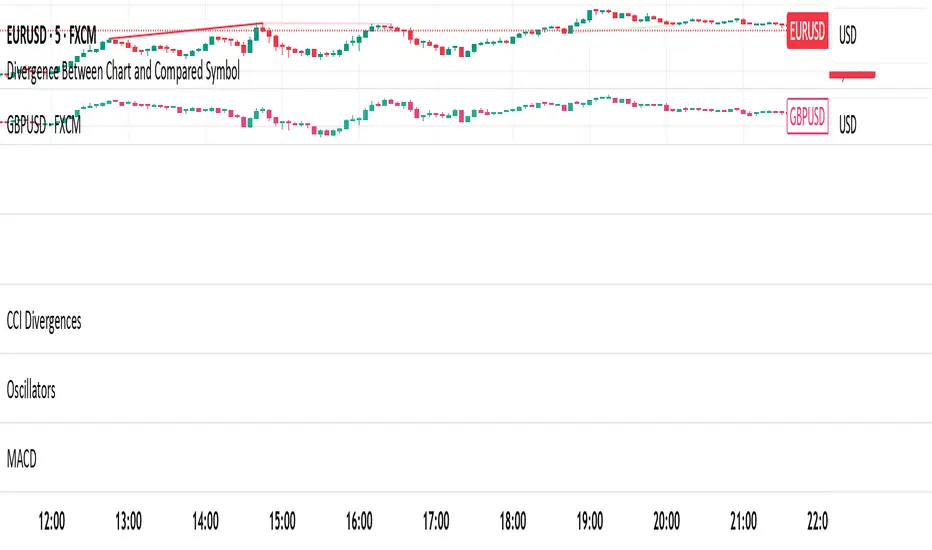
◈ Examples with SPY ETF versus indicators:
1. Regular bullish divergence with external indicator:
1. Regular bearish divergence with Fisher Transform:
1. Positive hidden divergence with Momentum indicator:
1. Negative hidden divergence with RSI:
◈ Examples with SPY ETF versus other symbols:
1. Regular bearish divergence with European Stoch Market:
2. Regular bearish divergence with DXY inverted:
3. Regular bullish divergence with Taiwan Dollar:
4. Regular bearish divergence with US10Y (10-Year US Treasury Note):
5. Regular bullish divergence with QQQ ETF (Nasdaq 100):
6. Regular bullish divergence with ARKK ETF (ARK Innovation):
7.Positive hidden divergence with RSP ETF (S&P 500 Equal Weight):
8. Negative hidden divergence with EWZ ETF (Brazil):
◈ Examples with BTCUSD versus other symbols:
1. Regular bearish divergence with BTCUSDLONGS from Bitfinex:
2. Regular bearish divergence with BLOK ETF (Amplify Transformational Data Sharing):
3. Negative hidden divergence with NATGAS (Natural Gas):
4. Positive hidden divergence with TOTALDEFI (Total DeFi Market Cap):
█ Conclusion
The symbols available to check divergences were chosen in such a way as to cover the main markets, in the most generic way possible.
You can adjust them according to your needs.
A trader in the American market, for example, could add more ETFs, American stocks, and sectoral indices, such as the XLF (Financial Select Sector SPDR Fund), the XLK (Technology Select Sector SPDR), etc.
On the other hand, a cryptocurrency trader could add more currency pairs and sector indicators, such as BTCUSDSHORTS (Bitfinex), USDT.D (Tether Dominance), etc.
If the chart becomes too cluttered, you can use the option to show only the number of divergences or only the indicator abbreviations.
Or even disable certain indicators and symbols, if they are not of interest to you.
I hope this script is useful.
Don't forget to support LonesomeTheBlue's work too.

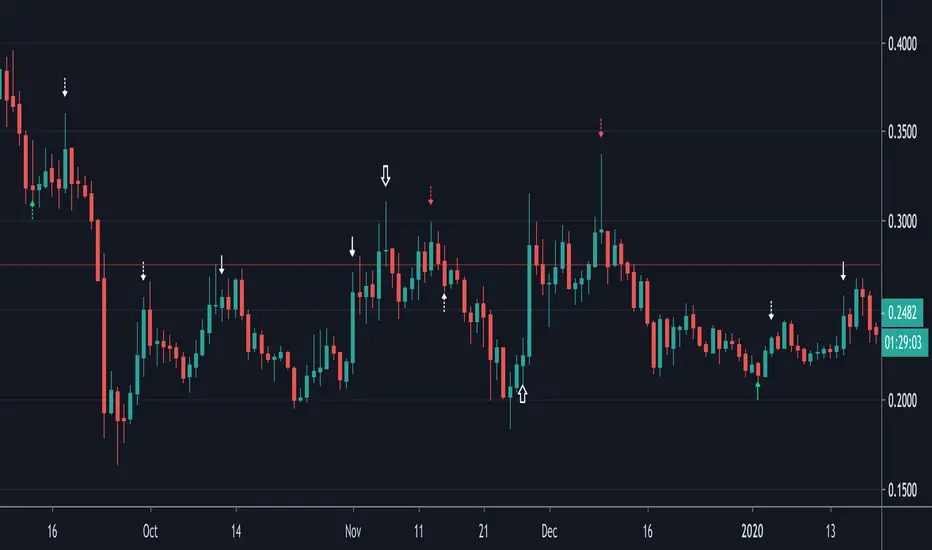
Divergence RSI V2This indicator is based on the concept of divergence. I recommend that you find out and study about this yourself as the concept of divergence will not be explained in depth in this description.
This indicator will show divergences between the asset price and the RSI oscillator. The indicator will look for divergent points between the rising highs and falling lows of the asset; and the rising lows and falling highs of the RSI.
The trend of the asset tends to follow the behavior of the oscillator when a divergence occurs. So if we find a divergence between the two, the price of the asset is likely to follow the trend of the oscillator.
This indicator looks for these types of divergences and will show (based on the RSI) if there is a bullish or bearish divergence.
If it is bullish, it will show a line joining those points in green and if it is bearish in red. In addition, it will show a label where you can see the number of occurrences that have been found from a certain point to another.
Note: this indicator can be complemented with the “Divergence V2” indicator which is also found in my library.
Settings
Backtesting Bars : is the number of bars back that the indicator will check. No more than 1000 is recommended as this will slow down the search.
Tolerance: number of times a divergent line can cross a bar. If you place 0, no bar can be crossed by a diverging line.
Min Bars To detect: will only search for divergences (or lines) that have the minimum number of bars selected in this option. Default option is 30.
Min Bars To detect: it will only search for divergences (or lines) that have the maximum number of bars selected in this option. Default option is 100.
Source Highs: The high points will be based on the close of each bar. You can use as another alternative.
Source Lows: The low points will be based on the close of each bar. You can use as another alternative.
Use squeeze parameter: only look for divergences (bullish or bearish) at times when such an indicator is in favor of the trend or coincides with the corresponding RSI divergence.
Divergence Indicator with alertsFirst time I've published a script so go easy!
All credit goes to @yatrader2 for the script, I have just made it easier to set alerts on it.
Enjoy!

Divergences: Price × RSI × OBV The Triple Confirmation Divergence indicator is a sophisticated momentum and volume-based tool designed to identify high-probability trend exhaustion points and potential reversals. It moves beyond traditional single-indicator divergence analysis by synthesizing signals from three core pillars of technical analysis: Price Action, Momentum, and Volume Flow.
This indicator works better on the time frames: 1H, 4H, 1D, 1W and 1M.

Sniper Stochastics 2 Sniper Stochastics 2 is like the other one - a triple stochastics consisting of different lengths, in this case 55,89,144.
One thing I noticed was that the stochastics lines can be a kind of divergence detector with the slow (red), medium (blue) and fast(black) lines making breakaways once they converge.
For example, if the lines are together and the black line starts to diverge upwards, it means that there is a positive divergence which will happen quickly and then end. The blue and the red lines are longer term divergences.
I wanted to share this one and the unique and interesting use of divergences with this indicator.
Divergence Detector with GradingIt detects divergences in real time and grades the divergence based on the probability of that divergence playing out. It will grade divergences with a higher grade if near major support and resistantance levels.

Divergences (Pivots)I created the divergence indicator using pivot points.
Leftbars and Rightbars of Pivots are the same here and taken together as "Div Period", default set as 2 (= "Short" period).
The second period ("Long") multiplies this by 2, if a period of 2 is set, the "Long" period will be 4.
The third period ("Long2") multiplies the "Long" by 2, in this case the "Long2" period would be 8.
In these periods the high and lows of "source" (default = "close", can be changed though) and "RSI" are captured and compared.
The default "RSI length" of "14" can be changed as well.
"Short", "Long" and "Long2" periods can be made visible together or separately (Settings > Inputs).
I recommend to use a "Period" of "1" when using "W" charts, "1 or 2" on "D" charts, and "2 or 3" (maybe higher) when using lower timeframes.
Bullish divergences are "Green", Bearish divergences are "Red", Hidden divergences (Bullish and Bearish) are "White".
"Short" > "▲▼" (Bullish = Up, Bearish = Down)
"Long" > "∆∇" (Bullish = Up, Bearish = Down)
"Long2" > "⇧⇩" (Bullish = Up, Bearish = Down)
The "Values" of "HH"(Higher High), "LL" (Lower Low"), "HL"(Higher Low) & "LH"(Lower High) can be made visible (Settings > Inputs).
Thank you!
Divergence DetectorOverview:
- Identifies divergence on the specified indicator. Support for additional indicators in development.
- Divergence labels indicate strength of divergence, making it easy to spot stronger divergence.
- Fully customizable (including inputs for indicator type and length, pivot lengths, divergence type, lookback range, price source, and more), allowing you to see exactly what you want based on your chart type and timeframe.
Inputs:
See tooltips on Inputs page in settings.
Please report any issues/bugs, enhancement suggestions, or requests for additional indicator support.
RSI Divergence Scanner by zdmreDivergence is when the price of an asset is moving in the opposite direction of a technical indicator, such as an oscillator, or is moving contrary to other data. Divergence warns that the current price trend may be weakening, and in some cases may lead to the price changing direction.
If the stock is rising and making new highs, ideally the RSI is reaching new highs as well. If the stock is making new highs, but the RSI starts making lower highs, this warns the price uptrend may be weakening. This is negative divergence.
Positive divergence is the opposite situation. Imagine the price of a stock is making new lows while the RSI makes higher lows with each swing in the stock price. Investors may conclude that the lower lows in the stock price are losing their downward momentum and a trend reversal may soon follow.
Divergence is one of the common uses of many technical indicators, primarily the oscillators.
Use it at your own risk

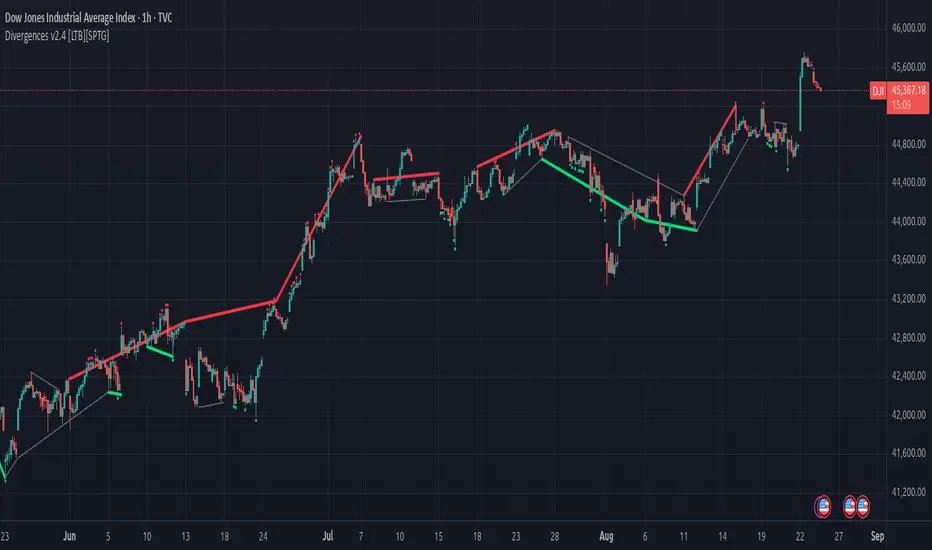
Divergences v2.4 [LTB][SPTG]Open-source credit & license
Original author: LonesomeTheBlue.
This fork by: sirpipthegreat — with attribution to the original work.
License: Open-source, published under the MPL-2.0 (same license header in the code).
I am publishing this open-source in accordance with TradingView’s Open-source reuse rules.
What’s new:
- Fixes & stability (addresses “historical offset beyond buffer” errors)
- Capped and validated all historical indexing with guarded lookbacks (e.g., min(…, 200) style limits) to prevent referencing data beyond the buffer on shorter histories/thin symbols.
- Refactored highest/lowest bars scans to obey the cap and avoid cumulative overflows on long sessions.
- Added per-bar counters with safety clamps to ensure it never exceeds available history.
- Ensured HTF switching doesn’t create invalid offsets when the higher timeframe compresses history.
Modernization & user control:
- Pine v6 upgrade and re-organization of logic for clarity/performance.
- More predictable tops/bottoms detection.
What it does:
- Detects regular (trend-reversal) and optional hidden (trend-continuation) divergences between price swing tops/bottoms and the selected oscillator(s).
- Computes candidate pivots with a light HTF alignment to reduce micro-noise; validates divergence when oscillator and price move in opposite directions across those pivots.
- Plots colored lines/labels on price to highlight bearish (regular & hidden) and bullish (regular & hidden) patterns.
How to use:
- Choose the oscillator set you trust (start with RSI + MACD).
- Consider confluence (S/R, volume, trend filters). This tool only identifies conditions
Divergence Indicator [Nic]This divergence indicator can track the correlation between one or more symbols. I use it to track the divergences between the VIX volatility index, gold, bonds, as well as other market leading indicators.
When using with Vix, lower coefficients can lead to false signals. When in a high vix bear market signals, there is more noise and more false (or missing) signals can occur. Please use with other technical tools.

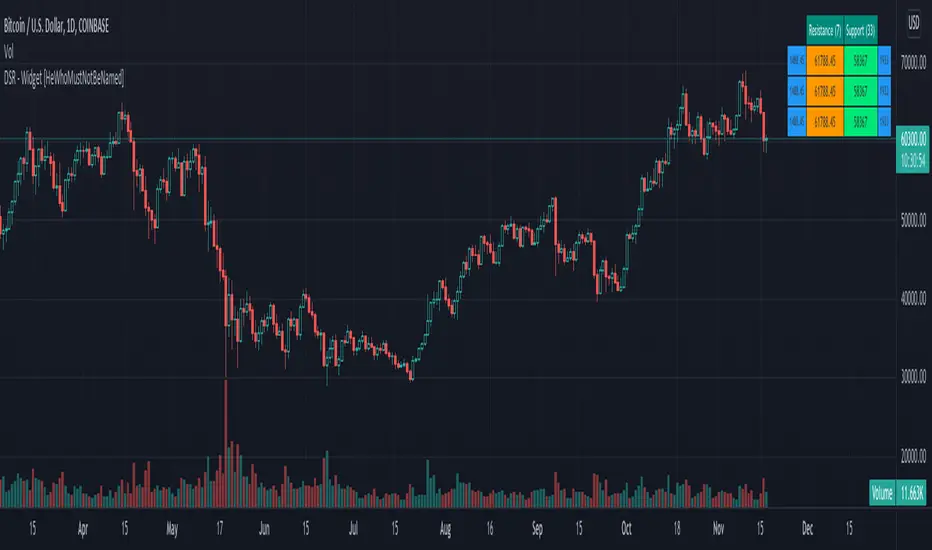
Divergence-Support/Resistance - Widget [HeWhoMustNotBeNamed]Unique live widget which provides information about support and resistance along with distance to immediate levels.
⬜ Custom Candle Source
Three options of candles available
▶ Regular OHLC candles
▶ Heikin-Ashi candles ( Taken leaf out of @Bjorgum's book - but, still could not do it as good as him :) )
▶ Moving average candles
⬜ Multiple zigzags and choice of oscillator
Like any other zigzag based indicator, I prefer using 4 zigzag levels.
And select oscillator of your choice to identify divergence. Oscillator lengths are automatically calculated based on zigzag lengths. You can also chose external oscillator.
⬜ Support and resistance widget settings
▶ Max S/R per zigzag - this is the number of last S/R levels recorded for each zigzag
▶ Max S/R for stats - even though there can be many number of S/R levels, we cannot show all of them in the widget due to space constraint. Hence, this is set to minimal value of 3. Can be changed via this input.
▶ Max S/R for Alerts - When sending stats through alerts, users can decide how many immediate S/R levels to be sent in them.
▶ Alert Choices - Can chose to get alerts when new S/R levels formed and also when existing S/R levels broken.
Personally think it is a very handy widget to have!!

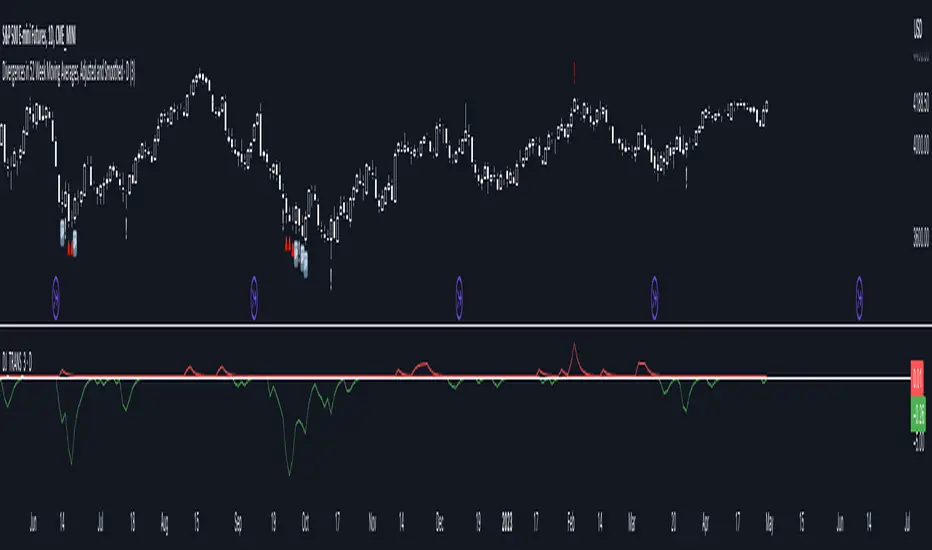
Divergences in 52 Week Moving Averages, Adjusted and SmoothedThis script description is intended to be holistic and comprehensive for the understanding of the interested parties who view the script.
Following the PineCoders suggestions, I have provided detailed breakdowns both within the code and in the description immediately below:
► Description
This description is intended to be detailed and meaningful, conveying the understanding of the script’s intention to the user:
The theory: Divergences and extreme readings in 52-Week highs on major indexes can provide a view into a potential pending move in the opposite direction of how the market has been trending. By comparing the 52-Week Hi/Lo indices and applying an Exponential Moving Average (EMA), we can assess how extreme a move is from the average. If the move provides an extreme reading, it would potentially be beneficial to “fade” the move (take a position in the opposing direction).
The intention: The intentionality of this script is to provide a visualization of when the highly-probable opportunity to fade over a multi-day or multi-week period arises. In addition to this, based on backtesting prior moves and reading the various levels of significant reversals, three tiers: “Standard”, “Sensitive”, and “Highly Sensitive” have been applied, the user can choose which sensitivity level they would like to see, there are far less false positives on the Standard and Sensitive settings, while Highly Sensitive often signals multiple times with the move coming a few days later.
The application: The settings allow the user to customize their sensitivity to the fade signals, with the ability to customize the visual that shows up as well. For higher-highs that are fade-worthy, the signal will appear on the top of the candle, for lower-lows that are fade-worthy, the signal will appear on the bottom of the candle. The users risk criteria should be the primary driver of the entry/exit, although when backtesting it appears that the significant move is typically completed within a 2-4 week period at max and 3-5 day period at minimum.
A personal note: I am a futures trader intraday but would very strongly caution users when using this strategy with futures (unless their risk tolerance is higher than most). The most beneficial strategy when fading moves would be to enter in tranches, starting at the first signal and adding on any pullback (as long as the pullback is not below the initial entry point). 1-6 Week Date-To-Expiry options would be the primary method for applying this strategy. I would also like to add that SPY/SPX options (SPDR S&P 500 ETF Trust / CBOE S&P 500 Index) are the most liquid options that could be applied in this strategy.
► Description (additional)
With the understanding that few users can read pinescript (Pine), the description above contains all of the necessary information that is necessary for a user to understand the intention for script utilization. For those who do understand Pine, the code is commented in each section in order to provide an understanding of the underlying functions, calculations, and thought process that went on during the writing of the script.
► Description (additional)
This script’s description contains no delegations, all aspects of the script as well as the initial idea behind it are contained in the description above, which is self-contained in it’s entirety with a clear and defined purpose that is written with the intent to holistically capture the intent of the potential use for this indicator.
► General House Rule #2
This script and the description (as well as my profile) contain no links or associations to promotion of any kind, I am not a business, I am not an individual that will in any way make money from this script or the promotion of another person, idea, company, entity, or legal persons (foreign or domestic).
► Originality and usefulness
This is an original and custom script (and idea) that is not a rehashing or a copy of any code from any other programmers in the tradingview community.
Divergences multi timeframeMT div monitor, add your own input for divs under expressions. Add them to the original bulldivs or beardivs with +. Set div_threshold in inputs.
