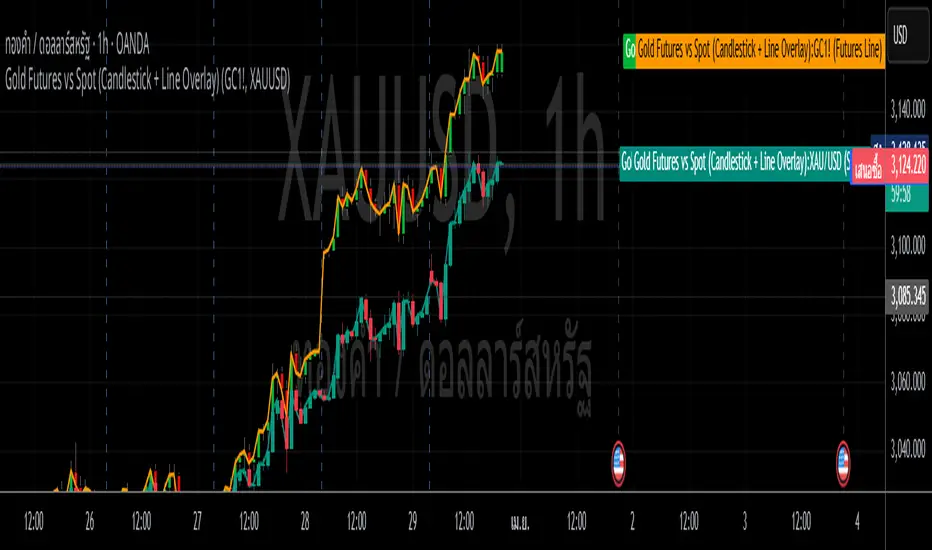
Gold Futures vs Spot (Candlestick + Line Overlay)📝 Script Description: Gold Futures vs Spot
This script was developed to compare the price movements between Gold Futures and Spot Gold within a specific time frame. The primary goals of this script are:
To analyze the price spread between Gold Futures and Spot
To identify potential arbitrage opportunities caused by price discrepancies
To assist in decision-making and enhance the accuracy of gold market analysis
🔧 Key Features:
Fetches price data from both Spot and Futures markets (from APIs or chart sources)
Converts and aligns data for direct comparison
Calculates the price spread (Futures - Spot)
Visualizes the spread over time or exports the data for further analysis
📅 Date Created:
🧠 Additional Notes:
This script is ideal for investors, gold traders, or analysts who want to understand the relationship between the Futures and Spot markets—especially during periods of high volatility. Unusual spreads may signal shifts in market sentiment or the actions of institutional players.
Cari dalam skrip untuk "Futures"
QQQ and SPY Price Levels [MW]Introduction:
Don’t let SPY and QQQ resistance levels hurt your futures trading anymore. The QQQ and SPY Price Levels indicator automagically provides easily accessible QQQ price levels for NASDAQ-related charts such as QQQ, /NQ and /MNQ futures, and leveraged ETFs such as TQQQ and SQQQ as well as for SPY price levels for S&P 500-related charts such as SPY, /ES and /MES futures, SPX, and leveraged ETFs such as UPRO and SPXU. If you’ve ever traded futures, or anything QQQ- or SPY-related and wanted to know at what price would the corresponding asset reach a key whole number level of QQQ or SPY, like 400, 440, 445, or even 447.50, this tool is for you. Key 10x, 5x, and even 2.5x multiples of QQQ and SPY can act as support or resistance for other related-assets. Until now, there hasn’t been an indicator that can serve as an easy visual cue to know exactly when that is about to happen across assets.
This indicator is a fork of the original SPY Price Levels indicator, which only considered SPY-related assets.
Settings:
QQQ/SPY 2.5x: Show closest levels above and below that are multiples of 2.5 on QQQ
QQQ/SPY 5x: Show closest levels above and below that are multiples of 5 on QQQ
QQQ/SPY 10x: Show closest levels above and below that are multiples of 10 on QQQ
Show QQQ/SPY Price Label: Show the current QQQ/SPY price
Extend lines to the left: Extend label lines for each price level to the beginning of the chart
Calculations:
This indicator defines the ratio between the price of QQQ/SPY and another NASDAQ/S&P-related asset and uses that multiplier once the user-defined price increments are defined. For example, if /MNQ is at 19000 and QQQ is at 465, then the ratio would be 40.8.
The incremental QQQ levels that are above and below the QQQ price are calculated using the following equations:
qqqLevelUp = _multiplier * math.ceil(_qqqClose / _multiplier)
qqqLevelDown = _multiplier * math.floor(_qqqClose / _multiplier)
The conversion ratio is then multiplied by that amount to get the final estimated corresponding price using the calculation:
levelUp := _conversion * qqqLevelUp
levelDown := _conversion * qqqLevelDown
For leveraged assets, the conversion must be used on the difference between the current QQQ price and the incremental upper and lower levels.
For example, the calculation for the next level up looks like the following:
levelUpDelta := math.abs(_qqqClose - qqqLevelUp)
levelUp := close + _conversion * (levelUpDelta * _leverage)
This logic is identical for SPY-related assets.
How to Use:
The QQQ and SPY Price Levels indicator aims to be as unobtrusive as possible. The default view shows 3 labels and 2 lines that are all aligned to the right of the main chart, so that it interferes as little as possible with any other indicators. It can be added to any /NQ or /MNQ futures chart, SQQQ, TQQQ, and, of course, QQQ as well as any /ES /MES futures chart, SPXU, UPRO, SPX, and of course SPY. The most immediate price levels for each multiplier appears above and below the current price along with the price of QQQ/SPY.
For example, MNQU2024 is currently at 19594. By looking at the indicator the next QQQ increment below is at 475, or 19556 on the MNQU2024 chart. This potential support is marked with a green label that shows both prices. The next increment above is at QQQ 477.50, or 19659 on the MESU2024 chart. And the QQQ price itself, is also shown (and can be removed) at 475.92.
QQQ and SPY price increments of 2.5, 5, and 10 tend to consistently act at the very least as emotional support and resistance levels. Weak, or weakening volume and/or momentum when these levels are hit can trigger a strong rejection, and can sometimes precipitate lengthy consolidation periods at those levels. Watching an NASDAQ- and S&P 500-related asset come to a halt, fall off a cliff, or react in some other unintuitive way could very well be the result of a QQQ/SPY level being reached. Even though many of us know that this relationship exists, it’s easy to forget. So, this indicator helps to ensure that its users keep that relationship front and center.
By extending the lines into the past on QQQ/SPY and their related assets, you can see what reactions happened at these key levels.
Other Usage Notes and Limitations:
The calculations used only provide an estimated relationship or a close approximation, and are not exact.
It's important for traders to be aware of the limitations of any indicator and to use them as part of a broader, well-rounded trading strategy that includes risk management, fundamental analysis, and other tools that can help with reducing false signals, determining trend direction, and providing additional confirmation for a trade decision. Diversifying strategies and not relying solely on one type of indicator or analysis can help mitigate some of these risks.

ILM NSE Futures - Open Interest Analysis - FnOUse this indicator on Daily Timeframe
This script works only on India NSE Futures (Indices and Fno Stocks)
This script pulls Stock/Index Price/Volume Info + Futures Current/Next Price/Volume/Open Interest Info
Calculates the Combined OI and identifies the OI Buildup based on the Price Change and color codes the info for easy reading
This script also calculates Stock/Futures Volume action to identify if big players are aggressively trading in Futures
Also OI Buildup to Future Volume is calculated to track the presence of big players.
Summary Row is displayed at the bottom which shows Futures Premium/Discount to Index/Stock

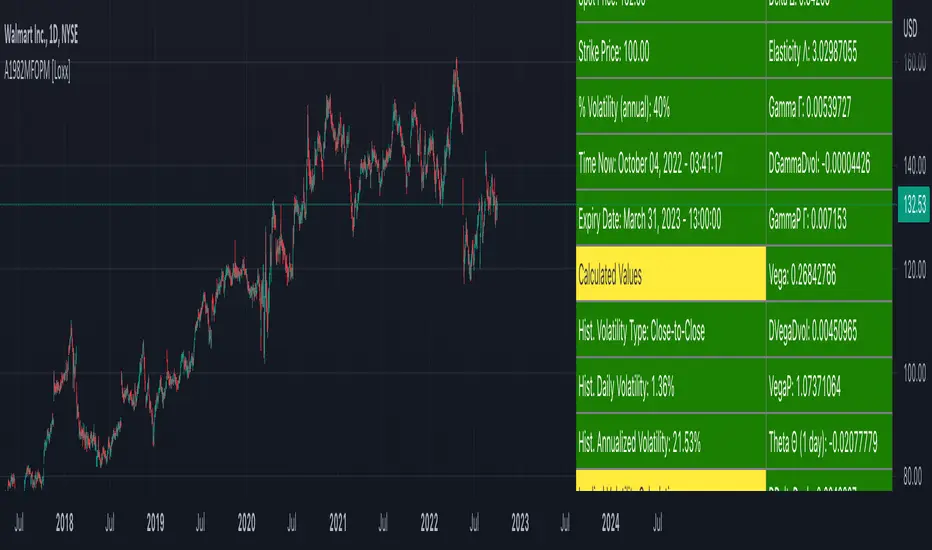
Asay (1982) Margined Futures Option Pricing Model [Loxx]Asay (1982) Margined Futures Option Pricing Model is an adaptation of the Black-Scholes-Merton Option Pricing Model including Analytical Greeks and implied volatility calculations. The following information is an excerpt from Espen Gaarder Haug's book "Option Pricing Formulas". This version is to price Options on Futures where premium is fully margined. This means the Risk-free Rate, dividend, and cost to carry are all zero. The options sensitivities (Greeks) are the partial derivatives of the Black-Scholes-Merton ( BSM ) formula. Analytical Greeks for our purposes here are broken down into various categories:
Delta Greeks: Delta, DDeltaDvol, Elasticity
Gamma Greeks: Gamma, GammaP, DGammaDvol, Speed
Vega Greeks: Vega , DVegaDvol/Vomma, VegaP
Theta Greeks: Theta
Probability Greeks: StrikeDelta, Risk Neutral Density
(See the code for more details)
Black-Scholes-Merton Option Pricing
The Black-Scholes-Merton model can be "generalized" by incorporating a cost-of-carry rate b. This model can be used to price European options on stocks, stocks paying a continuous dividend yield, options on futures , and currency options:
c = S * e^((b - r) * T) * N(d1) - X * e^(-r * T) * N(d2)
p = X * e^(-r * T) * N(-d2) - S * e^((b - r) * T) * N(-d1)
where
d1 = (log(S / X) + (b + v^2 / 2) * T) / (v * T^0.5)
d2 = d1 - v * T^0.5
b = r ... gives the Black and Scholes (1973) stock option model.
b = r — q ... gives the Merton (1973) stock option model with continuous dividend yield q.
b = 0 ... gives the Black (1976) futures option model.
b = 0 and r = 0 ... gives the Asay (1982) margined futures option model. <== this is the one used for this indicator!
b = r — rf ... gives the Garman and Kohlhagen (1983) currency option model.
Inputs
S = Stock price.
X = Strike price of option.
T = Time to expiration in years.
r = Risk-free rate
d = dividend yield
v = Volatility of the underlying asset price
cnd (x) = The cumulative normal distribution function
nd(x) = The standard normal density function
convertingToCCRate(r, cmp ) = Rate compounder
gImpliedVolatilityNR(string CallPutFlag, float S, float x, float T, float r, float b, float cm , float epsilon) = Implied volatility via Newton Raphson
gBlackScholesImpVolBisection(string CallPutFlag, float S, float x, float T, float r, float b, float cm ) = implied volatility via bisection
Implied Volatility: The Bisection Method
The Newton-Raphson method requires knowledge of the partial derivative of the option pricing formula with respect to volatility ( vega ) when searching for the implied volatility . For some options (exotic and American options in particular), vega is not known analytically. The bisection method is an even simpler method to estimate implied volatility when vega is unknown. The bisection method requires two initial volatility estimates (seed values):
1. A "low" estimate of the implied volatility , al, corresponding to an option value, CL
2. A "high" volatility estimate, aH, corresponding to an option value, CH
The option market price, Cm , lies between CL and cH . The bisection estimate is given as the linear interpolation between the two estimates:
v(i + 1) = v(L) + (c(m) - c(L)) * (v(H) - v(L)) / (c(H) - c(L))
Replace v(L) with v(i + 1) if c(v(i + 1)) < c(m), or else replace v(H) with v(i + 1) if c(v(i + 1)) > c(m) until |c(m) - c(v(i + 1))| <= E, at which point v(i + 1) is the implied volatility and E is the desired degree of accuracy.
Implied Volatility: Newton-Raphson Method
The Newton-Raphson method is an efficient way to find the implied volatility of an option contract. It is nothing more than a simple iteration technique for solving one-dimensional nonlinear equations (any introductory textbook in calculus will offer an intuitive explanation). The method seldom uses more than two to three iterations before it converges to the implied volatility . Let
v(i + 1) = v(i) + (c(v(i)) - c(m)) / (dc / dv (i))
until |c(m) - c(v(i + 1))| <= E at which point v(i + 1) is the implied volatility , E is the desired degree of accuracy, c(m) is the market price of the option, and dc/ dv (i) is the vega of the option evaluaated at v(i) (the sensitivity of the option value for a small change in volatility ).
Things to know
Only works on the daily timeframe and for the current source price.
You can adjust the text size to fit the screen
Signal Architect Stop-Hunt !GC. 15 MIN. 1.12.2026 . AM SESSIONSignal Architect™ — Developer Note
These daily posts are intentional.
They are designed to help potential users visually observe consistency—not just in outcomes, but in process—across multiple futures products, market conditions, and timeframes, using the Stop Hunt Indicator alongside my proprietary Signal Architect™ framework.
The goal is simple:
To show how structure, behavior, and probability repeat—every day—despite a constantly changing market.
If you follow these posts over time, you will begin to recognize that:
• The same behaviors appear across different futures contracts
• The same reactions occur on multiple timeframes
• The same structural traps and stop events repeat regardless of volatility regime
That consistency is not coincidence.
Consistency is the signal.
Over time, that consistency should become familiar—
and familiarity should become your edge.
________________________________________
🧠 What You’re Seeing (And Why It Matters)
This indicator includes a limited visual preview of a proprietary power signal I have personally developed and refined across:
• Futures
• Algorithmic trading systems
• Options structure
• Equity market behavior
Every tool I release is built around one core principle:
Clarity of direction without over-promising or over-fitting.
That is why all Signal Architect™ tools emphasize:
• Market structure first
• High-probability directional context
• Clear, visual risk framing
• No predictive claims
• No curve-fit illusions
What you see publicly is not the full system—only controlled, educational previews meant to demonstrate how structure and probability align in real markets.
________________________________________
📊 Background & Scope
Over the years, I have personally developed 800+ programs, including:
• Equity systems
• Futures strategies
• Options structure tools
• Dividend & income frameworks
• Portfolio construction and allocation logic
This includes 40+ Nasdaq-100 trading bots, several operating under extremely strict rule-sets and controlled deployment conditions.
Nothing shared publicly represents my complete internal framework.
Public posts exist for education, observation, and pattern recognition—not signals, not advice, and not promises.
________________________________________
🤝 For Those Who Find Value
If these daily posts help you see the market more clearly:
• Follow, boost, and share my scripts, Ideas, and MINDS posts
• Feel free to message me directly with questions or build requests
• Constructive feedback and collaboration are always welcome
For traders who want to go deeper, optional memberships may include:
• Additional signal access
• Early previews
• Occasional free tools and upgrades
🔗 Membership & Signals:
trianchor.gumroad.com
________________________________________
⚠️ Final Note
Everything published publicly is educational and analytical only.
Markets carry risk.
Discipline, patience, and risk management always come first.
Watch the consistency.
Study the structure.
Let the market repeat itself.
— Signal Architect™
________________________________________
🔗 Personally Developed GPT Tools
• AuctionFlow GPT
chatgpt.com
• Signal Architect™ Gamma Desk – Market Intelligence
chatgpt.com
• Gamma Squeeze Watchtower™
chatgpt.com

Signal Architect Stop-Hunt GOLD 5MINSignal Architect™ — Developer Note
These daily posts are intentional.
They are designed to help potential users visually observe consistency—not just in outcomes, but in process—across multiple futures products, market conditions, and timeframes, using the Stop Hunt Indicator alongside my proprietary Signal Architect™ framework.
The goal is simple:
To show how structure, behavior, and probability repeat—every day—despite a constantly changing market.
If you follow these posts over time, you will begin to recognize that:
• The same behaviors appear across different futures contracts
• The same reactions occur on multiple timeframes
• The same structural traps and stop events repeat regardless of volatility regime
That consistency is not coincidence.
Consistency is the signal.
Over time, that consistency should become familiar—
and familiarity should become your edge.
________________________________________
🧠 What You’re Seeing (And Why It Matters)
This indicator includes a limited visual preview of a proprietary power signal I have personally developed and refined across:
• Futures
• Algorithmic trading systems
• Options structure
• Equity market behavior
Every tool I release is built around one core principle:
Clarity of direction without over-promising or over-fitting.
That is why all Signal Architect™ tools emphasize:
• Market structure first
• High-probability directional context
• Clear, visual risk framing
• No predictive claims
• No curve-fit illusions
What you see publicly is not the full system—only controlled, educational previews meant to demonstrate how structure and probability align in real markets.
________________________________________
📊 Background & Scope
Over the years, I have personally developed 800+ programs, including:
• Equity systems
• Futures strategies
• Options structure tools
• Dividend & income frameworks
• Portfolio construction and allocation logic
This includes 40+ Nasdaq-100 trading bots, several operating under extremely strict rule-sets and controlled deployment conditions.
Nothing shared publicly represents my complete internal framework.
Public posts exist for education, observation, and pattern recognition—not signals, not advice, and not promises.
________________________________________
🤝 For Those Who Find Value
If these daily posts help you see the market more clearly:
• Follow, boost, and share my scripts, Ideas, and MINDS posts
• Feel free to message me directly with questions or build requests
• Constructive feedback and collaboration are always welcome
For traders who want to go deeper, optional memberships may include:
• Additional signal access
• Early previews
• Occasional free tools and upgrades
🔗 Membership & Signals:
trianchor.gumroad.com
________________________________________
⚠️ Final Note
Everything published publicly is educational and analytical only.
Markets carry risk.
Discipline, patience, and risk management always come first.
Watch the consistency.
Study the structure.
Let the market repeat itself.
— Signal Architect™
________________________________________
🔗 Personally Developed GPT Tools
• AuctionFlow GPT
chatgpt.com
• Signal Architect™ Gamma Desk – Market Intelligence
chatgpt.com
• Gamma Squeeze Watchtower™
chatgpt.com

Signal Architect Stop-Hunt Signal Architect™ — Developer Note
These daily posts are intentional.
They are designed to help potential users visually observe consistency—not just in outcomes, but in process—across multiple futures products, market conditions, and timeframes, using the Stop Hunt Indicator alongside my proprietary Signal Architect™ framework.
The goal is simple:
To show how structure, behavior, and probability repeat—every day—despite a constantly changing market.
If you follow these posts over time, you will begin to recognize that:
• The same behaviors appear across different futures contracts
• The same reactions occur on multiple timeframes
• The same structural traps and stop events repeat regardless of volatility regime
That consistency is not coincidence.
Consistency is the signal.
Over time, that consistency should become familiar—
and familiarity should become your edge.
________________________________________
🧠 What You’re Seeing (And Why It Matters)
This indicator includes a limited visual preview of a proprietary power signal I have personally developed and refined across:
• Futures
• Algorithmic trading systems
• Options structure
• Equity market behavior
Every tool I release is built around one core principle:
Clarity of direction without over-promising or over-fitting.
That is why all Signal Architect™ tools emphasize:
• Market structure first
• High-probability directional context
• Clear, visual risk framing
• No predictive claims
• No curve-fit illusions
What you see publicly is not the full system—only controlled, educational previews meant to demonstrate how structure and probability align in real markets.
________________________________________
📊 Background & Scope
Over the years, I have personally developed 800+ programs, including:
• Equity systems
• Futures strategies
• Options structure tools
• Dividend & income frameworks
• Portfolio construction and allocation logic
This includes 40+ Nasdaq-100 trading bots, several operating under extremely strict rule-sets and controlled deployment conditions.
Nothing shared publicly represents my complete internal framework.
Public posts exist for education, observation, and pattern recognition—not signals, not advice, and not promises.
________________________________________
🤝 For Those Who Find Value
If these daily posts help you see the market more clearly:
• Follow, boost, and share my scripts, Ideas, and MINDS posts
• Feel free to message me directly with questions or build requests
• Constructive feedback and collaboration are always welcome
For traders who want to go deeper, optional memberships may include:
• Additional signal access
• Early previews
• Occasional free tools and upgrades
🔗 Membership & Signals:
trianchor.gumroad.com
________________________________________
⚠️ Final Note
Everything published publicly is educational and analytical only.
Markets carry risk.
Discipline, patience, and risk management always come first.
Watch the consistency.
Study the structure.
Let the market repeat itself.
— Signal Architect™
________________________________________
🔗 Personally Developed GPT Tools
• AuctionFlow GPT
chatgpt.com
• Signal Architect™ Gamma Desk – Market Intelligence
chatgpt.com
• Gamma Squeeze Watchtower™
chatgpt.com

ORB | Feng FuturesThe ORB | Feng Futures indicator automatically detects the Opening Range Breakout (ORB) for each trading session, plotting the High, Low, and Midline in real time. This tool is built for futures traders who rely on ORB structure to confirm trends, identify breakout zones, and recognize reversal areas early in the session.
Features:
• Auto-calculated ORB High, Low, and Midline
• Multi-timezone session support (NY, Chicago, London, Tokyo, etc.)
• Customize ORB time range and time window for display
• Real-time updating lines that freeze at session close
• Optional labels with customizable size, color, and offset
• Save and view multiple previous ORB sessions
• Full color customization for all levels
• Automatically hides on higher timeframes (Daily+) to reduce clutter
• Works on ES, NQ, and all intraday futures charts
• Works on stocks, crypto, forex, and other tradeable assets where ORB is applicable
Disclaimer: This indicator is for educational purposes only and does not constitute financial advice. Trading futures involves significant risk and may not be suitable for all investors. Always do your own research and use proper risk management.

EMA + RSI Autotrade Webhook - VarunOverview
The EMA + RSI Autotrade Webhook is a powerful trend-following indicator designed for automated crypto futures trading. This indicator combines the reliability of Exponential Moving Average (EMA) crossovers with RSI momentum filtering to generate high-probability buy and sell signals optimized for webhook integration with crypto exchanges like Delta Exchange, Binance Futures, and Bybit.Key Features
Simple & Effective: Uses proven EMA 9/21 crossover strategy
RSI Momentum Filter: Eliminates low-probability trades in ranging markets
Webhook Ready: Two clean alerts (LONG Entry, SHORT Entry) for seamless automation
Exchange Compatible: Works with Delta Exchange, 3Commas, Alertatron, and other webhook platforms
Zero Lag Signals: Real-time alerts on crossover confirmation
Visual Clarity: Clean chart markers for easy signal identification
How It Works
Entry Signals:
LONG Entry: Triggers when EMA 9 crosses above EMA 21 AND RSI is above 52 (bullish momentum confirmed)
SHORT Entry: Triggers when EMA 9 crosses under EMA 21 AND RSI is below 48 (bearish momentum confirmed)
Technical Components:
Fast EMA: 9-period (tracks short-term price action)
Slow EMA: 21-period (identifies primary trend)
RSI: 14-period (confirms momentum strength)
RSI Long Threshold: 52 (filters weak bullish signals)
RSI Short Threshold: 48 (filters weak bearish signals)
Best Use Cases
Crypto Futures Trading: Bitcoin, Ethereum, Altcoin perpetual contracts
Automated Trading Bots: Integration with Delta Exchange webhooks, TradingView alerts
Timeframes: Optimized for 15-minute charts (works on 5min-1H)
Markets: Trending crypto markets with clear directional moves
Risk Management: Best used with 1-2% stop loss per trade (managed externally)
Webhook Automation Setup
Add indicator to your TradingView chart
Create alerts for "LONG Entry" and "SHORT Entry"
Configure webhook URL from your exchange (Delta Exchange, Binance, etc.)
Use alert message: Entry LONG {{ticker}} @ {{close}} or Entry SHORT {{ticker}} @ {{close}}
Exchange automatically reverses positions on opposite signals
Advantages
✅ No manual trading required - fully automated
✅ Eliminates emotional trading decisions
✅ Catches trending moves early with EMA crossovers
✅ RSI filter reduces whipsaws in choppy markets
✅ Works 24/7 without monitoring
✅ Simple two-alert system (easy to manage)
✅ Compatible with multiple exchanges via webhooksStrategy Philosophy
This indicator follows a trend-following with momentum confirmation approach. By waiting for both EMA crossover AND RSI confirmation, it ensures you're entering trades with genuine momentum behind them, not just random price noise. The tight RSI thresholds (52/48) keep you aligned with the prevailing trend.Recommended Settings
Timeframe: 15-minute (primary), 5-minute (scalping), 1-hour (swing)
Markets: BTC/USDT, ETH/USDT, high-liquidity altcoin perpetuals
Position Sizing: 100% capital per signal (exchange manages reversals)
Stop Loss: 2% (managed via exchange or external bot)
Leverage: 1-2x for conservative approach, up to 5x for aggressive
Important Notes
⚠️ This indicator generates entry signals only - position reversals are handled automatically by your exchange
⚠️ Always backtest on historical data before live trading
⚠️ Use proper risk management and position sizing
⚠️ Best performance in trending markets; may generate false signals in tight ranges
⚠️ Requires TradingView Premium or higher for webhook functionalityTags
cryptocurrency futures automated-trading ema-crossover rsi webhook delta-exchange tradingview-alerts trend-following momentum bitcoin ethereum crypto-bot algo-trading 15-minute-strategy

Friday’s Close – Futures Weekend AnchorPurpose:
This indicator highlights the US futures weekend close price — the exact level where CME markets end trading on Friday at 4:00 PM CT / 5:00 PM ET.
It’s designed primarily for crypto traders who want to compare weekend market behavior to the traditional finance (TradFi) close.
Why it matters:
Crypto trades 24/7, but global liquidity and sentiment still pivot around the Friday futures close. During the weekend, crypto can “drift” relative to traditional markets — this line shows exactly where the week ended for Wall Street, giving you a clean reference point until futures reopen on Sunday evening.
Features
Precise Friday close capture (CME weekend close minute, not just daily bar)
Works on any ticker — especially useful for BTC, ETH, or other crypto assets
Adjustable for time zone (New York / Chicago / custom)
Option to select prior weeks with weekOffset
Draws a single clean line from Friday’s close forward — no clutter, no vertical stitches
Optional right-edge label with the close value and timestamp
Usage Tips
Keep the chart’s timezone in sync with your anchor (America/New_York = 5 PM ET, America/Chicago = 4 PM CT).
Use weekOffset = 1 to view last week’s Friday close.
Combine with volume, funding, or open interest indicators to see how weekend moves relate to the TradFi close.
Ideal for weekend analysis — shows whether crypto is trading rich or cheap vs. the Friday benchmark before futures reopen.
Recommended For
Crypto traders, analysts, and quant enthusiasts who monitor TradFi–crypto decoupling or weekend premium behavior.

Adaptive Trend Breaks Adaptive Trend Breaks
## WHAT IT DOES
This script is a modified and enhanced version of "Trendline Breakouts With Targets" concept by ChartPrime.
Adaptive Trend Breaks (ATB) is a trendline breakout system optimized for scalping liquid futures contracts. The indicator automatically draws dynamic support and resistance trendlines based on pivot points, then generates trade signals when price breaks through these levels with confirmation filters. It includes automated target and stop-loss placement with real-time P&L tracking in dollars.
## HOW IT WORKS
**Trendline Detection Method:**
The indicator uses pivot high/low detection to identify significant price turning points. When a new pivot forms, it calculates the slope between consecutive pivots to draw dynamic trendlines. These lines extend forward based on the established trend angle, creating actionable support and resistance zones.
**Band System:**
Around each trendline, the script creates a "band" using a volatility-adjusted calculation: `ATR(14) * 0.2 * bandwidth multiplier / 2`. This adaptive band accounts for current market conditions - wider during volatile periods, tighter during quiet markets.
**Breakout Logic:**
A breakout signal triggers when:
1. Price closes beyond the trendline + band zone
2. Volume exceeds the 20-period moving average by your set multiplier (default 1.2x)
3. Price is within Regular Trading Hours (9:30-16:00 EST) if session filter enabled
4. Current ATR meets minimum volatility threshold (prevents trading dead markets)
**Target & Stop Calculation:**
Upon breakout confirmation:
- **Entry**: Trendline breach point
- **Target**: Entry ± (bandwidth × target multiplier) - default 8x for quick scalps
- **Stop**: Entry ± (bandwidth × stop multiplier) - default 8x for 1:1 risk/reward
- Multipliers adjust automatically to market volatility through the ATR-based band
**P&L Conversion:**
The script converts point movements to dollars using:
```
Dollar P&L = (Price Points × Contract Point Value × Quantity)
```
For example, a 10-point NQ move with 2 contracts = 10 × $20 × 2 = $400
## HOW TO USE IT
**Setup:**
1. Select your instrument (NQ/ES/YM/RTY) - point values auto-configure
2. Set contract quantity for accurate dollar P&L
3. Choose pivot period (lower = more signals but more noise, default 5 for scalping)
4. Adjust bandwidth multiplier if trendlines are too tight/loose (1-5 range)
**Filters Configuration:**
- **Volume Filter**: Requires breakout volume > moving average × multiplier. Increase multiplier (1.5-2.0) for higher conviction trades
- **Session Filter**: Enable to trade only RTH. Disable for 24-hour trading
- **ATR Filter**: Prevents signals during low volatility. Increase minimum % for more active markets only
**Risk Management:**
- Set target/stop multipliers based on your risk tolerance
- 8x bandwidth = approximately 1:1 risk/reward for most liquid futures
- Enable trailing stops for trend-following approach (moves stop to protect profits)
- Adjust line length to see targets further into the future
**Statistics Table:**
- Choose timeframe to analyze: all-time, today, this week, custom days
- Monitor win rate, profit factor, and net P&L in dollars
- Track long vs short performance separately
- See real-time unrealized P&L on active trades
**Reading Signals:**
- **Green triangle below bar** = Long breakout (resistance broken)
- **Red triangle above bar** = Short breakout (support broken)
- **White dashed line** = Entry price
- **Orange line** = Take profit target with dollar value
- **Red line** = Stop loss with dollar value
- **Green checkmark (✓)** = Target hit, winning trade
- **Red X (✗)** = Stop hit, losing trade
## WHAT IT DOES NOT DO
**Limitations to Understand:**
- Does not predict future trendline formations - it reacts to breakouts after they occur
- Historical trendlines disappear after breakout (not kept on chart for clarity)
- Requires sufficient volatility - may not signal in extremely quiet markets
- Volume filter requires exchange volume data (not available on all symbols)
- Statistics are indicator-based simulations, not actual trading results
- Does not account for slippage, commissions, or order fills
## BEST PRACTICES
**Recommended Settings by Market:**
- **NQ (Nasdaq)**: Default settings work well, consider volume multiplier 1.3-1.5
- **ES (S&P 500)**: Slightly slower, try period 7-8, volume 1.2
- **YM (Dow)**: Lower volatility, reduce bandwidth to 1.5-2
- **RTY (Russell)**: Higher volatility, increase bandwidth to 3-4
**Risk Management:**
- Never risk more than 2-3% of account per trade
- Use contract quantity calculator: Max Risk $ ÷ (Stop Distance × Point Value)
- Start with 1 contract while learning the system
- Backtest your specific timeframe and instrument before live trading
**Optimization Tips:**
- Increase pivot period (7-10) for fewer but higher-quality signals
- Raise volume multiplier (1.5-2.0) in choppy markets
- Lower target/stop multipliers (5-6x) for tighter profit taking
- Use trailing stops in strong trending conditions
- Disable session filter for overnight gaps and Asia session moves
## TECHNICAL DETAILS
**Key Calculations:**
- Pivot Detection: `ta.pivothigh(high, period, period/2)` and `ta.pivotlow(low, period, period/2)`
- Slope Calculation: `(newPivot - oldPivot) / (newTime - oldTime)`
- Adaptive Band: `min(ATR(14) * 0.2, close * 0.002) * multiplier / 2`
- Breakout Confirmation: Price crosses trendline + 10% of band threshold
**Data Requirements:**
- Minimum bars in view: 500 for proper pivot calculation
- Volume data required for volume filter accuracy
- Intraday timeframes recommended (1min - 15min) for scalping
- Works on any timeframe but optimized for fast execution
**Performance Metrics:**
All statistics calculate based on indicator signals:
- Tracks every signal as a trade from entry to TP/SL
- P&L in actual contract dollar values
- Win rate = (Winning trades / Total trades) × 100
- Profit factor = Gross profit / Gross loss
- Separates long/short performance for bias analysis
## IDEAL FOR
- Futures scalpers and day traders
- Traders who prefer visual trendline breakouts
- Those wanting automated TP/SL placement
- Traders tracking performance in dollar terms
- Multiple timeframe analysis (compare 1min vs 5min signals)
## NOT SUITABLE FOR
- Swing trading (targets too close)
- Stocks/forex without modifying point values
- Extremely low timeframes (<30 seconds) - too much noise
- Markets without volume data if using volume filter
- Illiquid contracts (signals may not execute at shown prices)
---
**Settings Summary:**
- Core: Period, bandwidth, extension, trendline style
- Filters: Volume, RTH session, ATR volatility
- Risk: R:R ratio, target/stop multipliers, trailing stop
- Display: Stats table position, size, colors
- Stats: Timeframe selection (all-time to custom days)
**License:** This indicator is published open-source under Mozilla Public License 2.0. You may use and modify the code with proper attribution.
**Disclaimer:** This indicator is for educational purposes. Past performance does not guarantee future results. Always practice proper risk management and test thoroughly before live trading.
---
## CREDITS & ATTRIBUTION
This script builds upon the "Trendline Breakouts With Targets" concept by ChartPrime with significant enhancements:
**Major Improvements Added:**
- **Futures-Specific Calculations**: Automated dollar P&L conversion using actual contract point values (NQ=$20, ES=$50, YM=$5, RTY=$50)
- **Advanced Statistics Engine**: Comprehensive performance tracking with customizable timeframe analysis (today, week, month, custom ranges)
- **Multi-Layer Filtering System**: Volume confirmation, RTH session filter, and ATR volatility filter to reduce false signals
- **Professional Trade Management**: Enhanced visual trade tracking with separate TP/SL lines, dollar value labels, and optional trailing stops
- **Optimized for Scalping**: Faster pivot periods (5 vs 10), tighter bands, and reduced extension bars for quick entries
Original trendline detection methodology by ChartPrime - used with modification under Mozilla Public License 2.0.

ADX - Globx Options & Futures 2.0The ADX Globx Options & Futures is a custom-built trend strength indicator designed to replicate and enhance the classic Average Directional Index (ADX) model, commonly used in professional trading platforms such as IQ Option.
This version is optimized for options and futures trading, providing precise directional strength readings through adaptive smoothing and configurable parameters.
Concept and Logic
This indicator measures the strength of the current trend, regardless of its direction (bullish or bearish), by comparing directional movement between price highs and lows over a defined period.
It uses three main components:
+DI (Positive Directional Indicator): represents bullish strength.
–DI (Negative Directional Indicator): represents bearish strength.
ADX (Average Directional Index): measures the intensity of the prevailing trend, independent of direction.
The script follows the original logic proposed by J. Welles Wilder Jr., but introduces enhanced smoothing flexibility.
Users can choose between EMA (Exponential Moving Average) and Wilder’s RMA (Running Moving Average) for both DI and ADX calculations, allowing closer alignment with various platform implementations (IQ Option, MetaTrader, etc.).
How It Works
Directional Movement Calculation
The script computes upward and downward movements (+DM and –DM) by comparing the differences in highs and lows between consecutive candles.
Only positive directional changes that exceed the opposite side are considered.
This ensures each bar contributes only one valid directional movement.
True Range and Smoothing
The True Range (TR) is calculated using ta.tr(true) to include price gaps—replicating how professional derivatives platforms account for volatility jumps.
Both TR and DM values are smoothed using the selected averaging method (EMA or Wilder).
Directional Index and ADX
The smoothed +DI and –DI values are normalized over the True Range to form the Directional Index (DX), which measures the percentage difference between the two.
The ADX is then derived by smoothing the DX values, providing a stable reading of overall market strength.
Visual Representation
The ADX (white line) indicates the overall trend strength.
The +DI (dark blue) and –DI (dark red) lines show which side (bullish or bearish) is currently dominant.
Reference levels at 20 and 25 serve as strength thresholds:
Below 20 → Weak or sideways market.
Above 25 → Strong and directional trend.
Usage and Interpretation
When ADX rises above 25, the market shows a strong trend — use +DI > –DI for bullish confirmation, or the opposite for bearish momentum.
A falling ADX suggests decreasing trend strength and potential consolidation.
The default parameters (ADX Length = 34, DI Length = 34, both smoothed by EMA) match IQ Option’s internal ADX configuration, ensuring consistency between platforms.
Works on any timeframe or asset class, but is especially tuned for futures and options volatility dynamics.
Originality and Improvements
Unlike many open-source ADX indicators, this version:
Recreates IQ Option’s 34-length EMA-based ADX calculation with exact parameter alignment.
Provides selectable smoothing algorithms (EMA or Wilder) to switch between modern and classic formulations.
Uses dark-theme-optimized visuals with fine line weight and subtle contrast for clean visibility.
Maintains constant guide levels (20/25) rendered globally for precision and style compliance in Pine Script v6.
Is fully rewritten for Pine Script v6, ensuring compatibility and optimized execution.
Recommended Use
Combine with trend-following systems or breakout strategies.
Ideal for identifying market strength before engaging in options directionals or futures entries.
Use the ADX to confirm breakout momentum or filter sideways markets.
Disclaimer
This script is for educational and analytical purposes. It does not constitute financial advice or a trading signal. Users are encouraged to validate the indicator within their own trading strategies and risk frameworks.

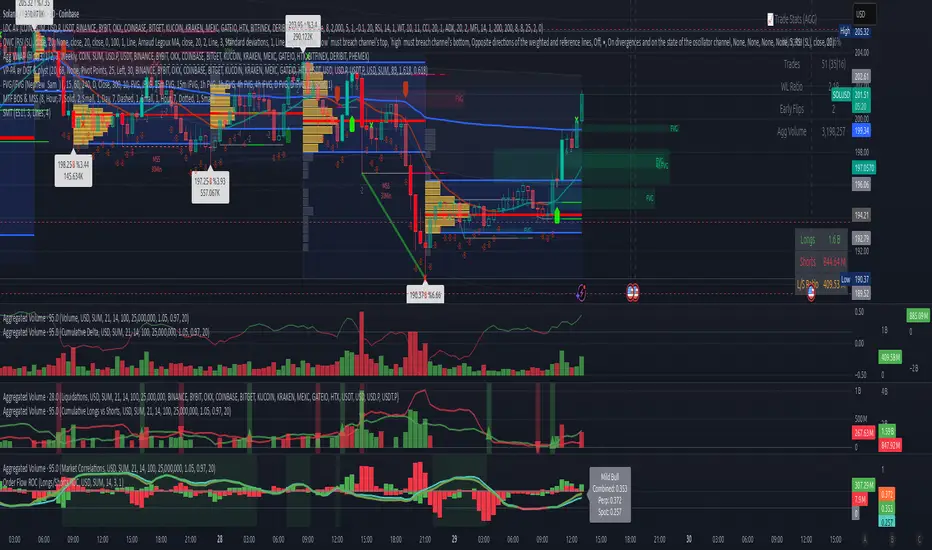
Volume Aggregated Spot & Futures -- Crypto (by plyst & more)📊 Volume Aggregated Spot & Futures - Enhanced Edition
🎯 Overview
Advanced volume aggregation indicator that combines spot and perpetual futures volume across the top 10 cryptocurrency exchanges. This enhanced version builds upon the original work by @HALDRO Project with optimized calculations and expanded functionality.
✨ Key Features
- 📈 Real-time aggregated volume from 10 major exchanges (Binance, Bybit, OKX, Coinbase, Bitget, KuCoin, Kraken, MEXC, Gate.io, HTX)
- 🔄 Multiple visualization modes: Volume, Delta, Cumulative Delta, Spot vs Perp analysis, Liquidations, OBV, and MFI
- 💱 Multi-currency support: Display volume in COIN, USD, or EUR
- 🎨 Clean, single-color bar chart showing total cumulative volume
- 📊 Multiple calculation methods: SUM, AVG, MEDIAN, VARIANCE
- 🎯 Separate spot (USDT, USD, USDC, etc.) and perpetual futures (.P contracts) tracking
🔧 Technical Improvements
✓ Corrected MFI formula for accurate money flow calculations
✓ Optimized volume aggregation logic with proper NA handling
✓ Support for 10 exchanges (up from 9)
✓ Streamlined codebase for better performance
✓ Updated perpetual contract naming conventions (.P format)
📖 Usage
Perfect for analyzing total market volume, identifying liquidation events, tracking buyer/seller pressure through delta analysis, and understanding the spot vs futures market dynamics.
🙏 Credits
Original concept and framework by @HALDRO Project. This version includes mathematical corrections, code optimizations, and expanded exchange support.
⚠️ Note
Aggregated volume is calculated from external exchange data using request.security(). Ensure your plan supports the necessary security calls for optimal performance.
Globex Overnight Futures ORB with FIB's by TenAMTrader📌 Globex Overnight Futures ORB with FIB’s – by TenAMTrader
This indicator is designed for futures traders who want to track the Globex Overnight Opening Range (ORB) and apply Fibonacci projections to anticipate potential support/resistance zones. It’s especially useful for traders who follow overnight sessions (such as ES, NQ, CL) and want to map out key levels before the U.S. regular session begins.
⚙️ How It Works
Primary Range (ORB):
You define a start and end time (default set to 18:00 – 18:15 EST). During this period, the script tracks the session high, low, and midpoint.
Opening Range Plots:
High Line (green)
Low Line (red)
Midpoint Line (yellow)
A shaded cloud between High–Mid and Mid–Low for easy visualization.
Fibonacci Projections:
Once the ORB is complete, the script calculates a full suite of Fibonacci retracements and extensions (e.g., 0.236, 0.382, 0.618, 1.0, 1.618, 2.0).
Standard key levels (0.618, 0.786, 1.0, etc.) are always shown if enabled.
Optional extended levels (1.236, 1.382, 1.5, 2.0, etc.) can be toggled on/off.
"Between Range" fibs (such as 0.382 and 0.618 inside the ORB) are also available for traders who like intra-range precision.
🔧 User Settings
Time Inputs: Choose your ORB start/end time.
Color Controls: Customize high, low, midpoint, and fib line colors.
Display Toggles: Turn on/off High, Low, Midpoint lines and Fibonacci projections.
Fib Extensions Toggle: Decide whether to show only major fibs or all extensions.
Alerts (Optional): Alerts can be set for crossing the ORB High, Low, or Midpoint.
📊 Practical Use Cases
Breakout Traders: Use the ORB high/low as breakout triggers.
Mean Reversion Traders: Watch for rejections near fib extension levels.
Overnight Futures Monitoring: Track Globex behavior to prepare for RTH open.
Risk Management: ORB and Fib levels make for natural stop/target placement zones.
⚠️ Disclaimer
This indicator is provided for educational and informational purposes only. It does not constitute financial advice, investment advice, or trading recommendations. Trading futures involves substantial risk of loss and may not be suitable for all investors. Always do your own due diligence and consult with a licensed financial professional before making trading decisions.

BTC CME Futures Gaps (BTCGapHunt_CME)BTC CME Futures Gaps Indicator
Overview
This indicator visualises price gaps between the daily close and open of Bitcoin CME futures (CME:BTC1!). These gaps are often revisited ("filled") by market price action and may serve as technical targets.
Thanks
... to Maven and the Blockchain Masons (x.com/Masons_DAO) to push me on this topic.
What Is a CME Gap?
CME Bitcoin Futures do not trade 24/7. Gaps form when the market reopens at a different price than where it last closed.
Gaps are often used as support/resistance or liquidity targets.
This indicator tracks, visualises, and alerts on these gaps.
Key Features
Automatic gap detection using daily open/close on CME:BTC1!
Dynamic gap size threshold based on ATR (Average True Range)
Highlight unfilled gaps and track partial fills visually
Alerts for gap formation and fill events
Parameter overlay showing real-time settings
Supported and Overrideable Parameters
ATR Length: Defines the lookback period for ATR calculation (default: 14)
Gap Size Multiplier: Multiplies the ATR to set the dynamic gap threshold (default: 1.0)
Proximity Threshold: Price distance from gap edge to consider it filled (default: 100 USD)
Max Gaps Tracked: Maximum number of concurrent gaps shown (default: 50)
Alerts Enabled: Toggle alerts for gap formation and gap fill events
How the Gap Size Is Calculated
Minimum Gap Size = ATR(14) * Gap Size Multiplier
ATR Length and Gap Size Multiplier are configurable.
Gap threshold adjusts dynamically with market volatility.
Visual Guide
Red Box: Fully unfilled gap
Lemon Yellow Box: Partially filled gap
Right Margin Boxes: Snapshot of unfilled gaps for quick access
Top-Right Panel: Current ATR, Gap Size, Thresholds, etc.
Alerts
Gap Formed: A new gap is detected.
Gap Filled: The gap is either partially or fully filled.
Recommended Timeframes
1H, 4H, 1D (best resolution)
Designed for BTC spot/perpetual charts (e.g., BTCUSD, BTCUSDT)
How To Use
Add the script to your BTC chart.
Monitor red/yellow boxes for unfilled gaps.
Check config panel for current threshold and settings.
Enable alerts via TradingView for real-time updates.
Notes
Up to 50 gaps are tracked (adjustable).
Data source: CME futures via request.security.
All visuals and alerts are time-synced with your chart.
Disclaimer
This script is for educational purposes only. Trade at your own risk.

Micro Futures Contract Calculator Micro Futures Contract Calculator
Synopsis: The Micro Futures Contract Calculator is a sleek, minimalist indicator that calculates the number of Micro E-mini Nasdaq-100 (MNQ) or S&P 500 (MES) contracts you can trade based on a fixed dollar risk and stop-loss (in ticks). Displayed in a compact, professional table in the top-right corner, it shows your risk, stop-loss, contract type, and calculated contracts, helping traders maintain consistent risk management.
How to Use:
Add the indicator to your chart (search “Micro Futures Contract Calculator”).
In settings, input:
Maximum Risk ($): Your total risk per trade (e.g., $100).
Stop-Loss (Ticks): Stop-loss size in ticks (e.g., 20 ticks = 5 points).
Contract Type: Select MNQ or MES.
Check the top-right table for:
Risk, stop-loss, contract type, and number of contracts (e.g., “10” for MNQ, “4” for MES).
Use the contract number to size trades, ensuring risk stays fixed.
Why Standardized Risk is Important:
Consistency: Fixed risk per trade (e.g., $100) prevents oversized losses, stabilizing long-term performance.
Discipline: Removes emotional guesswork, enforcing a systematic approach across MNQ/MES trades.
Capital Protection: Limits exposure, preserving your account during losing streaks and volatile markets.
Scalability: Aligns position sizing with your risk tolerance, enabling confident scaling as your account grows.
This indicator simplifies risk management, making it essential for disciplined futures trading.

Bullish and Bearish Breakout Alert for Gold Futures PullbackBelow is a Pine Script (version 6) for TradingView that includes both bullish and bearish breakout conditions for my intraday trading strategy on micro gold futures (MGC). The strategy focuses on scalping two-legged pullbacks to the 20 EMA or key levels with breakout confirmation, tailored for the Apex Trader Funding $300K challenge. The script accounts for the Daily Sentiment Index (DSI) at 87 (overbought, favoring pullbacks). It generates alerts for placing stop-limit orders for 175 MGC contracts, ensuring compliance with Apex’s rules ($7,500 trailing threshold, $20,000 profit target, 4:59 PM ET close).
Script Requirements
Version: Pine Script v6 (latest for TradingView, April 2025).
Purpose:
Bullish: Alert when price breaks above a rejection candle’s high after a two-legged pullback to the 20 EMA in a bullish trend (price above 20 EMA, VWAP, higher highs/lows).
Bearish: Alert when price breaks below a rejection candle’s low after a two-legged pullback to the 20 EMA in a bearish trend (price below 20 EMA, VWAP, lower highs/lows).
Context: 5-minute MGC chart, U.S. session (8:30 AM–12:00 PM ET), avoiding overbought breakouts above $3,450 (DSI 87).
Output: Alerts for stop-limit orders (e.g., “Buy: Stop=$3,377, Limit=$3,377.10” or “Sell: Stop=$3,447, Limit=$3,446.90”), quantity 175 MGC.
Apex Compliance: 175-contract limit, stop-losses, one-directional news trading, close by 4:59 PM ET.
How to Use the Script in TradingView
1. Add Script:
Open TradingView (tradingview.com).
Go to “Pine Editor” (bottom panel).
Copy the script from the content.
Click “Add to Chart” to apply to your MGC 5-minute chart .
2. Configure Chart:
Symbol: MGC (Micro Gold Futures, CME, via Tradovate/Apex data feed).
Timeframe: 5-minute (entries), 15-minute (trend confirmation, manually check).
Indicators: Script plots 20 EMA and VWAP; add RSI (14) and volume manually if needed .
3. Set Alerts:
Click the “Alert” icon (bell).
Add two alerts:
Bullish Breakout: Condition = “Bullish Breakout Alert for Gold Futures Pullback,” trigger = “Once Per Bar Close.”
Bearish Breakout: Condition = “Bearish Breakout Alert for Gold Futures Pullback,” trigger = “Once Per Bar Close.”
Customize messages (default provided) and set notifications (e.g., TradingView app, SMS).
Example: Bullish alert at $3,377 prompts “Stop=$3,377, Limit=$3,377.10, Quantity=175 MGC” .
4. Execute Orders:
Bullish:
Alert triggers (e.g., stop $3,377, limit $3,377.10).
In TradingView’s “Order Panel,” select “Stop-Limit,” set:
Stop Price: $3,377.
Limit Price: $3,377.10.
Quantity: 175 MGC.
Direction: Buy.
Confirm via Tradovate.
Add bracket order (OCO):
Stop-loss: Sell 175 at $3,376.20 (8 ticks, $1,400 risk).
Take-profit: Sell 87 at $3,378 (1:1), 88 at $3,379 (2:1) .
Bearish:
Alert triggers (e.g., stop $3,447, limit $3,446.90).
Select “Stop-Limit,” set:
Stop Price: $3,447.
Limit Price: $3,446.90.
Quantity: 175 MGC.
Direction: Sell.
Confirm via Tradovate.
Add bracket order:
Stop-loss: Buy 175 at $3,447.80 (8 ticks, $1,400 risk).
Take-profit: Buy 87 at $3,446 (1:1), 88 at $3,445 (2:1) .
5. Monitor:
Green triangles (bullish) or red triangles (bearish) confirm signals.
Avoid bullish entries above $3,450 (DSI 87, overbought) or bearish entries below $3,296 (support) .
Close trades by 4:59 PM ET (set 4:50 PM alert) .

strategy_helpersThis library is designed to aid traders and developers in calculating risk metrics efficiently across different asset types like equities, futures, and forex. It includes comprehensive functions that calculate the number of units or contracts to trade, the value at risk, and the total value of the position based on provided entry prices, stop levels, and risk percentages. Whether you're managing a portfolio or developing trading strategies, this library provides essential tools for risk management. Functions also automatically select the appropriate risk calculation method based on asset type, calculate leverage levels, and determine potential liquidation points for leveraged positions. Perfect for enhancing the precision and effectiveness of your trading strategies.
Library "strategy_helpers"
Provides tools for calculating risk metrics across different types of trading strategies including equities, futures, and forex. Functions allow for precise control over risk management by calculating the number of units or contracts to trade, the value at risk, and the total position value based on entry prices, stop levels, and desired risk percentage. Additional utilities include automatic risk calculation based on asset type, leverage level calculations, and determination of liquidation levels for leveraged trades.
calculate_risk(entry, stop_level, stop_range, capital, risk_percent, trade_direction, whole_number_buy)
Calculates risk metrics for equity trades based on entry, stop level, and risk percent
Parameters:
entry (float) : The price at which the position is entered. Use close if you arent adding to a position. Use the original entry price if you are adding to a position.
stop_level (float) : The price level where the stop loss is placed
stop_range (float) : The price range from entry to stop level
capital (float) : The total capital available for trading
risk_percent (float) : The percentage of capital risked on the trade. 100% is represented by 100.
trade_direction (bool) : True for long trades, false for short trades
whole_number_buy (bool) : True to adjust the quantity to whole numbers
Returns: A tuple containing the number of units to trade, the value at risk, and the total value of the position:
calculate_risk_futures(risk_capital, stop_range)
Calculates risk metrics for futures trades based on the risk capital and stop range
Parameters:
risk_capital (float) : The capital allocated for the trade
stop_range (float) : The price range from entry to stop level
Returns: A tuple containing the number of contracts to trade, the value at risk, and the total value of the position:
calculate_risk_forex(entry, stop_level, stop_range, capital, risk_percent, trade_direction)
Calculates risk metrics for forex trades based on entry, stop level, and risk percent
Parameters:
entry (float) : The price at which the position is entered. Use close if you arent adding to a position. Use the original entry price if you are adding to a position.
stop_level (float) : The price level where the stop loss is placed
stop_range (float) : The price range from entry to stop level
capital (float) : The total capital available for trading
risk_percent (float) : The percentage of capital risked on the trade. 100% is represented by 100.
trade_direction (bool) : True for long trades, false for short trades
Returns: A tuple containing the number of lots to trade, the value at risk, and the total value of the position:
calculate_risk_auto(entry, stop_level, stop_range, capital, risk_percent, trade_direction, whole_number_buy)
Automatically selects the risk calculation method based on the asset type and calculates risk metrics
Parameters:
entry (float) : The price at which the position is entered. Use close if you arent adding to a position. Use the original entry price if you are adding to a position.
stop_level (float) : The price level where the stop loss is placed
stop_range (float) : The price range from entry to stop level
capital (float) : The total capital available for trading
risk_percent (float) : The percentage of capital risked on the trade. 100% is represented by 100.
trade_direction (bool) : True for long trades, false for short trades
whole_number_buy (bool) : True to adjust the quantity to whole numbers, applicable only for non-futures and non-forex trades
Returns: A tuple containing the number of units or contracts to trade, the value at risk, and the total value of the position:
leverage_level(account_equity, position_value)
Calculates the leverage level used based on account equity and position value
Parameters:
account_equity (float) : Total equity in the trading account
position_value (float) : Total value of the position taken
Returns: The leverage level used in the trade
calculate_liquidation_level(entry, leverage, trade_direction, maintenance_margine)
Calculates the liquidation price level for a leveraged trade
Parameters:
entry (float) : The price at which the position is entered
leverage (float) : The leverage level used in the trade
trade_direction (bool) : True for long trades, false for short trades
maintenance_margine (float) : The maintenance margin requirement, expressed as a percentage
Returns: The price level at which the position would be liquidated, or na if leverage is zero

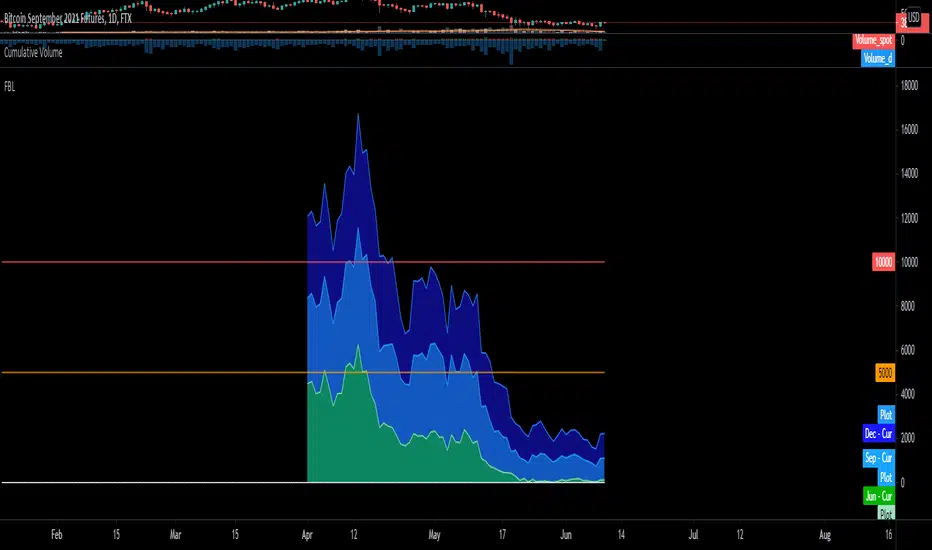
BTC FTX Futures PremiumsThis indicator shows the future BTC premiums on FTX.
The purple area is the Daily December Futures contract subtracted by the current price.
The blue area is the Daily September futures contract subtracted by the current price.
The green area is the Daily June futures contract subtracted by the current price.
You can use this to try and understand market sentiment.
If the current price dumps but the premium remains the same it likely means that sentiment is unchanged.
The opposite is true, if the price pumps and the premium is the same it means the market likely wasn't convinced by the movement.
The difference between the current price and the futures price can help determine how bullish or bearish a market or at extremes the level of euphoria.
ANN MACD : 25 IN 1 SCRIPTIn this script, I tried to fit deep learning series to 1 command system up to the maximum point.
After selecting the ticker, select the instrument from the menu and the system will automatically turn on the appropriate ann system.
Listed instruments with alternative tickers and error rates:
WTI : West Texas Intermediate (WTICOUSD , USOIL , CL1! ) Average error : 0.007593
BRENT : Brent Crude Oil (BCOUSD , UKOIL , BB1! ) Average error : 0.006591
GOLD : XAUUSD , GOLD , GC1! Average error : 0.012767
SP500 : S&P 500 Index (SPX500USD , SP1!) Average error : 0.011650
EURUSD : Eurodollar (EURUSD , 6E1! , FCEU1!) Average error : 0.005500
ETHUSD : Ethereum (ETHUSD , ETHUSDT ) Average error : 0.009378
BTCUSD : Bitcoin (BTCUSD , BTCUSDT , XBTUSD , BTC1!) Average error : 0.01050
GBPUSD : British Pound (GBPUSD,6B1! , GBP1!) Average error : 0.009999
USDJPY : US Dollar / Japanese Yen (USDJPY , FCUY1!) Average error : 0.009198
USDCHF : US Dollar / Swiss Franc (USDCHF , FCUF1! ) Average error : 0.009999
USDCAD : Us Dollar / Canadian Dollar (USDCAD) Average error : 0.012162
SOYBNUSD : Soybean (SOYBNUSD , ZS1!) Average error : 0.010000
CORNUSD : Corn (ZC1! ) Average error : 0.007574
NATGASUSD : Natural Gas (NATGASUSD , NG1!) Average error : 0.010000
SUGARUSD : Sugar (SUGARUSD , SB1! ) Average error : 0.011081
WHEATUSD : Wheat (WHEATUSD , ZW1!) Average error : 0.009980
XPTUSD : Platinum (XPTUSD , PL1! ) Average error : 0.009964
XU030 : Borsa Istanbul 30 Futures ( XU030 , XU030D1! ) Average error : 0.010727
VIX : S & P 500 Volatility Index (VX1! , VIX ) Average error : 0.009999
YM : E - Mini Dow Futures (YM1! ) Average error : 0.010819
ES : S&P 500 E-Mini Futures (ES1! ) Average error : 0.010709
GAZP : Gazprom Futures (GAZP , GZ1! ) Average error : 0.008442
SSE : Shangai Stock Exchange Composite (Index ) ( 000001 ) Average error : 0.011287
XRPUSD : Ripple (XRPUSD , XRPUSDT ) Average error : 0.009803
Note 1 : Australian Dollar (AUDUSD , AUD1! , FCAU1! ) : Instrument has been removed because it has an average error rate of over 0.13.
The average error rate is 0.1850.
I didn't delete it from the menu just because there was so much request,
You can use.
Note 2 : Friends have too many requests, it took me a week in total and 1 other script that I'll share in 2 days.
Reaching these error rates is a very difficult task, and when I keep at a low learning rate, they are trained for a very long time.
If I don't see the error rate at an average low, I increase the layers and go back into a longer process.
It takes me 45 minutes per instrument to command artificial neural networks, so I'll release one more open source, and then we'll be laying 70-80 percent of the world trade volume with artificial neural networks.
Note 3 :
I would like to thank wroclai for helping me with this script.
This script is subject to MIT License on behalf of both of us.
You can review my original idea scripts from my Github page.
You can use it free but if you are going to modify it, just quote this script .
I hope it will help everyone, after 1-2 days I will share another ann script that I think is of the same importance as this, stay tuned.
Regards , Noldo .

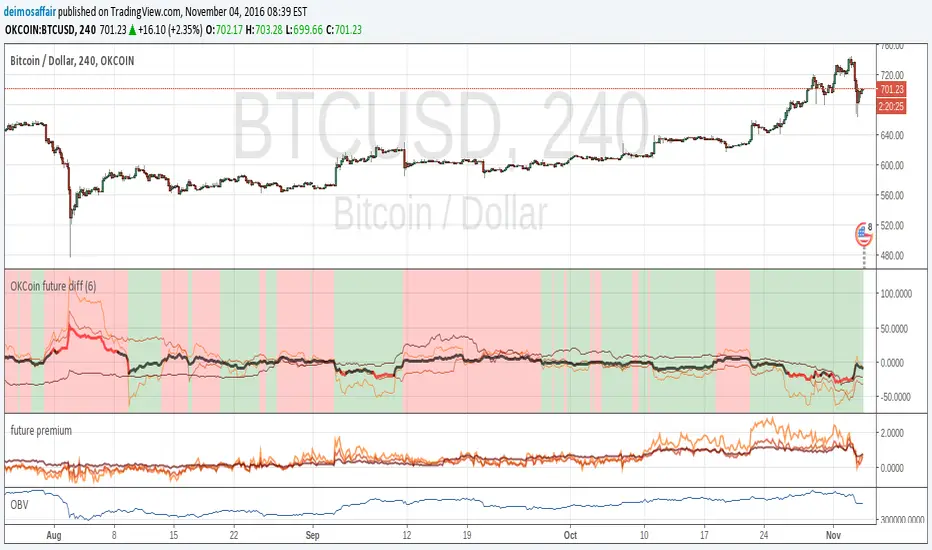
OKCoin future diffThis indicator checks the accuracy of okcoin futures against the current index. Example, check how the 1W future from 7 days ago matches the current spot value. The matches are on the 1W, 2W, 3M futures
The indicator bundles them together, makes a weighted average and shows it all.
the thin lines are the futures deltas for each of the futures(check the code to see the color of each).
the thick line is the compound indicator, the line is red when the value is too far off the spot price, black when it's <5%
background is green on "bullish", red for "bearish", take it as you want with many grains of salt :)
there is an input value (default = 1) to adjust time scales. the value is a multiplier for the number of periods in a day.
Example:
1D chart, input = 1
4h chart, input = 4h * 6 = 24h
using the incorrect adjustment for the wrong time scale, makes the indicator (even more) meaningless ;)
Index Vs Futures v4.0 (dashed edition)Generalized script of
Originally designed for bitcoin, but can be used to compare between futures and index (or any two symbol expressions).
Conventions:
- green background := futures deviates 'way above' index
- red background := futures deviates 'way below' index

Open Interest Weighted Average Price [Arjo]Open Interest Weighted Average Price , or OIWAP , is a simple visual indicator that shows the average price of an asset based on changes in open interest .
Instead of using trading volume like VWAP, this indicator gives more weight to prices where new futures contracts are being added or removed . This helps highlight the price levels where traders are actively building or closing positions.
The indicator shows:
A main line that represents the average price weighted by open interest changes.
Upper and lower bands (standard deviation bands) that show how far the price moves away from this average.
OIWAP is mainly useful for NSE futures markets , where open interest data is available. It helps traders visually understand where most market participation and positioning are taking place relative to price .
Concepts:
Applies statistical concepts, including weighted averaging and standard deviation, to open interest data
Uses the absolute change in open interest as a weighting factor for each price point
Creates a dynamic average that reflects where significant open interest activity has occurred during a given period
Standard deviation bands are computed from this weighted average to show the statistical spread of prices around the OIWAP line
Resets calculations based on user-selected time periods (daily, weekly, monthly, or session-based)
Allows for fresh analysis at regular intervals
Similar concept to volume-weighted average price (VWAP) indicators, but uses open interest changes as the weighting component
Features:
Weighted Average: Calculates a central line based on contract activity.
Flexible Anchors: Allows users to choose the reset period for the calculation.
Volatility Bands: Displays outer and mid-bands to visualize price stretches.
Data Check: Built-in alerts notify you if Open Interest data is missing for a symbol.
Visual Zones: Color-coded areas help identify price location at a glance.
How To Use
When you add the indicator to your chart, you will see:
A main OIWAP line — the open-interest-weighted price level
Mid-bands around the line (±0.5 standard deviations)
Outer bands farther away (±2.0 standard deviations)
Shaded background zones between these lines
You can:
Change the reset period to see how the average behaves over different time ranges
Adjust the timeframe for open-interest data
Turn mid-bands on or off
Adjust colors and styles to improve readability
Conclusion
The OIWAP indicator serves as an educational tool for visualizing the relationship between price movements and open interest activity in futures markets
Presents a weighted average price line along with statistical deviation bands
Offers a structured framework for chart analysis
Customizable settings allow users to adapt the display to their analytical preferences
Maintains focus on visual interpretation rather than directional predictions
Functions as a supplementary charting overlay that may complement other forms of technical and fundamental analysis
Disclaimer
This indicator is for educational and visual-analysis purposes only. It does not provide trading signals, financial advice, or guaranteed outcomes . You should perform your own research and consult a licensed financial professional when needed. All trading decisions are solely the responsibility of the user.
