RSI Golden & Dead Cross AlertRSI 14 Golden And Dead Cross Indicator
It will give you an alert when there are rsi golden and dead cross.
It is a intergated signal: Crossing up and Crossing down of RSI.
Cari dalam skrip untuk "GOLD"

MCX GOLD1! SpotHelps convert MCX gold rolling contract symbol to spot price.
Note: It cant accurately infer the contract role date, so it makes some assumptions, use the rolldays to adjust where needed

Fib Golden RatioDynamic Fib High → Low (0.5 & 0.618)
This indicator automatically tracks the current day’s High and Low and plots the key Fibonacci retracement levels 0.5 (50%) and 0.618 (Golden Ratio) based on the live intraday price range.
The tool is designed for traders who want simple, clean, and dynamic intraday Fibonacci levels without clutter on the chart.
How It Works
Detects the start of a new trading day
Tracks the highest high and lowest low of the current day
Continuously recalculates:
Fibonacci 0.5 (Midpoint)
Fibonacci 0.618 (Golden Ratio)
Plots clean continuous lines across the chart
Fib is calculated from High → Low, matching how typical intraday fib tools are visually applied
Why This Indicator
No drawings to manually adjust
No user configuration required
Extremely lightweight and fast
Automatically adjusts as the day progresses
Perfect for identifying intraday mean reversion zones, pullback zones, and reaction levels
Ideal Use Cases
Intraday directional trading
Scalping pullbacks
Mean reversion setups
Identifying dynamic support/resistance zones
Option scalping (CE/PE)

Auto Golden Pockets + Extensions (Clean Labels)This indicator automatically detects the latest confirmed swing high and swing low, determines the current trend direction, and plots the most important Fibonacci retracement and extension levels. Once a new swing forms, the script instantly redraws clean 0.382, 0.500, and 0.618 “Golden Pocket” retracements, along with 1.382, 1.618, and 2.0 extensions. Negative-side Fibonacci projections are also included for deeper pullbacks or overextensions.
Using Fibonacci levels is powerful because markets often move in proportional waves. These ratios—especially the golden pocket (0.618–0.5)—tend to align with areas where algorithms, institutions, and repeatable market psychology create high-probability reaction zones. Whether price is retracing or breaking out, these levels help traders anticipate where reversals, continuations, or strong inflection points are most likely to occur.
This tool keeps your chart clean, automatic, and always aligned with the most recent market structure.

Penny Stock Golden Cross ScannerPenny Stock Golden Cross Scanner
Scan and track potential breakout opportunities in penny stocks with this Golden Cross Scanner. Designed for traders looking at low-priced, high-volume stocks, this indicator identifies bullish setups using 50, 100, and 200-period moving averages.
Key Features:
✅ Monitors up to 10 user-defined tickers.
✅ Filters penny stocks by maximum price and minimum volume.
✅ Detects proximity to 100 MA and 200 MA for potential golden cross or support/resistance signals.
✅ Assigns signal tiers for each stock (Tier 1 🔥, Tier 2 ⚡, Tier 3 📊) based on price action relative to moving averages.
✅ Customizable scanner table with position options on the chart.
✅ Real-time plotting of 50, 100, and 200 moving averages for context.
✅ Option to display only stocks currently generating signals.

Intraday Fibonacci Retracement Golden pocket for scalping# Intraday Fibonacci Retracement Golden pocket for scalping
## Overview
This advanced Pine Script indicator provides dynamic Fibonacci retracement levels specifically designed for intraday trading. Using proprietary AI-powered algorithms, the script automatically identifies optimal high and low reference points to generate precise Fibonacci levels that adapt in real-time throughout the trading day.
## Key Features
### 🎯 Dynamic Level Generation
- **Intelligent Auto-Detection**: Advanced algorithm automatically identifies key price levels using machine learning-based pattern recognition
- **Real-Time Updates**: Fibonacci levels dynamically adjust as new highs or lows are established during the session
- **Seven Core Levels**: 0% (LOD), 23.6%, 38.2%, 50%, 61.8%, 78.6%, and 100% (HOD)
### 📊 Visual Customization
- **Individual Level Control**: Show or hide any Fibonacci level independently
- **Custom Color Schemes**: Assign unique colors to each retracement level for easy identification
- **Adjustable Line Width**: Choose line thickness from 1-5 pixels for optimal chart clarity
- **Professional Labeling**: Each level displays both percentage and exact price value
### 🏆 Golden Zone Highlighting
- **Automated Zone Detection**: Automatically highlights the critical 50%-61.8% retracement zone
- **Visual Emphasis**: Shaded area between these key levels for quick visual reference
- **Customizable Transparency**: Adjust the golden zone color and opacity to match your chart theme
### 🔧 Flexible Configuration Options
#### Label Management
- **Master Toggle**: Instantly show or hide all labels with a single switch
- **Individual Label Control**: Selective visibility for each Fibonacci level label
- **Custom Label Colors**: Choose distinct colors for each label to match your trading style
- **Price Display Format**: Labels show percentage and corresponding price level
#### Level Visibility
Independent toggles for each retracement level:
- 0% (Low of Day)
- 23.6% Retracement
- 38.2% Retracement
- 50% Retracement (Midpoint)
- 61.8% Retracement (Golden Ratio)
- 78.6% Retracement
- 100% (High of Day)
### 📈 Trading Applications
**Support & Resistance**
- Identify potential reversal zones
- Spot key support and resistance levels
- Plan entry and exit points
**Price Targets**
- Set realistic profit targets based on Fibonacci extensions
- Identify potential pullback levels in trending markets
**Risk Management**
- Place stop losses at strategic Fibonacci levels
- Calculate risk-to-reward ratios using multiple levels
**Golden Zone Strategy**
- Focus on the 50%-61.8% zone for high-probability trade setups
- The golden ratio area often acts as a strong confluence zone
### 🔔 Built-in Alert System
Pre-configured alert conditions for critical price level crossings:
- 38.2% level cross
- 50% level cross (equilibrium)
- 61.8% level cross (golden ratio)
### 💡 Best Practices
**Optimal Usage**
- Works on all intraday timeframes (1min, 5min, 15min, 30min, 1hour)
- Most effective during active trading sessions
- Combine with volume analysis for confirmation
- Use alongside other technical indicators for confluence
**Chart Setup Tips**
- Adjust colors to ensure levels are visible against your chart background
- Use thicker lines on higher timeframes for better visibility
- Enable only the levels most relevant to your trading strategy
- Customize label colors to differentiate between key levels quickly
## Technical Specifications
**Performance Features**
- Maximum 500 lines supported for extensive historical analysis
- Maximum 500 labels for comprehensive price level identification
- Optimized calculations for minimal chart lag
- Real-time updates with every price tick
**Compatibility**
- Pine Script Version 6
- Compatible with all TradingView chart types
- Works across all markets (Stocks, Forex, Crypto, Futures, Options)
- Supports all timeframes from 1-minute to daily
## Installation & Setup
1. Copy the script code into TradingView Pine Editor
2. Click "Add to Chart" to apply the indicator
3. Access settings via the indicator's gear icon
4. Customize colors, labels, and visibility options to your preference
5. Save your configuration as a default template for future use
## Advanced Configuration
**For Clean Charts**
- Disable labels for a minimalist view
- Show only 50% and 61.8% levels for focused trading
- Use muted colors with higher transparency
**For Detailed Analysis**
- Enable all levels and labels
- Use high-contrast colors for each level
- Increase line width for emphasis
**For Specific Strategies**
- Mean reversion traders: Focus on 38.2%, 50%, 61.8%
- Breakout traders: Monitor 0% and 100% levels closely
- Scalpers: Use golden zone exclusively with tight stops
## Algorithm Intelligence
The indicator employs sophisticated algorithms to:
- Automatically calculate optimal reference points
- Adapt to changing market conditions
- Filter out noise and false signals
- Provide consistent, reliable level placement
This ensures that traders receive accurate, actionable Fibonacci levels without manual intervention or subjective placement decisions.
🎁 Free Trial Access
Interested in trying this indicator?
I'm offering a ONE MONTH FREE TRIAL to help you experience the power of dynamic Fibonacci levels in your trading.
To request your trial access:
Send me a Direct Message (DM) on TradingView
Include "Fib Trial Request" in your message
I'll respond with access instructions within 24 hours
This trial includes:
✅ Full access to all indicator features
✅ All customization options unlocked
✅ Priority support during trial period
✅ Setup assistance and configuration help
Don't miss this opportunity to enhance your intraday trading with professional-grade Fibonacci analysis!
📞 Author's Notes
For questions, feedback, or trial access requests, feel free to reach out via DM. I'm committed to helping traders succeed and continuously improving this tool based on user feedback.
Happy Trading!
---
**Disclaimer**: This indicator is a technical analysis tool. Past performance does not guarantee future results. Always use proper risk management and combine with other forms of analysis for trading decisions.

Fibonacci Golden Zone Auto-DrawDisclaimer: This script is for educational purposes only and does not constitute financial advice. Use at your own risk.
Fibonacci Golden Zone Auto Draw is a smart tool that automatically detects the most recent market swing and highlights the high probability reversal area known as the Golden Zone (0.618 to 0.65 retracement).
Key Features
Auto Detection : Instantly finds the active High Low or Low High swing leg using customizable pivot sensitivity.
Golden Zone Visualization : Draws a clean color coded box (green for bullish, red for bearish) exactly where price is likely to reverse.
Dynamic Updates : Adjusts in real time as new pivots form, so your chart always shows the latest relevant levels.
How to Use
Pivot Left Bars : Sets how many bars to the left of a candle must be lower for a high or higher for a low to register as a pivot. Larger values find more significant longer term swings.
Pivot Right Bars : Sets how many bars to the right must confirm the pivot. Lower values detect pivots faster but may be less stable, while higher values wait for stronger confirmation.
Perfect for traders who want to spot retracement entries without manually drawing Fibonacci tools on every setup.

WJ STS Session SniperA precision-built indicator designed to support the STS (Session Trading System) framework taught by Jay and customized by Willy.
This tool acts as a decision engine, risk module, and session filter, helping you execute session-based scalps with strict discipline and clean rules.
The STS Companion does not replace TV Blast — it enhances it.
This indicator helps you follow the strategy exactly as intended:
• Only trade key session opens
• Only take trades where multi-timeframe momentum aligns
• Only take trades where volume delta confirms direction
• Only take trades when the session is producing a clean impulse
• Use swing-based stop-loss logic
• Automatically calculate the correct micro contract size
• Only take setups when all conditions match your trading plan
⸻
🎯 The Core Principles Behind the Indicator
The STS strategy is built around a simple philosophy:
“Trade only when the market is moving with force, and avoid 99% of chop.”
This companion implements that philosophy with:
⸻
🕒 High-Volume Session Targeting
The indicator highlights and focuses on the first minutes of major global opens:
• Shanghai / Asia Open
• Frankfurt Open
• London Open
• New York (08:20 futures open)
Each session has a defined “trade window” (default 20 minutes) where institutional liquidity and momentum typically enter the market.
This is where the STS edge lives.
⸻
📊 Multi-Timeframe Sentiment Engine (MTF Bias)
The indicator monitors up to four custom timeframes simultaneously and categorizes momentum as:
• Strong Buy
• Strong Sell
• Buy
• Sell
• Mixed
When ALL selected timeframes agree, bars are highlighted for instant direction clarity:
• Blue bars = all bullish
• White bars = all bearish
⸻
🔥 Volume Delta Engine (Aggression Detection)
Tracks real-time buying/selling pressure using:
• Delta EMA
• Volume filters
• High-volume expansion events
High-volume spikes aligned with trend are marked:
• White dot = bullish high-volume impulse
• Gold dot = bearish high-volume impulse
This identifies when large players are stepping in.
⸻
⚡ Breakout-Based Impulse Filter (“Pseudo Blast”)
Uses a breakout and momentum model to identify:
• The first expansion move after a session open
• Directional commitment
• Low-risk, high-RR scalping opportunities
This is the core trigger that aligns with STS-style entries.
⸻
🧮 Structural Stop-Loss + Position Sizing
The indicator automatically calculates:
• Nearest 1-minute swing high/low
• Stop distance in ticks
• Micro contract size based on your dollar risk input
This ensures high consistency and discipline, perfect for:
• TopStep
• Apex
• FundedNext
• Any account with a daily loss limit or tight risk rules
Setup signals only print when risk, stop, and volatility conditions are all safe.
⸻
🟢 When a Valid Setup Appears
The indicator will show:
• A triangle (long/short candidate)
• A label with:
• Stop-loss in ticks
• Recommended micro contract size
This means the system has aligned:
1. Session window
2. MTF bias
3. Volume delta
4. Breakout impulse
5. Proper stop
6. Safe position size
Only then does the STS Companion mark a bar.
⸻
📌 How to Use This Indicator
1. Wait for a major session open
Focus especially on Shanghai, Frankfurt, London, and NY.
2. Check the MTF bias
Blue = all bullish
White = all bearish
Avoid mixed conditions.
3. Confirm volume delta
Look for white/gold high-volume dots aligned with direction.
4. Wait for an impulse breakout
A triangle marks the potential STS entry bar.
5. Use the provided micro size
Position sizing is based on swing stop + your risk per trade.
6. Execute your plan
The indicator supports discipline — it does not override your rules.
⸻
⭐ Designed For
• Gold futures traders (XAUUSD / GC / MGC)
• Session scalpers
• Prop firm traders
• Momentum + breakout scalpers
• Anyone wanting mechanical, rule-based setups
⸻
🔒 Important
This indicator does not auto-trade.
It does not duplicate TV Blast.
It provides a clean, rules-based system to support the STS session methodology with precision and consistency.

Lot Size Calculator - Gold🥇 Lot Size Calculator for Gold (XAU/USD)
Description:
A professional and accurate lot size calculator specifically designed for Gold (XAU/USD) trading. This indicator helps traders calculate the optimal position size based on account balance, risk percentage, and stop loss distance, ensuring proper risk management for every trade.
Key Features:
Accurate Gold Calculations - Properly accounts for Gold pip values ($10 per pip for standard 100oz lots)
Multi-Currency Support - Works with USD, EUR, and GBP account currencies
Flexible Contract Sizes - Supports Standard (100 oz), Mini (10 oz), and Micro (1 oz) lots
Customizable Decimal Places - Display lot sizes with 2-8 decimal precision (no rounding)
Clean Visual Design - Modern, professional info panel with gold-themed styling
Adjustable Display - Position panel anywhere on chart with customizable colors and sizes
Real-Time Calculations - Instantly updates as you adjust your risk parameters
How It Works:
The calculator uses the standard forex position sizing formula optimized for Gold:
Lot Size = Risk Amount / (Stop Loss in Pips × Pip Value Per Lot)
For Gold (XAU/USD):
Standard Lot (100 oz): 1 pip = $10
Mini Lot (10 oz): 1 pip = $1
Micro Lot (1 oz): 1 pip = $0.10
Settings:
Account Settings:
Account Balance: Your trading capital
Account Currency: USD, EUR, or GBP
Risk Percentage: How much to risk per trade (default: 2%)
Contract Size: 100 oz (Standard), 10 oz (Mini), or 1 oz (Micro)
Display Currency: Choose how to display risk amounts
Trade Settings:
Stop Loss: Your SL distance in pips
Display Settings:
Label Position: Top/Bottom, Left/Right, Middle Right
Label Size: Tiny to Huge
Decimal Places: 2-8 decimals
Custom Colors: Background, text, and accent colors
Perfect For:
Gold (XAU/USD) day traders and swing traders
Position sizing and risk management
Traders using fixed percentage risk models
Anyone trading Gold CFDs or spot markets
Scalpers to long-term Gold investors
What Makes This Different:
Unlike generic lot size calculators, this tool correctly calculates Gold's pip values based on contract size. Many calculators get this wrong, leading to incorrect position sizing. This indicator ensures you're always trading the right lot size for your risk tolerance.
Example Usage:
Account Balance: $10,000
Risk: 1% = $100
Stop Loss: 60 pips
Contract Size: 100 oz (Standard)
Result: 0.1667 lots (exact, no rounding)
Perfect for maintaining consistent risk management in your Gold trading strategy!

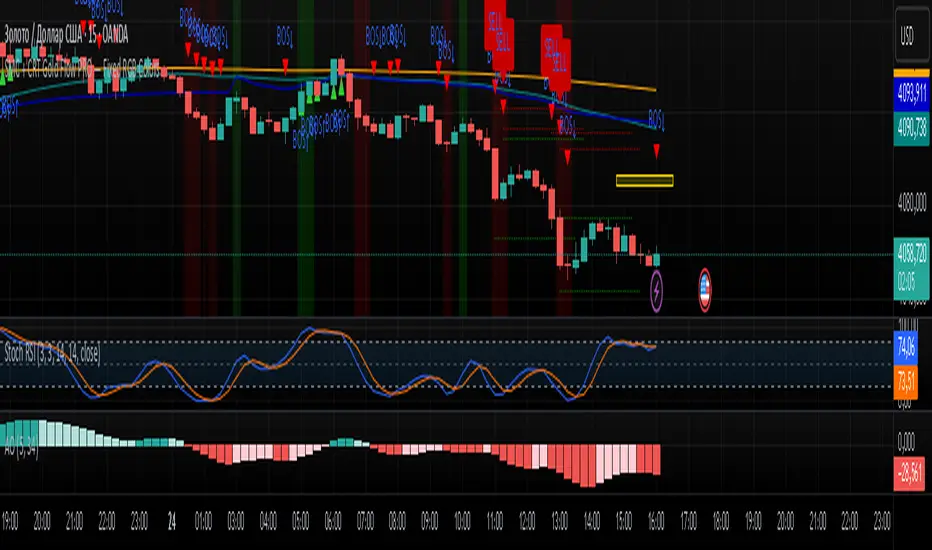
SMC + CRT Gold Flow PRO — Fixed RGB ColorsSCRIPT FOR GOLD. I used SMC + CRT strategies. I analyze in H4 timeframe and enter in m15 time frame.
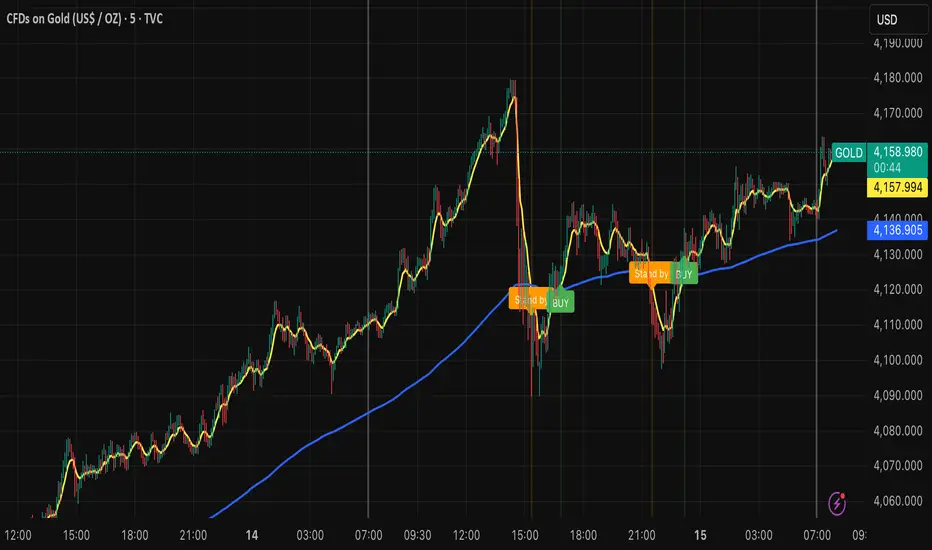
Billionaire Gold ClubBillionaire Gold Club — Long-Term Gold Trend Follower
Overview
The Billionaire Gold Club indicator is designed for traders who follow the long-term bullish bias of Gold (XAU/USD).
It focuses only on BUY opportunities and encourages patience during market pullbacks.
The goal is to trade with the main trend, not against it.
Instructions
1. The script automatically plots 7MA (fast) and 200MA (slow).
2. When 7MA crosses above 200MA, a BUY signal appears.
3. When 7MA crosses below 200MA, a Standby signal appears — do not sell, just wait for the next BUY.
Usage Rules
• Recommended timeframe: 15-minute or higher.
• If used below 15 minutes, treat it as day trading — close trades within the same day.
• Focus on long-term holding and small lot sizes to protect your capital.
Signal Guide
🟢 BUY → Enter the trend direction.
🟠 Standby → Pause new entries and wait patiently.
Alerts
Set alerts to "Once per bar close":
• BUY Signal → Golden Cross confirmed.
• Standby Signal → Death Cross confirmed.
Philosophy
"Obey the rules, and your probability of success increases."
This system rewards patience, discipline, and long-term trend following.
Follow me for more TradingView scripts and updates.
Billionaire Gold Clubは、ゴールド(XAU/USD)の長期上昇トレンドに沿って取引するためのインジケーターです。
基本的にBUYのみを狙い、デッドクロス時はStandby(待機)状態として次のBUYを待ちます。
推奨時間軸:15分足以上。
15分未満で使用する場合はデイトレードとして同日中にクローズすることを推奨します。
ロットを小さく保ち、長期保有で安定した運用を目指してください。
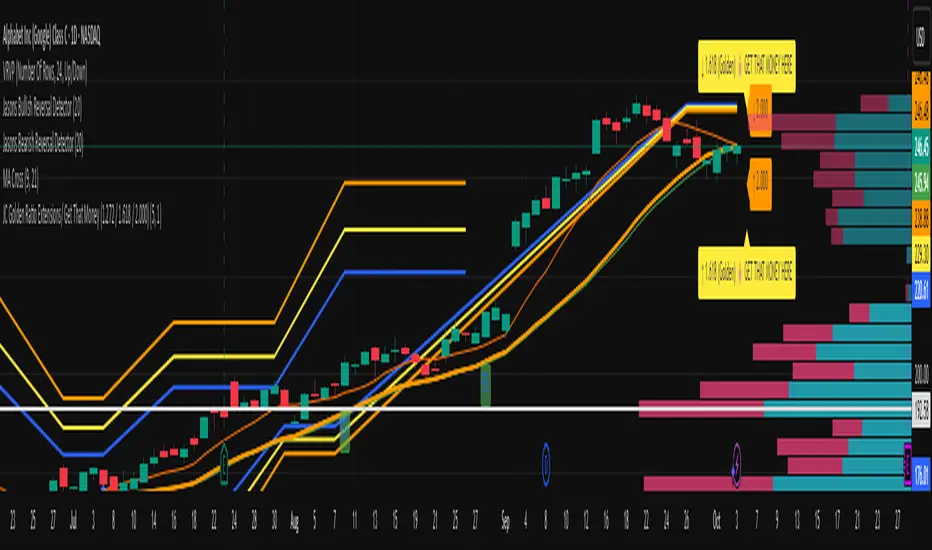
JC Golden Ratio GTM (1.272 / 1.618 / 2.000)This Pine Script automatically detects recent swing highs and lows, then projects golden ratio Fibonacci extensions (1.272, 1.618, and 2.000) above and below price to highlight potential profit targets or resistance zones. The blue, gold, and orange lines visualize each ratio, updating dynamically as new pivots form. Labels appear on the right edge of the chart showing each level — the golden 1.618 line even drops a playful “💰 GET THAT MONEY HERE” tag to mark the key Fibonacci extension often used as a target zone in technical trading.
Macias Golden ZoneThe Macias Golden Zone indicator automatically detects the most recent pivot leg and draws the key Fibonacci retracement band between 0.618 – 0.790, with the 0.706 midline highlighted.
🔑 Features:
• Auto-detects swing legs from pivot highs/lows
• Shaded Golden Zone for easy visualization of prime reaction areas
• Optional 0.706 midline for sniper entries
• Optional 0.079 retrace line for deeper confluence
• Works with wicks (High/Low) or closes
📈 Use it to identify high-probability pullback zones where price often reacts during trending moves.
⚠️ This tool is for educational purposes only. Not financial advice. Always manage risk.
From Christopher Macias and the Golden zone family

BayesCore Golden Bars BOVESPA Index-MiniIt is recommended to use this indicator for the Bovespa Index-Mini Futures.
This indicator uses golden candles and dots that appear directly on the chart to draw the trader’s attention to potential entry opportunities (buy/sell).
Usage:
When the lines are in an uptrend, if the second golden candle is above the lines and moving upward, there is a buying opportunity.
When the lines are in a downtrend, if the second golden candle is below the lines and moving downward, there is a selling opportunity.
In a sideways market, do not execute trades.
If you wish to trade in a sideways market, you can use the blue line as a guide: when the price is below the line, you buy; when it is above, you sell — this way, you can perform scalping.
These golden signals are designed to highlight candles that align more closely with the moving averages (blue and green lines), increasing the likelihood of capturing trades in line with the prevailing trend. By concentrating on these highlighted points, traders can more easily identify high-probability setups while avoiding unnecessary distractions.
The main purpose is to support longer trades on the Bovespa Index-Mini Futures, without adding new positions along the way. This approach helps traders maintain a safer and more consistent trading style.
Always confirm whether the golden signals converge with the overall market trend.

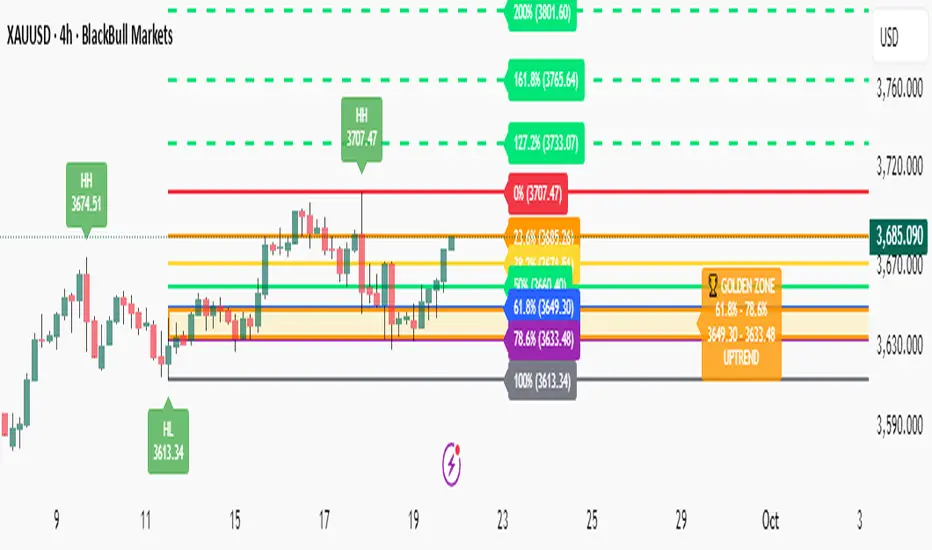
Fibonacci with Golden Zone - Trend Aware🎯 What This Indicator Does:
This advanced Fibonacci tool automatically detects trend direction and adapts Golden Zone calculations accordingly, providing dynamic support/resistance levels with market structure analysis.
✨ Key Features:
🔄 Trend-Aware Golden Zone: Automatically adjusts 61.8%-78.6% zone based on market direction
📈 Market Structure Labels: Shows HH, HL, LH, LL patterns with price levels
🎯 Smart Fibonacci Levels: Retracements (0%, 23.6%, 38.2%, 50%, 61.8%, 78.6%, 100%)
🚀 Extension Targets: 127.2%, 161.8%, 200%, 261.8% projections
📊 Pivot Points: Optional daily/weekly pivot levels
🔔 Smart Alerts: Golden Zone entry and extension target alerts
🧠 How It Works:
Uptrend: Golden Zone acts as support (retracement from swing high)
Downtrend: Golden Zone acts as resistance (retracement from swing low)
Auto-Detection: Uses trend MA to determine market direction
Structure Analysis: Identifies swing patterns for better entries
⚙️ Settings:
Lookback Period: Swing detection sensitivity (5-50)
Trend Period: Moving average for trend detection (20-200)
Golden Zone: Toggle 61.8%-78.6% zone display
Market Structure: Show HH/HL/LH/LL labels
Pivot Points: Optional daily pivot levels
📋 Best Use Cases:
🥇 Gold/Forex Trading: Perfect for XAUUSD analysis
📈 Swing Trading: Identify key reversal zones
🎯 Target Setting: Extension levels for profit taking
📊 Trend Following: Align trades with market direction
🎨 Visual Features:
🟡 Golden Zone Box: Highlighted support/resistance area
🏷️ Price Labels: Exact levels on all Fibonacci lines
🎨 Color Coding: Green for uptrend, Red for downtrend
📱 Clean Interface: Professional, non-cluttered design
🔔 Alert System:
🏆 Price entering Golden Zone
🎯 Approaching extension targets (127.2%, 161.8%)
📊 Includes trend direction in alerts
QTrade Golden, Bronze & Death, Bubonic Cross AlertsThis indicator highlights key EMA regime shifts with simple, color-coded triangles:
- Golden / Death Cross — 50 EMA crossing above/below the 200 EMA.
- Bronze / Bubonic Cross — 50 EMA crossing above/below the 100 EMA.
- Early-Warning Proxy — tiny triangles for the 4 EMA vs. 200 EMA (4↑200 and 4↓200). These often fire before the 50/100 and 50/200 crosses.
No text clutter on the chart—just triangles. Colors: gold (50↑200), red (50↓200), darker-yellow bronze (50↑100), burgundy (50↓100), turquoise (4↑200), purple (4↓200).
What it tells you (in order of warning → confirmation)
- First warning: 4 EMA crosses the 200 EMA (proxy for price shifting around the 200 line).
- Second warning: 50 EMA crosses the 100 EMA (Bronze/Bubonic).
- Confirmation: 50 EMA crosses the 200 EMA (Golden/Death).
Alerts included
- Golden Cross (50↑200) and Death Cross (50↓200)
- Bronze Cross (50↑100) and Bubonic Cross (50↓100)
- 4 EMA vs. 200 EMA crosses (up & down) — early-warning proxy
- Price–100 EMA events (touch/cross, if enabled in settings)

Trend ChannelThis Trend Channel is designed to simplify how traders view trends, while also keeping track of potential shifts in trends with signals. It is designed for traders that prefer less over more.
The indicator can be used for trend following, trend reversals and confirmation in combination with price or other indicators.
At the core is one EMA and a smoothed volatility based channel around it.
The purpose of the channel is to avoid false signals on trend reclaim or trend loss and instead identify trend deviations.
The indicator also incorporates long and short EMA cross-over signals to recognize possible shifts in trend without having to overlay multiple EMAs and keep the chart cleaner.
Additionally the indicator fires warnings for potential false signals on golden/death crosses with a letter "W" above/below the signal candle. Those warnings are based on the distance between price and the crossover. When the distance is above a certain threshold the indicator fires a warning that price might mean revert.
Traders can customize all inputs in the settings.

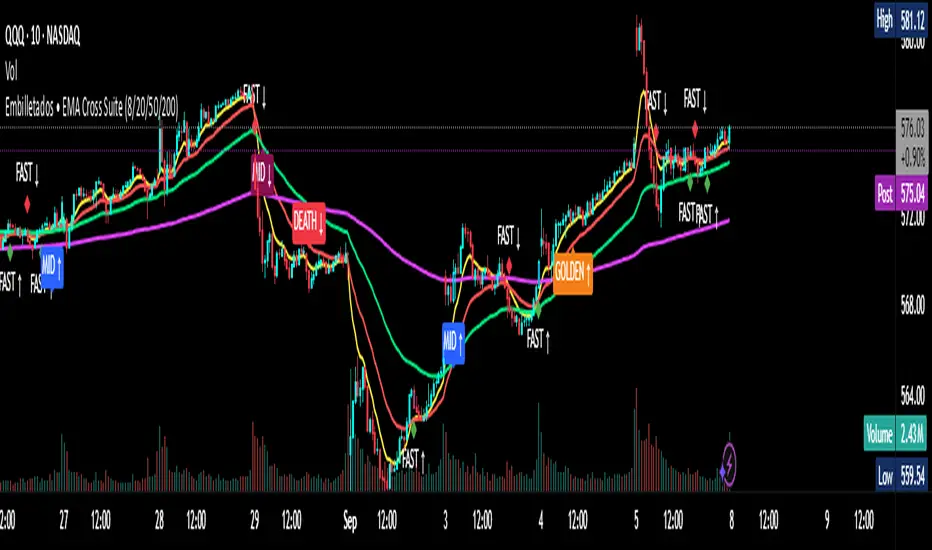
EMA Cross Suite (8/20/50/200) GOLDEN/DEATH by Carlos Chavez📜 Short Description (max 160 characters)
“Advanced EMA crossover system with FAST, MID, GOLDEN, and DEATH signals. Includes alerts, optimized visuals, and full customization.”
📄 Full Description (Paste in the box)
📌 Overview
The Embilletados • EMA Cross Suite is a professional trading indicator designed for intraday traders, scalpers, and swing traders.
It provides clear crossover signals using 4 EMAs combined with optimized visualization and built-in alerts to help you catch opportunities faster.
✨ Key Features:
🔹 4 configurable EMAs → 8, 20, 50, and 200.
🔹 Instant visual signals with colored labels:
FAST CROSS (8/20) → Quick momentum shifts.
MID CROSS (20/50) → Trend confirmation signals.
GOLDEN CROSS (50/200) → Strong bullish trend signals.
DEATH CROSS (50/200) → Strong bearish trend signals.
🔹 Built-in alerts → Get notified instantly for all crossover events.
🔹 Optimized visualization → Clean and easy-to-read interface.
🔹 Highly customizable → Enable/disable signals, labels, colors, and alerts according to your strategy.
📊 Recommended Timeframes:
10-minute charts → Best for intraday setups.
1-hour charts → Ideal for swing trading and trend confirmation.
🚀 How to Use:
Add the indicator to your chart.
Set up alerts for the desired crossovers: FAST, MID, GOLDEN, or DEATH.
Trade confidently using clear visual confirmations and real-time notifications.
🌟 Perfect for:
✅ Intraday traders
✅ Scalpers
✅ Swing traders
✅ Trend-following strategies
ORB with Golden Zone FIB targets, Any Timeframe by TenAMTraderDescription:
This indicator is designed to help traders identify key price levels using Fibonacci extensions and retracements based on the Opening Range Breakout (ORB). The levels are visualized as “Golden Zones”, which can serve as potential targets for trades.
Features:
Customizable ORB Timeframe: By default, the ORB is set from 9:30 AM to 9:45 AM EST, but any timeframe can be configured in the settings to fit your trading style.
Golden Zones as Targets: Fibonacci levels are intended to be used as potential profit-taking zones or areas to monitor for reversals, providing a structured framework for intraday and swing trading.
Adjustable Chart Settings: Color-coded levels make it easy to interpret at a glance, and all lines can be customized for personal preference.
Versatile Application: The indicator works across any timeframe, enabling traders to analyze both intraday and multi-day price action.
How to Use:
Ensure Regular Trading Hours (RTH) is enabled on your chart for accurate level calculation.
Observe price action near Golden Zones: a confirmed breakout may indicate continuation, while a pullback could signal a reversal opportunity.
Use the Golden Zones as reference targets for managing risk and planning exits.
Adjust the ORB timeframe and display settings to match your preferred trading style.
Legal Disclosure:
This indicator is provided for educational purposes only and is not financial advice. Trading carries a substantial risk of loss. Users should always perform their own analysis and consult a licensed financial professional before making any trading decisions. Past performance is not indicative of future results.

Wolf of crypto MA Cross & Price Cross this indicator by Wolf of crypto is helping you spot the price action crossing the 200MA or the 50MA crossing the 200MA (Golden cross or Death cross)

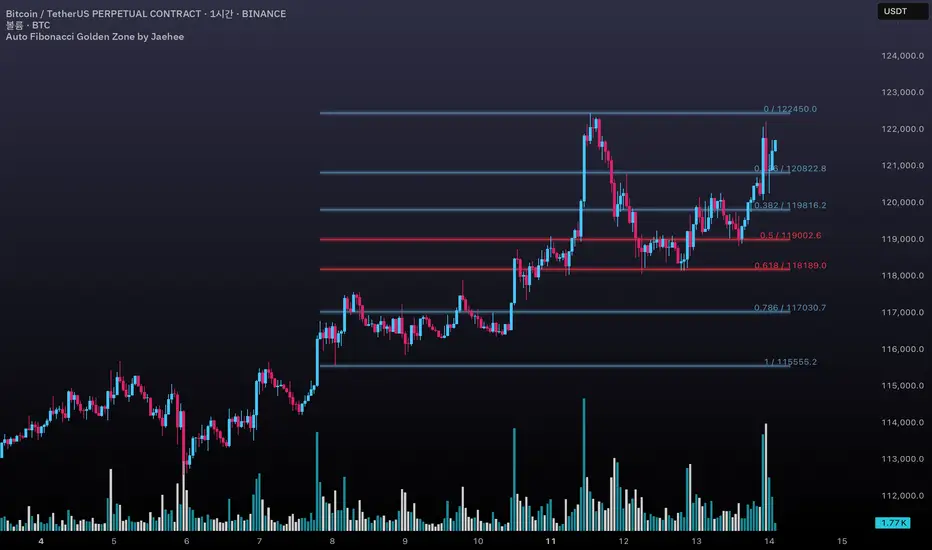
Auto Fibonacci Golden Zone by Jaehee📌 AUTO FIBONACCI GOLDEN ZONE — Auto Swing Detection with Key Level Highlights
WHAT THIS DOES
• Automatically detects the latest swing high and swing low within your chosen lookback range.
• Plots Fibonacci retracement levels: 1.000, 0.786, 0.618, 0.500, 0.382, 0.236, 0.000.
• Highlights 0.618 (“golden pocket”) and 0.500 as high-interest zones.
• Displays ratio + price labels to the right for quick reference without moving the cursor.
HOW IT WORKS
• Scans the last N bars (default 150) to locate the highest high and lowest low.
• Determines swing direction automatically: if the low forms first → up-leg, if the high forms first → down-leg.
• Calculates retracement prices and plots each level with a thin core line plus two glow layers (opacity adjustable).
• Clears and redraws lines and labels whenever a new swing is found — keeping the chart clean.
WHY THIS SETUP
• Saves time compared to manually anchoring Fib tools for each new swing.
• Highlights the golden pocket (0.618) and midpoint (0.500) — zones many traders watch for pullbacks or reactions.
• Positions labels to the right so they never overlap active candles.
HOW IT’S DIFFERENT FROM THE STANDARD FIB TOOL
• Automatic swing detection — no manual point selection.
• Built-in highlight logic for key levels.
• Clean redraw to prevent leftover lines or labels.
• Right-side label offset for readability in volatile price zones.
HOW TO READ IT (CONTEXT ONLY)
• In an up-leg, the 0.382–0.618 zone is often monitored for pullback reactions; 0.500 can act as a midpoint marker.
• In a down-leg, retracements into the 0.382–0.618 zone can be watched for selling pressure.
• Always confirm with structure, volume, and momentum tools — this indicator is not a standalone trade signal.
INPUTS
• Lookback Bars — swing detection range.
• Fib Line Color / Highlight Line Color — control standard vs. key level colors.
• Label Offset Bars — shift labels away from current price.
• Glow 1 & Glow 2 Opacity — adjust background glow visibility.
DESIGN NOTES
• Thin lines for precision, glow layers for visibility without overpowering candles.
• Overlay display — no extra panel needed.
• All elements clear and redraw automatically to avoid clutter.
LIMITATIONS & BEST PRACTICES
• Levels update whenever a new swing forms within the lookback range — historical lines are not fixed.
• Fib retracements are reference zones only, not guarantees of reversal.
• Best used with confluence factors like S/R flips, market structure, and volume analysis.
• No alerts, no performance claims — purely a market context tool.
DEFAULTS & SCOPE
• Works on all OHLCV instruments and timeframes.
• No repainting after swing confirmation.
AUTHOR’S NOTE FOR REVIEW
This is not a repackaged Fib tool. It combines automatic swing detection, golden pocket highlighting, and a clean redraw process to make retracement analysis faster and clearer. It provides context only, with no predictive or performance claims.
Multi SMA + Golden/Death + Heatmap + BB**Multi SMA (50/100/200) + Golden/Death + Candle Heatmap + BB**
A practical trend toolkit that blends classic 50/100/200 SMAs with clear crossover labels, special 🚀 Golden / 💀 Death Cross markers, and a readable candle heatmap based on a dynamic regression midline and volatility bands. Optional Bollinger Bands are included for context.
* See trend direction at a glance with SMAs.
* Get minimal, de-cluttered labels on important crosses (50↔100, 50↔200, 100↔200).
* Highlight big regime shifts with special Golden/Death tags.
* Read momentum and volatility with the candle heatmap.
* Add Bollinger Bands if you want classic mean-reversion context.
Designed to be lightweight, non-repainting on confirmed bars, and flexible across timeframes.
# What This Indicator Does (plain English)
* **Tracks trend** using **SMA 50/100/200** and lets you optionally compute each SMA on a higher or different timeframe (HTF-safe, no lookahead).
* **Prints labels** when SMAs cross each other (up or down). You can force signals only after bar close to avoid repaint.
* **Marks Golden/Death Crosses** (50 over/under 200) with special labels so major regime changes stand out.
* **Colors candles** with a **heatmap** built from a regression midline and volatility bands—greenish above, reddish below, with a smooth gradient.
* **Optionally shows Bollinger Bands** (basis SMA + stdev bands) and fills the area between them.
* **Includes alert conditions** for Golden and Death Cross so you can automate notifications.
---
# Settings — Simple Explanations
## Source
* **Source**: Price source used to calculate SMAs and Bollinger basis. Default: `close`.
## SMA 50
* **Show 50**: Turn the SMA(50) line on/off.
* **Length 50**: How many bars to average. Lower = faster but noisier.
* **Color 50** / **Width 50**: Visual style.
* **Timeframe 50**: Optional alternate timeframe for SMA(50). Leave empty to use the chart timeframe.
## SMA 100
* **Show 100**: Turn the SMA(100) line on/off.
* **Length 100**: Bars used for the mid-term trend.
* **Color 100** / **Width 100**: Visual style.
* **Timeframe 100**: Optional alternate timeframe for SMA(100).
## SMA 200
* **Show 200**: Turn the SMA(200) line on/off.
* **Length 200**: Bars used for the long-term trend.
* **Color 200** / **Width 200**: Visual style.
* **Timeframe 200**: Optional alternate timeframe for SMA(200).
## Signals (crossover labels)
* **Show crossover signals**: Prints triangle labels on SMA crosses (50↔100, 50↔200, 100↔200).
* **Wait for bar close (confirmed)**: If ON, signals only appear after the candle closes (reduces repaint).
* **Min bars between same-pair signals**: Minimum spacing to avoid duplicate labels from the same SMA pair too often.
* **Trend filter (buy: 50>100>200, sell: 50<100<200)**: Only show bullish labels when SMAs are stacked bullish (50 above 100 above 200), and only show bearish labels when stacked bearish.
### Label Offset
* **Offset mode**: Choose how to push labels away from price:
* **Percent**: Offset is a % of price.
* **ATR x**: Offset is ATR(14) × multiplier.
* **Percent of price (%)**: Used when mode = Percent.
* **ATR multiplier (for ‘ATR x’)**: Used when mode = ATR x.
### Label Colors
* **Bull color** / **Bear color**: Background of triangle labels.
* **Bull label text color** / **Bear label text color**: Text color inside the triangles.
## Golden / Death Cross
* **Show 🚀 Golden Cross (50↑200)**: Show a special “Golden” label when SMA50 crosses above SMA200.
* **Golden label color** / **Golden text color**: Styling for Golden label.
* **Show 💀 Death Cross (50↓200)**: Show a special “Death” label when SMA50 crosses below SMA200.
* **Death label color** / **Death text color**: Styling for Death label.
## Candle Heatmap
* **Enable heatmap candle colors**: Turns the heatmap on/off.
* **Length**: Lookback for the regression midline and volatility measure.
* **Deviation Multiplier**: Band width around the midline (bigger = wider).
* **Volatility basis**:
* **RMA Range** (smoothed high-low range)
* **Stdev** (standard deviation of close)
* **Upper/Middle/Lower color**: Gradient colors for the heatmap.
* **Heatmap transparency (0..100)**: 0 = solid, 100 = invisible.
* **Force override base candles**: Repaint base candles so heatmap stays visible even if your chart has custom coloring.
## Bollinger Bands (optional)
* **Show Bollinger Bands**: Toggle the overlay on/off.
* **Length**: Basis SMA length.
* **StdDev Multiplier**: Distance of bands from the basis in standard deviations.
* **Basis color** / **Band color**: Line colors for basis and bands.
* **Bands fill transparency**: Opacity of the fill between upper/lower bands.
---
# Features & How It Works
## 1) HTF-Safe SMAs
Each SMA can be calculated on the chart timeframe or a higher/different timeframe you choose. The script pulls HTF values **without lookahead** (non-repainting on confirmed bars).
## 2) Crossover Labels (Three Pairs)
* **50↔100**, **50↔200**, **100↔200**:
* **Triangle Up** label when the first SMA crosses **above** the second.
* **Triangle Down** label when it crosses **below**.
* Optional **Trend Filter** ensures only signals aligned with the overall stack (50>100>200 for bullish, 50<100<200 for bearish).
* **Debounce** spacing avoids repeated labels for the same pair too close together.
## 3) Golden / Death Cross Highlights
* **🚀 Golden Cross**: SMA50 crosses **above** SMA200 (often a longer-term bullish regime shift).
* **💀 Death Cross**: SMA50 crosses **below** SMA200 (often a longer-term bearish regime shift).
* Separate styling so they stand out from regular cross labels.
## 4) Candle Heatmap
* Builds a **regression midline** with **volatility bands**; colors candles by their position inside that channel.
* Smooth gradient: lower side → reddish, mid → yellowish, upper side → greenish.
* Helps you see momentum and “where price sits” relative to a dynamic channel.
## 5) Bollinger Bands (Optional)
* Classic **basis SMA** ± **StdDev** bands.
* Light visual context for mean-reversion and volatility expansion.
## 6) Alerts
* **Golden Cross**: `🚀 GOLDEN CROSS: SMA 50 crossed ABOVE SMA 200`
* **Death Cross**: `💀 DEATH CROSS: SMA 50 crossed BELOW SMA 200`
Add these to your alerts to get notified automatically.
---
# Tips & Notes
* For fewer false positives, keep **“Wait for bar close”** ON, especially on lower timeframes.
* Use the **Trend Filter** to align signals with the broader stack and cut noise.
* For HTF context, set **Timeframe 50/100/200** to higher frames (e.g., H1/H4/D) while you trade on a lower frame.
* Heatmap “Length” and “Deviation Multiplier” control smoothness and channel width—tune for your asset’s volatility.

The Golden TriggerThe Golden Trigger - XAUUSD
Unlock your trading potential with The Golden Trigger, a powerful technical analysis strategy designed for XAUUSD. This custom indicator combines the synergy of moving averages and the MACD to provide clear buy and sell signals, optimizing your trading decisions.
Key Features:
SMA Crossovers: Utilizes the 2-period and 7-period Simple Moving Averages (SMAs) to spot short-term price momentum shifts, triggering buy or sell signals.
MACD Confirmation: The strategy only acts when the MACD aligns with the price action, ensuring you’re trading with the market's momentum.
Long-Term Trend Filter: The 200-period SMA ensures that your trades align with the overall market trend, helping you avoid counter-trend moves.
Real-Time Alerts: Get notified when it's time to act with the built-in alert conditions for both Buy and Sell signals.
Customizable and User-Friendly: Tailor the strategy to your preferences and trade with confidence.
This indicator is perfect for traders looking to catch short-term trends in gold (XAUUSD), with clear visual buy and sell markers that appear directly on the chart.
Why You Need This Indicator:
Stay ahead of the market with real-time signals
Filter trades to match the prevailing market trend
Enhance your trading strategy with a clear, simple-to-follow system
Unlock the power of The Golden Trigger today and make smarter, more confident trades!
