Moving Average 50/200 Golden Cross or Dead CrossA strategy is to apply two moving averages to a chart, one longer and one shorter. When the shorter MA 50 day scrosses above the longer term MA 200 days it's a buy signal as it indicates the trend is shifting up.This is known as a "golden cross."
When the shorter MA crosses below the longer term MA it's a sell signal as it indicates the trend is shifting down. This is known as a "dead/death cross"
For cryptocurrencies use 4 hour charts.
Cari dalam skrip untuk "GOLD"

Aurum DCX AVE Gold and Silver StrategySummary in one paragraph
Aurum DCX AVE is a volatility break strategy for gold and silver on intraday and swing timeframes. It aligns a new Directional Convexity Index with an Adaptive Volatility Envelope and an optional USD/DXY bias so trades appear only when direction quality and expansion agree. It is original because it fuses three pieces rarely combined in one model for metals: a convexity aware trend strength score, a percentile based envelope that widens with regime heat, and an intermarket DXY filter.
Scope and intent
• Markets. Gold and silver futures or spot, other liquid commodities, major indices
• Timeframes. Five minutes to one day. Defaults to 30min for swing pace
• Default demo used in this publication. TVC:GOLD on 30m
• Purpose. Enter confirmed volatility breaks while muting chop using regime heat and USD bias
• Limits. This is a strategy. Orders are simulated on standard candles only
Originality and usefulness
• Unique fusion. DCX combines DI strength with path efficiency and curvature. AVE blends ATR with a high TR percentile and widens with DCX heat. DXY adds an intermarket bias
• Failure mode addressed. False starts inside compression and unconfirmed breakouts during USD swings
• Testability. Each component has a named input. Entry names L and S are visible in the list of trades
• Portable yardstick. Weekly ATR for stops and R multiples for targets
• Open source. Method and implementation are disclosed for community review
Method overview in plain language
You score direction quality with DCX, size an adaptive envelope with a blend of ATR and a high TR percentile, and only allow breaks that clear the band while DCX is above a heat threshold in the same direction. An optional DXY filter favors long when USD weakens and short when USD strengthens. Orders are bracketed with a Weekly ATR stop and an R multiple target, with optional trailing to the envelope.
Base measures
• Range basis. True Range and ATR over user windows. A high TR percentile captures expansion tails used by AVE
• Return basis. Not required
Components
• Directional Convexity Index DCX. Measures directional strength with DX, multiplies by path efficiency, blends a curvature term from acceleration, scales to 0 to 100, and uses a rise window
• Adaptive Volatility Envelope AVE. Midline ALMA or HMA or EMA plus bands sized by a blend of ATR and a high TR percentile. The blend weight follows volatility of volatility. Band width widens with DCX heat
• DXY Bias optional. Daily EMA trend of DXY. Long bias when USD weakens. Short bias when USD strengthens
• Risk block. Initial stop equals Weekly ATR times a multiplier. Target equals an R multiple of the initial risk. Optional trailing to AVE band
Fusion rule
• All gates must pass. DCX above threshold and rising. Directional lead agrees. Price breaks the AVE band in the same direction. DXY bias agrees when enabled
Signal rule
• Long. Close above AVE upper and DCX above threshold and DCX rising and plus DI leads and DXY bias is bearish
• Short. Close below AVE lower and DCX above threshold and DCX falling and minus DI leads and DXY bias is bullish
• Exit and flip. Bracket exit at stop or target. Optional trailing to AVE band
Inputs with guidance
Setup
• Symbol. Default TVC:GOLD (Correlation Asset for internal logic)
• Signal timeframe. Blank follows the chart
• Confirm timeframe. Default 1 day used by the bias block
Directional Convexity Index
• DCX window. Typical 10 to 21. Higher filters more. Lower reacts earlier
• DCX rise bars. Typical 3 to 6. Higher demands continuation
• DCX entry threshold. Typical 15 to 35. Higher avoids soft moves
• Efficiency floor. Typical 0.02 to 0.06. Stability in quiet tape
• Convexity weight 0..1. Typical 0.25 to 0.50. Higher gives curvature more influence
Adaptive Volatility Envelope
• AVE window. Typical 24 to 48. Higher smooths more
• Midline type. ALMA or HMA or EMA per preference
• TR percentile 0..100. Typical 75 to 90. Higher favors only strong expansions
• Vol of vol reference. Typical 0.05 to 0.30. Controls how much the percentile term weighs against ATR
• Base envelope mult. Typical 1.4 to 2.2. Width of bands
• Regime adapt 0..1. Typical 0.6 to 0.95. How much DCX heat widens or narrows the bands
Intermarket Bias
• Use DXY bias. Default ON
• DXY timeframe. Default 1 day
• DXY trend window. Typical 10 to 50
Risk
• Risk percent per trade. Reporting field. Keep live risk near one to two percent
• Weekly ATR. Default 14. Basis for stops
• Stop ATR weekly mult. Typical 1.5 to 3.0
• Take profit R multiple. Typical 1.5 to 3.0
• Trail with AVE band. Optional. OFF by default
Properties visible in this publication
• Initial capital. 20000
• Base currency. USD
• request.security lookahead off everywhere
• Commission. 0.03 percent
• Slippage. 5 ticks
• Default order size method percent of equity with value 3% of the total capital available
• Pyramiding 0
• Process orders on close ON
• Bar magnifier ON
• Recalculate after order is filled OFF
• Calc on every tick OFF
Realism and responsible publication
• No performance claims. Past results never guarantee future outcomes
• Shapes can move while a bar forms and settle on close
• Strategies use standard candles for signals and orders only
Honest limitations and failure modes
• Economic releases and thin liquidity can break assumptions behind the expansion logic
• Gap heavy symbols may prefer a longer ATR window
• Very quiet regimes can reduce signal contrast. Consider higher DCX thresholds or wider bands
• Session time follows the exchange of the chart and can change symbol to symbol
• Symbol sensitivity is expected. Use the gates and length inputs to find stable settings
Open source reuse and credits
• None
Mode
Public open source. Source is visible and free to reuse within TradingView House Rules
Legal
Education and research only. Not investment advice. You are responsible for your decisions. Test on historical data and in simulation before any live use. Use realistic costs.

Bitcoin vs. Gold correlation with lagBTC vs Gold (Lag) + Correlation — multi-timeframe, publication notes
What it does
Plots Gold on the same chart as Bitcoin, with a configurable lead/lag.
Lets you choose how the series is displayed:
Gold shifted forward (+lag on chart) — shows gold ahead of BTC on the time axis (visual offset).
Gold aligned to BTC (gold lag) — standard alignment; gold is lagged for calculation and plotted in place.
BTC 200D Lag (BTC shifted forward) — visualizes BTC shifted forward (like popular “BTC 200D Lag” charts).
Computes Pearson correlations between BTC (no lag) and Gold (with lag) over multiple lookback windows equivalent to:
30d, 60d, 90d, 180d, 365d, 2y (730d), 3y (1095d), 5y (1825d).
Shows a table with the correlation values, automatically scaled to the current timeframe.
Why this is useful
A common macro claim is that BTC tends to follow Gold with a delay (e.g., ~200 trading days). This tool lets you:
Visually advance Gold (or BTC) to see that lead-lag relationship on the chart.
Quantify the relationship with rolling correlations.
Switch timeframes (D/W/M/…): everything automatically stays in sync.
Quick start
Open a BTC chart (any exchange).
Add the indicator.
Set Gold symbol (default TVC:GOLD; alternatives: OANDA:XAUUSD, COMEX:GC1!, etc.).
Choose Lag value and Lag unit (Days/Weeks/Months/Years/Bars).
Pick Visual Mode:
To mirror those “BTC 200D Lag” posts: choose “BTC 200D Lag (BTC shifted forward)” with 200 Days.
To view Gold 200D ahead of BTC: select “Gold shifted forward (+lag on chart)” with 200 Days.
Keep Rebase to 100 ON for an apples-to-apples visual scale. (You can move the study to the left price scale if needed.)
Inputs
Gold symbol: external series to pair with BTC.
Lag value: numeric value.
Lag unit: Days, Weeks, Months (≈30d), Years (≈365d), or direct Bars.
Visual mode:
Gold shifted forward (+lag on chart) → gold is offset to the right by the lag (visual only).
Gold aligned to BTC (gold lag) → standard plot (no visual offset); correlations still use lagged gold.
BTC 200D Lag (BTC shifted forward) → BTC is offset to the right by the lag (visual only).
Rebase to 100 (visual): rescales each series to 100 on its first valid bar for clearer comparison.
Show gold without lag (debug): optional reference line.
Show price tag for gold (lag): toggles the track price label.
Timeframe handling
The study uses the current chart timeframe for both BTC and Gold (timeframe.period).
Lag in time units (Days/Weeks/Months/Years) is internally converted to an integer number of bars of the active timeframe (using timeframe.in_seconds).
Example: on W (weekly), 200 days ≈ 29 bars.
On intraday timeframes, days are converted proportionally.
Correlation math
Correlation = ta.correlation(BTC, Gold_lagged, length_in_bars)
Lookback lengths are the bar-equivalents of 30/60/90/180/365/730/1095/1825 days in the active timeframe.
Important: correlations are computed on prices (not returns). If you prefer returns-based correlation (often more statistically robust), duplicate the script and replace price inputs with change(close) or ta.roc(close, 1).
Reading the table
Window: nominal day label (e.g., 30d, 1y, 5y).
Bars (TF): how many bars that window equals on the current timeframe.
Correlation: Pearson coefficient . Background tint shows intensity and sign.
Tips & caveats
Visual offsets (offset=) move series on screen only; they don’t affect the math. The math always uses BTC (no lag) × Gold (lagged).
With large lags on high timeframes, early bars will be na (normal). Scroll forward / reduce lag.
If your Gold feed doesn’t load, try an alternative symbol that your plan supports.
Rebase to 100 helps visibility when BTC ($100k) and Gold ($2k) share a scale.
Months/Years use 30/365-day approximations. For exact control, use Days or Bars.
Correlations on very short lengths or sparse data can be unstable; consider the longer windows for sturdier signals.
This is a visual/analytical tool, not a trading signal. Always apply independent risk management.
Suggested setups
Replicate “BTC 200D Lag” charts:
Visual Mode: BTC 200D Lag (BTC shifted forward)
Lag: 200 Days
Rebase: ON
Gold leads BTC (Gold ahead):
Visual Mode: Gold shifted forward (+lag on chart)
Lag: 200 Days
Rebase: ON
Compatibility: Pine v6, overlay study.
Best with: BTCUSD (any exchange) + a reliable Gold feed.
Author’s note: Lead-lag relationships are not stable over time; treat correlations as descriptive, not predictive.

Golden Cross + Support/Resistance + SL/TP + SignalsGolden Cross + Support/Resistance + SL/TP + Signals
Golden Cross + Support/Resistance + SL/TP + Signals

PowerTrend Pro Strategy – Gold OptimizedTired of false signals on Gold?
PowerTrend Pro combines VWAP, Supertrend, RSI, and smart MA filters with trailing stops & break-even logic to deliver high-probability trades on XAUUSD.
PowerTrend Pro Strategy is a professional-grade trading system designed to capture high-probability swing and intraday opportunities on XAUUSD (Gold) and other volatile markets.
🔑 Core Features
VWAP Anchoring – institutional fair value reference to filter trades.
Supertrend (ATR-based) – adaptive trend filter tuned for Gold’s volatility.
Multi-Timeframe RSI – confirms momentum alignment across intraday and higher timeframe.
EMA + SMA Combo – ensures trades follow strong directional bias, reducing false signals.
Dynamic Risk Management
Adjustable Take Profit / Stop Loss (%)
Trailing Stop that locks in profits on extended moves
Break-Even Logic (stop loss moves to entry once price is in profit)
⚡ Gold-Tuned Presets
XAUUSD 1H → tighter TP/SL & faster entries for active intraday trading.
XAUUSD 4H → wider ATR filter & trailing stops to capture bigger swings.
Generic Mode → works on Forex, Indices, and Crypto (fully customizable).
🎯 Why It Works
Gold is notoriously volatile — quick spikes wipe out weak strategies. PowerTrend Pro solves this by combining:
✅ Institutional bias (VWAP)
✅ Adaptive trend filter (Supertrend)
✅ Momentum confirmation (RSI MTF)
✅ Robust trend structure (EMA + SMA)
✅ Smart exits (TP, SL, trailing & breakeven)
This multi-layer confirmation makes entries stronger and keeps risk under control.
🛠️ Usage
Add the strategy to your chart.
Choose a preset (XAUUSD 1H, 4H, or Generic).
Run Strategy Tester for performance metrics.
Optimize TP/SL and ATR values for your broker & market conditions.
🔥 Pro Tip: Combine this strategy with a session filter (London/NY overlap) or volume confirmation to boost accuracy in Gold.

CANX Gold (XAUUSD) $5 Psychological Levels© CanxStixTrader
FOR GOLD ONLY
--------------------------------
This is a vary simple yet powerful indicator based on the psychological levels that retail traders use to trade gold and institutions in turn target these levels.
--------------------------------
HOW TO USE
Once the trend has been determined then this simple indicator can be used to target the pull backs for the sniper entries you want.
-TIP, pair with other indicators for optimal entries and trend identification. We recommend the 1 minute time frame for entries and a momentum indicator for extra confirmation.
--------------------------------
The indicator draws lines every 50 pips or $5 on the chart and is customizable to your preference.
Like always, Keep it simple!
© CanxStixTrader

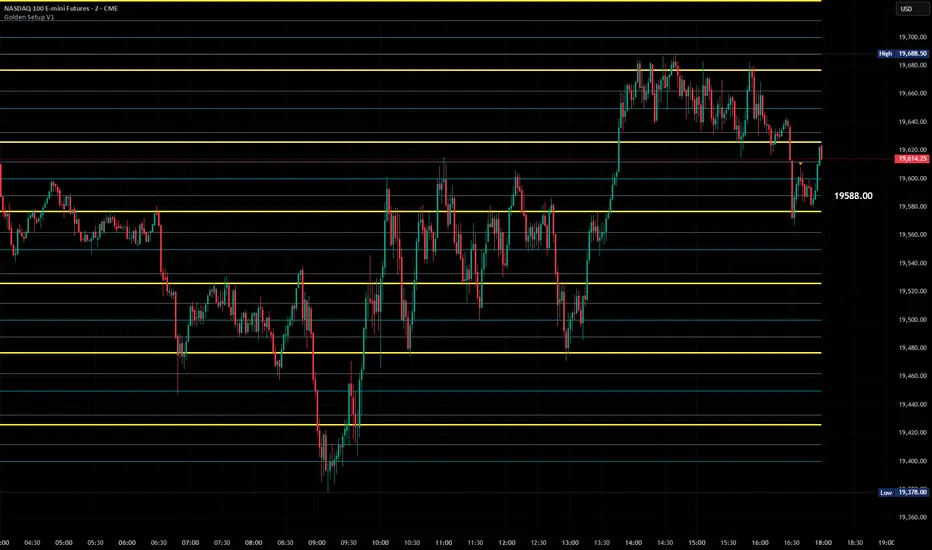
Golden Setup V1Golden Setup V1 is an overlay indicator that automates Tony Rago’s “Golden Setup” price-level framework. It divides the chart into fixed “blockSize” intervals (default 100 points) and plots a series of key horizontal levels within each block—levels at 00, 12, 26, 33, 50, 62, 77 and 88 offsets. These levels act as dynamic support and resistance grids that roll up or down as price moves between blocks.
Key Features
Customizable Offsets
Define eight offset levels corresponding to Rago’s Golden Setup:
00 (Round Number)
12 (Target 12)
26 (First “Golden” level)
33 (Target 33)
50 (Mid-block pivot)
62 (Target 62)
77 (Second “Golden” level)
88 (Target 88)
Multi-Block Coverage
Choose how many blocks above and below the current 100-point block you wish to display, so you always have levels drawn for the surrounding price range.
Golden-Only Filter
A handy toggle lets you show only the two “Golden” offsets (26 & 77), which many traders prioritize for high-probability bounce or breakout areas.
Dynamic Nearest-Level Label
Highlights the closest Golden Setup level (to the right edge of the chart) with a movable label, so you always know which level price is approaching.
Full Styling Control
Customize line colors, widths, block size, label fonts and opacity to suit your charting style.
How It Works
Block Calculation
On each bar, the indicator computes the “current block” by flooring (close / blockSize) and multiplying back by blockSize.
Level Offsets
It adds each of the eight user-defined offsets to that block base (and, if price has moved below the lowest offset, shifts the block down one interval).
Drawing
Each level is drawn as a horizontal line extending across the chart for as many blocks above/below as you select.
Nearest-Level Detection
Within the present block, it calculates which of the plotted levels is closest to price and displays that value on the right edge.
Usage Tips
Use the Golden-Only filter to declutter and focus solely on the 26 & 77 levels, which often act as strong intra-block pivot points.
Combine with volume or momentum indicators to confirm bounces at these levels.
Adjust blockSize (e.g. 50 or 200) if you wish to work in smaller or larger price increments.
⚠️ Disclaimer: This script is for educational and illustrative purposes only. Trading involves risk—always back-test and validate any strategy on a demo account before going live.
Precision Trading Strategy: Golden EdgeThe PTS: Golden Edge strategy is designed for scalping Gold (XAU/USD) on lower timeframes, such as the 1-minute chart. It captures high-probability trade setups by aligning with strong trends and momentum, while filtering out low-quality trades during consolidation or low-volatility periods.
The strategy uses a combination of technical indicators to identify optimal entry points:
1. Exponential Moving Averages (EMAs): A fast EMA (3-period) and a slow EMA (33-period) are used to detect short-term trend reversals via crossover signals.
2. Hull Moving Average (HMA): A 66-period HMA acts as a higher-timeframe trend filter to ensure trades align with the overall market direction.
3. Relative Strength Index (RSI): A 12-period RSI identifies momentum. The strategy requires RSI > 55 for long trades and RSI < 45 for short trades, ensuring entries are backed by strong buying or selling pressure.
4. Average True Range (ATR): A 14-period ATR ensures trades occur only during volatile conditions, avoiding choppy or low-movement markets.
By combining these tools, the PTS: Golden Edge strategy creates a precise framework for scalping and offers a systematic approach to capitalize on Gold’s price movements efficiently.

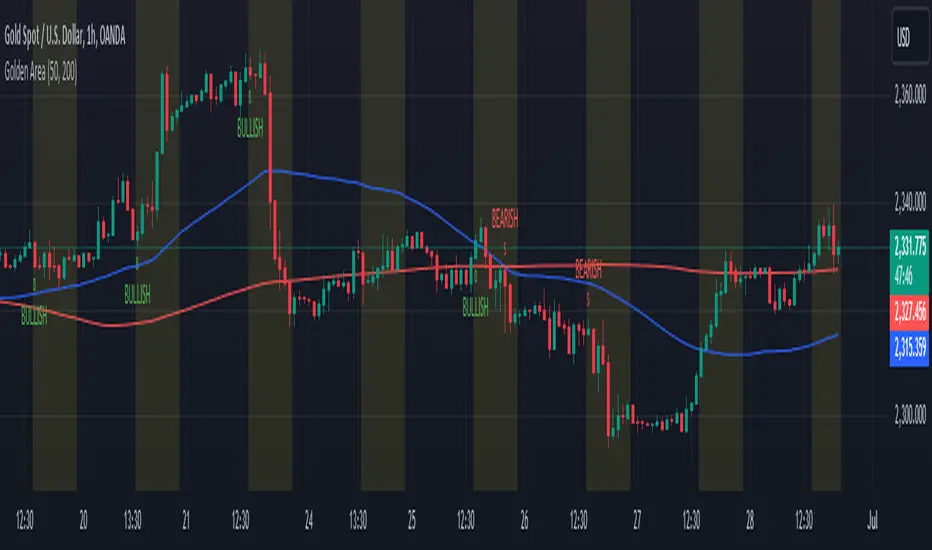
Golden Area### Golden Area Indicator Description
The "Golden Area" indicator is a technical analysis tool designed to assist traders by identifying potential buy and sell signals based on moving averages and support/resistance levels within a specific time frame. This indicator can be applied directly to price charts.
#### How It Works
1. **Inputs:**
- **MA50 Length:** The period length for the 50-period Simple Moving Average (SMA).
- **MA200 Length:** The period length for the 200-period Simple Moving Average (SMA).
2. **Calculations:**
- **MA50 (50-period SMA):** Calculated by averaging the closing prices over the past 50 periods.
- **MA200 (200-period SMA):** Calculated by averaging the closing prices over the past 200 periods.
- **Support Level:** The lowest price over the last 50 periods.
- **Resistance Level:** The highest price over the last 50 periods.
3. **Time Filter:**
- **Start Time:** The indicator becomes active at 12:30 IST (07:00 UTC).
- **End Time:** The indicator deactivates at 10:30 IST the next day (05:00 UTC).
- A background color change (yellow) highlights the active time range on the chart.
4. **Signals:**
- **Buy Signal:** Triggered when the current time matches the start time and the closing price is below the support level.
- **Sell Signal:** Triggered when the current time matches the start time and the closing price is above the resistance level.
5. **Plots:**
- **MA50:** Plotted as a blue line on the chart.
- **MA200:** Plotted as a red line on the chart.
- **Buy Signals:** Indicated by a green 'B' below the bars.
- **Sell Signals:** Indicated by a red 'S' above the bars.
This indicator provides visual cues for potential trading opportunities within the specified time frame, aiding traders in making informed decisions.
Advanced Gold Scalping Strategy with RSI Divergence# Advanced Gold Scalping Strategy with RSI Divergence
## Overview
This Pine Script implements an advanced scalping strategy for gold (XAUUSD) trading, primarily designed for the 1-minute timeframe. The strategy utilizes the Relative Strength Index (RSI) indicator along with its moving average to identify potential trade setups based on divergences between price action and RSI movements.
## Key Components
### 1. RSI Calculation
- Uses a customizable RSI length (default: 60)
- Allows selection of the source for RSI calculation (default: close price)
### 2. Moving Average of RSI
- Supports multiple MA types: SMA, EMA, SMMA (RMA), WMA, VWMA, and Bollinger Bands
- Customizable MA length (default: 3)
- Option to display Bollinger Bands with adjustable standard deviation multiplier
### 3. Divergence Detection
- Implements both bullish and bearish divergence identification
- Uses pivot high and pivot low points to detect divergences
- Allows for customization of lookback periods and range for divergence detection
### 4. Entry Conditions
- Long Entry: Bullish divergence when RSI is below 40
- Short Entry: Bearish divergence when RSI is above 60
### 5. Trade Management
- Stop Loss: Customizable, default set to 11 pips
- Take Profit: Customizable, default set to 33 pips
### 6. Visualization
- Plots RSI line and its moving average
- Displays horizontal lines at 30, 50, and 70 RSI levels
- Shows Bollinger Bands when selected
- Highlights divergences with "Bull" and "Bear" labels on the chart
## Input Parameters
- RSI Length: Adjusts the period for RSI calculation
- RSI Source: Selects the price source for RSI (close, open, high, low, hl2, hlc3, ohlc4)
- MA Type: Chooses the type of moving average applied to RSI
- MA Length: Sets the period for the moving average
- BB StdDev: Adjusts the standard deviation multiplier for Bollinger Bands
- Show Divergence: Toggles the display of divergence labels
- Stop Loss: Sets the stop loss distance in pips
- Take Profit: Sets the take profit distance in pips
## Strategy Logic
1. **RSI Calculation**:
- Computes RSI using the specified length and source
- Calculates the chosen type of moving average on the RSI
2. **Divergence Detection**:
- Identifies pivot points in both price and RSI
- Checks for higher lows in RSI with lower lows in price (bullish divergence)
- Checks for lower highs in RSI with higher highs in price (bearish divergence)
3. **Trade Entry**:
- Enters a long position when a bullish divergence is detected and RSI is below 40
- Enters a short position when a bearish divergence is detected and RSI is above 60
4. **Position Management**:
- Places a stop loss order at the entry price ± stop loss pips (depending on the direction)
- Sets a take profit order at the entry price ± take profit pips (depending on the direction)
5. **Visualization**:
- Plots the RSI and its moving average
- Draws horizontal lines for overbought/oversold levels
- Displays Bollinger Bands if selected
- Shows divergence labels on the chart for identified setups
## Usage Instructions
1. Apply the script to a 1-minute XAUUSD (Gold) chart in TradingView
2. Adjust the input parameters as needed:
- Increase RSI Length for less frequent but potentially more reliable signals
- Modify MA Type and Length to change the sensitivity of the RSI moving average
- Adjust Stop Loss and Take Profit levels based on current market volatility
3. Monitor the chart for Bull (long) and Bear (short) labels indicating potential trade setups
4. Use in conjunction with other analysis and risk management techniques
## Considerations
- This strategy is designed for short-term scalping and may not be suitable for all market conditions
- Always backtest and forward test the strategy before using it with real capital
- The effectiveness of divergence-based strategies can vary depending on market trends and volatility
- Consider using additional confirmation signals or filters to improve the strategy's performance
Remember to adapt the strategy parameters to your risk tolerance and trading style, and always practice proper risk management.

Bitcoin to GOLD [presentTrading]**Introduction and How it is Different**
Unlike traditional indicators, the BTGR offers a unique perspective on market sentiment and asset valuation by juxtaposing two seemingly disparate assets: Bitcoin, the digital gold, and Gold, the traditional store of value. This article introduces an advanced version of this ratio, complete with upper and lower bands calculated using standard deviations. These bands add an extra layer of analytical depth, allowing for more nuanced trading strategies.
BTCUSD 12h bigger picture
**Economic Principles**
The BTGR is rooted in the economic principles of asset valuation and market sentiment. Gold has long been considered a safe haven asset, a place where investors park their money during times of economic uncertainty. Bitcoin, on the other hand, is often viewed as a high-risk, high-reward investment. By comparing the two, the BTGR provides insights into the broader market sentiment.
- Risk Appetite: A high BTGR indicates a bullish sentiment towards riskier assets like Bitcoin.
- Market Uncertainty: A low BTGR suggests a bearish sentiment and a flight to the safety of Gold.
- Asset Diversification: The BTGR can be used as a tool for portfolio diversification, helping investors balance risk and reward.
**How to Use It**
Setting Up the Indicator
- Platform: The indicator is designed for use on TradingView.
- Time Frame: A 480-minute time frame is recommended for more accurate signals.
- Parameters: The moving average is set at 200 periods, and the standard deviation is calculated over the same period.
**Trading Signal**
Long Entry: Consider going long when the BTGR crosses above the upper band.
Short Entry: Consider going short when the BTGR crosses below the lower band.
Note: Due to the issue that the number of trading is less than about 100 times, the corresponding strategy is not allowed to publish.

Volatility Risk Premium GOLD & SILVER 1.0ENGLISH
This indicator (V-R-P) calculates the (one month) Volatility Risk Premium for GOLD and SILVER.
V-R-P is the premium hedgers pay for over Realized Volatility for GOLD and SILVER options.
The premium stems from hedgers paying to insure their portfolios, and manifests itself in the differential between the price at which options are sold (Implied Volatility) and the volatility GOLD and SILVER ultimately realize (Realized Volatility).
I am using 30-day Implied Volatility (IV) and 21-day Realized Volatility (HV) as the basis for my calculation, as one month of IV is based on 30 calendaristic days and one month of HV is based on 21 trading days.
At first, the indicator appears blank and a label instructs you to choose which index you want the V-R-P to plot on the chart. Use the indicator settings (the sprocket) to choose one of the precious metals (or both).
Together with the V-R-P line, the indicator will show its one year moving average within a range of +/- 15% (which you can change) for benchmarking purposes. We should consider this range the “normalized” V-R-P for the actual period.
The Zero Line is also marked on the indicator.
Interpretation
When V-R-P is within the “normalized” range, … well... volatility and uncertainty, as it’s seen by the option market, is “normal”. We have a “premium” of volatility which should be considered normal.
When V-R-P is above the “normalized” range, the volatility premium is high. This means that investors are willing to pay more for options because they see an increasing uncertainty in markets.
When V-R-P is below the “normalized” range but positive (above the Zero line), the premium investors are willing to pay for risk is low, meaning they see decreasing uncertainty and risks in the market, but not by much.
When V-R-P is negative (below the Zero line), we have COMPLACENCY. This means investors see upcoming risk as being lower than what happened in the market in the recent past (within the last 30 days).
CONCEPTS :
Volatility Risk Premium
The volatility risk premium (V-R-P) is the notion that implied volatility (IV) tends to be higher than realized volatility (HV) as market participants tend to overestimate the likelihood of a significant market crash.
This overestimation may account for an increase in demand for options as protection against an equity portfolio. Basically, this heightened perception of risk may lead to a higher willingness to pay for these options to hedge a portfolio.
In other words, investors are willing to pay a premium for options to have protection against significant market crashes even if statistically the probability of these crashes is lesser or even negligible.
Therefore, the tendency of implied volatility is to be higher than realized volatility, thus V-R-P being positive.
Realized/Historical Volatility
Historical Volatility (HV) is the statistical measure of the dispersion of returns for an index over a given period of time.
Historical volatility is a well-known concept in finance, but there is confusion in how exactly it is calculated. Different sources may use slightly different historical volatility formulas.
For calculating Historical Volatility I am using the most common approach: annualized standard deviation of logarithmic returns, based on daily closing prices.
Implied Volatility
Implied Volatility (IV) is the market's forecast of a likely movement in the price of the index and it is expressed annualized, using percentages and standard deviations over a specified time horizon (usually 30 days).
IV is used to price options contracts where high implied volatility results in options with higher premiums and vice versa. Also, options supply and demand and time value are major determining factors for calculating Implied Volatility.
Implied Volatility usually increases in bearish markets and decreases when the market is bullish.
For determining GOLD and SILVER implied volatility I used their volatility indices: GVZ and VXSLV (30-day IV) provided by CBOE.
Warning
Please be aware that because CBOE doesn’t provide real-time data in Tradingview, my V-R-P calculation is also delayed, so you shouldn’t use it in the first 15 minutes after the opening.
This indicator is calibrated for a daily time frame.
----------------------------------------------------------------------
ESPAŇOL
Este indicador (V-R-P) calcula la Prima de Riesgo de Volatilidad (de un mes) para GOLD y SILVER.
V-R-P es la prima que pagan los hedgers sobre la Volatilidad Realizada para las opciones de GOLD y SILVER.
La prima proviene de los hedgers que pagan para asegurar sus carteras y se manifiesta en el diferencial entre el precio al que se venden las opciones (Volatilidad Implícita) y la volatilidad que finalmente se realiza en el ORO y la PLATA (Volatilidad Realizada).
Estoy utilizando la Volatilidad Implícita (IV) de 30 días y la Volatilidad Realizada (HV) de 21 días como base para mi cálculo, ya que un mes de IV se basa en 30 días calendario y un mes de HV se basa en 21 días de negociación.
Al principio, el indicador aparece en blanco y una etiqueta le indica que elija qué índice desea que el V-R-P represente en el gráfico. Use la configuración del indicador (la rueda dentada) para elegir uno de los metales preciosos (o ambos).
Junto con la línea V-R-P, el indicador mostrará su promedio móvil de un año dentro de un rango de +/- 15% (que puede cambiar) con fines de evaluación comparativa. Deberíamos considerar este rango como el V-R-P "normalizado" para el período real.
La línea Cero también está marcada en el indicador.
Interpretación
Cuando el V-R-P está dentro del rango "normalizado",... bueno... la volatilidad y la incertidumbre, como las ve el mercado de opciones, es "normal". Tenemos una “prima” de volatilidad que debería considerarse normal.
Cuando V-R-P está por encima del rango "normalizado", la prima de volatilidad es alta. Esto significa que los inversores están dispuestos a pagar más por las opciones porque ven una creciente incertidumbre en los mercados.
Cuando el V-R-P está por debajo del rango "normalizado" pero es positivo (por encima de la línea Cero), la prima que los inversores están dispuestos a pagar por el riesgo es baja, lo que significa que ven una disminución, pero no pronunciada, de la incertidumbre y los riesgos en el mercado.
Cuando V-R-P es negativo (por debajo de la línea Cero), tenemos COMPLACENCIA. Esto significa que los inversores ven el riesgo próximo como menor que lo que sucedió en el mercado en el pasado reciente (en los últimos 30 días).
CONCEPTOS :
Prima de Riesgo de Volatilidad
La Prima de Riesgo de Volatilidad (V-R-P) es la noción de que la Volatilidad Implícita (IV) tiende a ser más alta que la Volatilidad Realizada (HV) ya que los participantes del mercado tienden a sobrestimar la probabilidad de una caída significativa del mercado.
Esta sobreestimación puede explicar un aumento en la demanda de opciones como protección contra una cartera de acciones. Básicamente, esta mayor percepción de riesgo puede conducir a una mayor disposición a pagar por estas opciones para cubrir una cartera.
En otras palabras, los inversores están dispuestos a pagar una prima por las opciones para tener protección contra caídas significativas del mercado, incluso si estadísticamente la probabilidad de estas caídas es menor o insignificante.
Por lo tanto, la tendencia de la Volatilidad Implícita es de ser mayor que la Volatilidad Realizada, por lo cual el V-R-P es positivo.
Volatilidad Realizada/Histórica
La Volatilidad Histórica (HV) es la medida estadística de la dispersión de los rendimientos de un índice durante un período de tiempo determinado.
La Volatilidad Histórica es un concepto bien conocido en finanzas, pero existe confusión sobre cómo se calcula exactamente. Varias fuentes pueden usar fórmulas de Volatilidad Histórica ligeramente diferentes.
Para calcular la Volatilidad Histórica, utilicé el enfoque más común: desviación estándar anualizada de rendimientos logarítmicos, basada en los precios de cierre diarios.
Volatilidad Implícita
La Volatilidad Implícita (IV) es la previsión del mercado de un posible movimiento en el precio del índice y se expresa anualizada, utilizando porcentajes y desviaciones estándar en un horizonte de tiempo específico (generalmente 30 días).
IV se utiliza para cotizar contratos de opciones donde la alta Volatilidad Implícita da como resultado opciones con primas más altas y viceversa. Además, la oferta y la demanda de opciones y el valor temporal son factores determinantes importantes para calcular la Volatilidad Implícita.
La Volatilidad Implícita generalmente aumenta en los mercados bajistas y disminuye cuando el mercado es alcista.
Para determinar la Volatilidad Implícita de GOLD y SILVER utilicé sus índices de volatilidad: GVZ y VXSLV (30 días IV) proporcionados por CBOE.
Precaución
Tenga en cuenta que debido a que CBOE no proporciona datos en tiempo real en Tradingview, mi cálculo de V-R-P también se retrasa, y por este motivo no se recomienda usar en los primeros 15 minutos desde la apertura.
Este indicador está calibrado para un marco de tiempo diario.

Alt Golden Ratio by USCG_VetPine Script math based on the medium article by Philip Swift.
Idea based from Willy Woo Charts.
Disclaimer: None of this Pine Script, Title, nor Description should be used for Financial Advice. For Education Purposes Only.
Purpose: Identify a Golden Ratio Cross of the 350 Daily MA vs the 111 Daily MA with Multiplier to theorize where local valuation tops or bottoms could be approximated. NOT FINANCIAL ADVICE!
Parameters:
DMA A: short Daily Moving Average
DMA B: long Daily Moving Average
Golden Ratio: point where short Daily Moving Average crosses value assigned in parameter.
Indicators:
S2: Cross of DMA A vs DMA B in upward direction (approximate local top)
Sn: additional approximate top indicators
Sell1: first approximate local bottom
Selln: additional approximate local bottom indicators
GR: Golden-Ratio Cross of DMA A

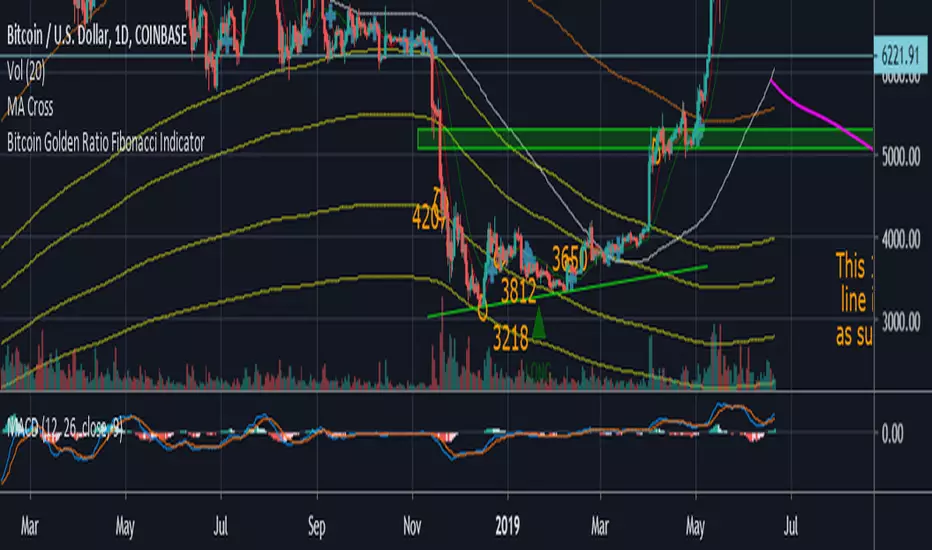
Bitcoin Golden Ratio Fibonacci IndicatorI didn't see this one already it isn't my original idea either. I pulled the formula's from an article on medium, I also added few bear market bottom fib indicators.
Credit to the article I pulled the formula from.
The Golden Ratio Multiplier
Unlocking the mathematically organic nature of Bitcoin adoption
Go to the profile of Philip Swift (@PositiveCrypto)
Philip Swift (@PositiveCrypto)
Jun 17, 2019
By Philip Swift
Release Notes: Fixed spelling error on title, added a couple long and short labels for the top and bottom indicator.
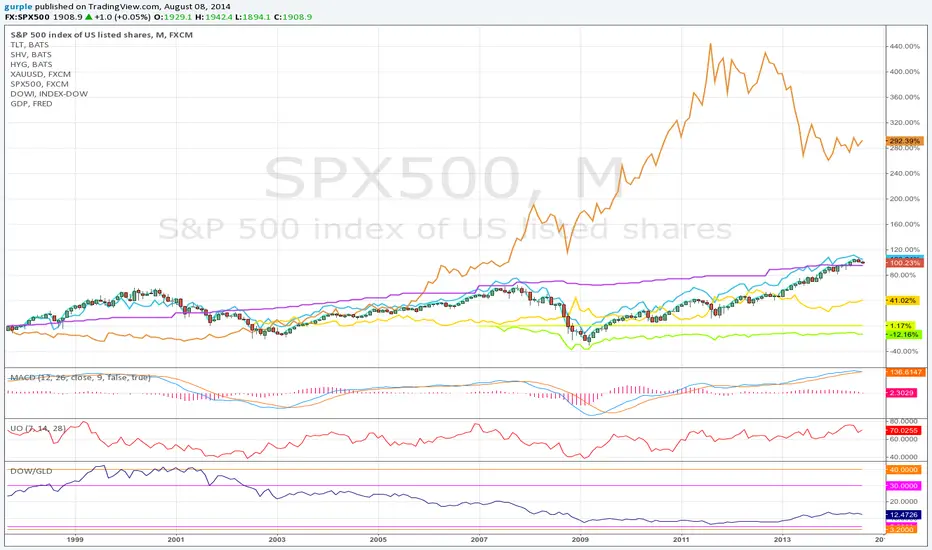
DOW / GOLD RatioThis indicator shows the ratio between the DJIA and the price of gold. When the ratio is below 5 it is generally accepted that a rotation from commodities to equities should be investigated. When the ratio is above 30 it is, likewise, advised to consider rotating from equities to commodities.
This is a modest improvement of the script to mark the key thresholds where equities/commodities holdings rotations could be prudent. I’m sure I’ll be submitting a number of instances of these scripts as I learn the syntax and features while developing them.
Gold Traders Shymkent# Gold Traders Shymkent
## Description
**Gold Traders Shymkent** is a professional ZigZag indicator designed specifically for traders from Kazakhstan. Based on the classic ZigZag indicator logic from MT4 platform, it identifies key trend points in price movements and displays them visually.
## Key Features
### 🎯 Core Functions:
- **ZigZag Analysis**: Identification of significant price highs and lows
- **Kazakh Labeling**: ЖЖ (Higher High), ЖТ (Higher Low), ТЖ (Lower High), ТТ (Lower Low) labels in Kazakh language
- **Flexible Settings**: Depth, Deviation, and Backstep parameters
- **Two Modes**: Repainting and non-repainting modes
### ⚙️ Configuration Parameters:
1. **ZigZag Settings**:
- Depth - reversal depth
- Deviation - minimum deviation percentage
- Backstep - backward step value
2. **Display Parameters**:
- Line thickness
- Bull/Bear colors
- Show/hide labels
- Toggle ЖЖ/ЖТ/ТЖ/ТТ markers
- Transparency for lines and labels
3. **Operation Modes**:
- Repainting mode (real-time updates)
- ZigZag line extension option
### 🔔 Alert System:
The indicator provides alerts for:
- New ЖЖ/ЖТ/ТЖ/ТТ points formation
- Direction changes (bull to bear or vice versa)
- Trend reversals
### Advantages:
- **Easy to Use**: Intuitive interface with Kazakh language settings
- **Flexibility**: Adaptable to different market conditions
- **Clarity**: Kazakh labeling convenient for local traders
- **Versatility**: Works on all timeframes
## Usage Instructions
### Basic Usage:
1. **Trend Identification**: Monitor main trend through ZigZag lines
2. **Support/Resistance Levels**: Use extremum points as support and resistance levels
3. **Reversal Points**: Identify trend change points
### Recommended Settings:
- **For volatile markets**: Depth = 12, Deviation = 5
- **For slow markets**: Depth = 20, Deviation = 8
- **To reduce whipsaws**: Backstep = 3
## Important Notes
⚠️ **Key Considerations**:
- The indicator may operate in repainting mode
- False signals possible on lower timeframes
- Adjust settings according to market conditions
- Use with other indicators for major trading decisions
## Technical Details
- **Author**: Based on Dev Lucem code, adapted to Kazakh language
- **Language**: Pine Script v5
- **Interface Language**: Kazakh
- **Required Libraries**: DevLucem/ZigLib/1
---
📊 **Gold Traders Shymkent** - A professional analysis tool specifically developed for Kazakhstani traders. The indicator combines accuracy with ease of use to assist in market decision making.
**Motto**: "Accuracy and reliability - the key to successful trading!"

Gold Traders Shymkent# Gold Traders Shymkent
## Description
**Gold Traders Shymkent** is a professional ZigZag indicator designed specifically for traders from Kazakhstan. Based on the classic ZigZag indicator logic from MT4 platform, it identifies key trend points in price movements and displays them visually.
## Key Features
### 🎯 Core Functions:
- **ZigZag Analysis**: Identification of significant price highs and lows
- **Kazakh Labeling**: ЖЖ (Higher High), ЖТ (Higher Low), ТЖ (Lower High), ТТ (Lower Low) labels in Kazakh language
- **Flexible Settings**: Depth, Deviation, and Backstep parameters
- **Two Modes**: Repainting and non-repainting modes
### ⚙️ Configuration Parameters:
1. **ZigZag Settings**:
- Depth - reversal depth
- Deviation - minimum deviation percentage
- Backstep - backward step value
2. **Display Parameters**:
- Line thickness
- Bull/Bear colors
- Show/hide labels
- Toggle ЖЖ/ЖТ/ТЖ/ТТ markers
- Transparency for lines and labels
3. **Operation Modes**:
- Repainting mode (real-time updates)
- ZigZag line extension option
### 🔔 Alert System:
The indicator provides alerts for:
- New ЖЖ/ЖТ/ТЖ/ТТ points formation
- Direction changes (bull to bear or vice versa)
- Trend reversals
### Advantages:
- **Easy to Use**: Intuitive interface with Kazakh language settings
- **Flexibility**: Adaptable to different market conditions
- **Clarity**: Kazakh labeling convenient for local traders
- **Versatility**: Works on all timeframes
## Usage Instructions
### Basic Usage:
1. **Trend Identification**: Monitor main trend through ZigZag lines
2. **Support/Resistance Levels**: Use extremum points as support and resistance levels
3. **Reversal Points**: Identify trend change points
### Recommended Settings:
- **For volatile markets**: Depth = 12, Deviation = 5
- **For slow markets**: Depth = 20, Deviation = 8
- **To reduce whipsaws**: Backstep = 3
## Important Notes
⚠️ **Key Considerations**:
- The indicator may operate in repainting mode
- False signals possible on lower timeframes
- Adjust settings according to market conditions
- Use with other indicators for major trading decisions
## Technical Details
- **Author**: Based on Dev Lucem code, adapted to Kazakh language
- **Language**: Pine Script v5
- **Interface Language**: Kazakh
- **Required Libraries**: DevLucem/ZigLib/1
---

Breaker Blocks Finder | Gold | ProjectSyndicateProjectSyndicate Breaker Blocks Finder
📊 Overview
The ProjectSyndicate Breaker Blocks Finder (PS BB Finder) is a professional-grade Pine Script indicator designed to detect and display Bullish and Bearish Breaker Blocks based on Smart Money Concepts (SMC) methodology. This indicator is specifically optimized for XAUUSD (Gold) trading but works reliably across all symbols and timeframes.
Key Features
✅ Non-Repainting: Breaker blocks never change position after formation
✅ Multi-Timeframe Support: Optimized for M5, M10, M15, M20, M30, and H1
✅ Highly Customizable: 10+ user-configurable settings
✅ Visual Clarity: Color-coded boxes and labels for easy identification
✅ Performance Optimized: Handles 1000+ candles without lag
✅ Cross-Symbol Compatible: Works on Forex, Crypto, Stocks, Indices, and Commodities
✅ Displacement Detection: Uses ATR-based displacement to filter false signals
🎯 What are Breaker Blocks?
A Breaker Block is a failed order block that becomes a new support or resistance zone after being invalidated by price. It represents a market structure shift where institutional traders (smart money) have flipped their position.
Bullish Breaker Block
A Bullish Breaker Block forms when:
1 A bearish order block (resistance zone) exists
2 Price breaks ABOVE this zone with strong displacement
3 The former resistance zone now becomes SUPPORT
4 Price may retest this zone before continuing higher
Visual: Green box with "BB ▲" label
Bearish Breaker Block
A Bearish Breaker Block forms when:
5 A bullish order block (support zone) exists
6 Price breaks BELOW this zone with strong displacement
7 The former support zone now becomes RESISTANCE
8 Price may retest this zone before continuing lower
Visual: Red box with "BB ▼" label
⚙️ Default Settings
Setting Default Range Description
Lookback Period 1000 100-5000 Number of historical candles to analyze
Max Breaker Blocks 5 1-50 Maximum number of breaker blocks to display
Swing Detection Length 10 2-20 Bars on each side to confirm swing high/low. Higher = more significant swings
Use Displacement Filter true true/false Enable to filter breaker blocks by displacement size
Displacement Multiplier 2.0 0.5-5.0 Minimum move size as multiple of ATR. Higher = stricter detection
Invalidation Method Close Close/Wick Close = Conservative (candle must close beyond zone)Wick = Aggressive (wick touch is enough)
📈 Recommended Timeframes & Settings
This indicator is optimized for the following timeframes. Use these settings as a starting point.
Lower Timeframes (M5, M10, M15, M20)
These settings are designed to capture faster price movements and are the default settings for the indicator.
Setting Recommended Value
Lookback Period 1000
Max Breaker Blocks 5
Swing Detection Length 10
Use Displacement Filter true
Displacement Multiplier 2.0
Invalidation Method Close
Higher Timeframes (M30, H1)
For these timeframes, a less strict displacement filter is recommended to capture more significant, but less frequent, breaker blocks.
Setting Recommended Value
Lookback Period 1000
Max Breaker Blocks 5
Swing Detection Length 10
Use Displacement Filter true
Displacement Multiplier 1.0
Invalidation Method Close
🎓 How to Use
Step 1: Identify Breaker Blocks
Once the indicator is loaded, breaker blocks will automatically appear on your chart:
• Green boxes = Bullish breaker blocks (former resistance, now support)
• Red boxes = Bearish breaker blocks (former support, now resistance)
Step 2: Wait for Retest
The most reliable trading opportunities occur when price retests the breaker block zone:
• For bullish breaker blocks, wait for price to come back down to the green zone
• For bearish breaker blocks, wait for price to come back up to the red zone
Step 3: Look for Confluence
Combine breaker blocks with other SMC concepts for higher probability setups:
• Fair Value Gaps (FVG) within the breaker block zone
• Liquidity grabs before the retest
• Break of Structure (BoS) or Change of Character (ChoCH) confirmation
Step 4: Enter the Trade
Bullish Setup:
• Entry: At or near the bullish breaker block zone
• Stop Loss: Below the breaker block
• Take Profit: Previous swing high or higher
Bearish Setup:
• Entry: At or near the bearish breaker block zone
• Stop Loss: Above the breaker block
• Take Profit: Previous swing low or lower
🛡️ Non-Repainting Guarantee
This indicator is 100% non-repainting, meaning:
✅ Breaker blocks never change position after formation
✅ Historical breaker blocks remain in the exact same location indefinitely
✅ Backtesting results are reliable and consistent
🐛 Troubleshooting
Issue: No Breaker Blocks Appearing
Solutions:
• Ensure "Use Displacement Filter" is enabled.
• On M30/H1, try lowering the "Displacement Multiplier" to 1.0.
• Scroll back in history; blocks may not be present on the most recent bars.
Issue: Too Many Breaker Blocks
Solutions:
• Increase "Displacement Multiplier" to 2.5 or 3.0.
• Increase "Swing Detection Length" to 12-15.
• Decrease "Max Breaker Blocks" to 3-4.

Gold Killer Ultimate - Precision & PipsGold Killer Ultimate - Precision & Pips
//@version=5
indicator("Gold Killer Ultimate - Precision & Pips", overlay=true, max_labels_count=500)
// ==========================================
// 1. KONFIGURASI & INPUT
// ==========================================
group_time = "Acuan Waktu"
target_hour = input.int(23, "Jam POS Harian (UTC)", minval=0, maxval=23, group=group_time)
target_min = input.int(0, "Menit POS Harian", minval=0, maxval=59, group=group_time)

Gold Pullback Precision ProGold Pullback Precision Pro
EMA slope + pullback strategy designed for gold scalping. Combines trend confirmation (slopes) with precise entries (pullbacks), filtered by HTF direction, volume, and RSI. Shows clear BUY/SELL signals with comprehensive dashboard.

Order Block Finder | Gold | ProjectSyndicate🥇 ProjectSyndicate Gold Order Block Finder
📌 Institutional Order Blocks for XAUUSD Built for Gold’s Volatility
The ProjectSyndicate Gold Order Block Finder is a professional-grade TradingView indicator engineered specifically for XAUUSD / Gold traders who want clean, high-probability institutional supply & demand zones on their chart.
Gold moves fast, sweeps liquidity often, and loves sharp displacement. This tool is tuned to match that behavior—so you can quickly spot the zones where smart money likely stepped in, and plan entries, targets, and invalidations with confidence. ✅
🚀 Why Gold Traders Like It
✅ Made for XAUUSD: Detection is tuned for Gold’s unique volatility and impulse structure
🏦 Institutional Zone Detection: Finds the last opposing candle before a true displacement + structure break
🧹 Auto-Cleanup (Mitigation): Zones automatically disappear when invalidated (no clutter)
📦 Clean Visualization: Professional OB boxes that extend into live price action
⚡ Pine Script v6: Built on the latest TradingView engine for stability and speed
🧠 Detection Logic Simple, Effective, Battle-Tested
📈 Bullish Order Block (Demand):
The last bearish candle before a strong bullish displacement that breaks market structure (BOS)
📉 Bearish Order Block (Supply):
The last bullish candle before a strong bearish displacement that breaks market structure (BOS)
💥 Displacement Filter Power Move Confirmation:
Zones are validated only when the impulse move meets a minimum strength threshold (default: 1.3× candle range)—helping filter out weak noise and low-quality blocks.
🛠 Recommended Gold Settings (XAUUSD)
Use these presets to match Gold’s typical behavior across higher-impact timeframes:
Timeframe | Swing Length | Displacement
M5 | 5–7 | 1.2 – 1.4
M10 | 5–7 | 1.2 – 1.4
M30 | 5–7 | 1.2 – 1.4
H1 | 7–9 | 1.3 – 1.6
H4 | 8–10 | 1.5 – 2.0
💡 Tip: If you want more signals, reduce Swing Length.
If you want higher quality only, increase Displacement.
✅ Best Use-Cases on Gold
🎯 Mark premium supply/demand zones without manual drawing
🧲 Wait for price to return to the OB for cleaner entries
🛡️ Use OB boundaries for clear invalidation + stop placement
📊 Combine with trend bias / liquidity sweeps / session levels for extra confirmation

LBMA London Gold Fix Times [Auto DST]## Overview
This lightweight indicator automatically marks the **LBMA Gold Price Fixing** times on your chart using vertical lines. It is designed specifically for **XAUUSD (Gold)** traders who need to monitor institutional liquidity and volatility shifts during the London session.
The indicator tracks the two key daily fixing moments:
* **AM Fix:** 10:30 (London Time)
* **PM Fix:** 15:00 (London Time)
## Key Features
* **🌍 Auto Daylight Saving Time (DST):** Built with the `Europe/London` timezone parameter. It automatically adjusts to British Summer Time (BST) and GMT, so you never have to manually change the UTC offset settings.
* **⚡ Minimalist Design:** Draws clean vertical lines without cluttering your chart with text labels.
* **🎨 Fully Customizable:** You can adjust the line color, width, and style (Solid, Dashed, Dotted) for both AM and PM sessions independently.
## Why are these times important?
The London Gold Fix (LBMA Gold Price) is the global benchmark for physical gold settlement. Major institutions, central banks, and mining companies settle contracts at these times. Consequently, **10:30** and **15:00** (London time) often witness:
1. Significant spikes in volatility.
2. Trend reversals or accelerations.
3. Massive volume injection.
## Usage Tips
* **Timeframe:** This indicator works best on **Intraday Timeframes** (1-minute to 30-minute charts).
* *Note:* It may not be visible on H1 (1-hour) charts or higher because the fix times (e.g., 10:30) occur in the middle of an hourly candle.
* **Setup:** Simply add it to your chart. No timezone configuration is required; the script calculates London time internally.
## Settings
* **AM Fix Color:** Default is Blue (London Morning).
* **PM Fix Color:** Default is Red (London Afternoon/US Morning overlap).
* **Line Style:** Choose between Solid, Dashed, or Dotted lines.
概述 (Overview)
这是一个轻量级的辅助指标,通过垂直线在图表上自动标记 LBMA 伦敦金定盘价(LBMA Gold Price Fixing) 的时刻。它是专为 XAUUSD(黄金) 交易者设计的,旨在帮助大家捕捉伦敦时段内机构流动性和市场波动的关键节点。
该指标会自动锁定每天两个核心的定盘时间:
上午定盘 (AM Fix): 10:30 (伦敦时间)
下午定盘 (PM Fix): 15:00 (伦敦时间)
主要功能 (Key Features)
🌍 自动识别夏令时 (Auto DST): 代码内置 Europe/London 时区参数。无论英国处于夏令时 (BST) 还是冬令时 (GMT),指标都会自动精准对齐,无需用户手动调整时区设置。
⚡ 极简主义设计: 仅绘制干净的垂直线,不显示任何文字标签,避免遮挡K线或干扰视线。
🎨 高度可定制: 您可以独立调整上午和下午定盘线的颜色、粗细以及样式(实线、虚线或点线)。
为什么要关注这两个时间点?
LBMA 伦敦金定盘价是全球实物黄金结算的基准价格。大型金融机构、中央银行和金矿公司通常会在这个时间点集中进行合约结算。因此,在伦敦时间 10:30 和 15:00 前后,市场经常会出现:
波动率瞬间激增。
短期趋势的反转或加速。
巨量成交量的涌入。
使用建议 (Usage Tips)
适用周期: 建议在 日内分时图(1分钟、5分钟、15分钟或30分钟)上使用。
注意: 在 1小时 (H1) 或更大的周期上,线条可能无法显示,因为定盘时间(如 10:30)发生在整点K线的内部,无法被单独标记。
设置方法: 加载指标即可使用。无论您本地电脑的时间设置如何,脚本内部会自动计算正确的伦敦时间。
参数设置 (Settings)
AM Fix Color: 上午定盘线颜色(默认为蓝色)。
PM Fix Color: 下午定盘线颜色(默认为红色,此时往往也是美盘初期的波动高峰)。
Line Style: 线条样式选择(实线、虚线、点线)。

Gold DropGold Drop – Intraday Trading System (India Markets)
Gold Drop is a rule-based intraday trading strategy designed specifically for Indian index trading (BANKNIFTY / NIFTY), combining trend, momentum, strength, and fixed reference levels to deliver consistent and disciplined trade execution.
The system is built to avoid emotional trading, over-trading, and shifting levels during the session
