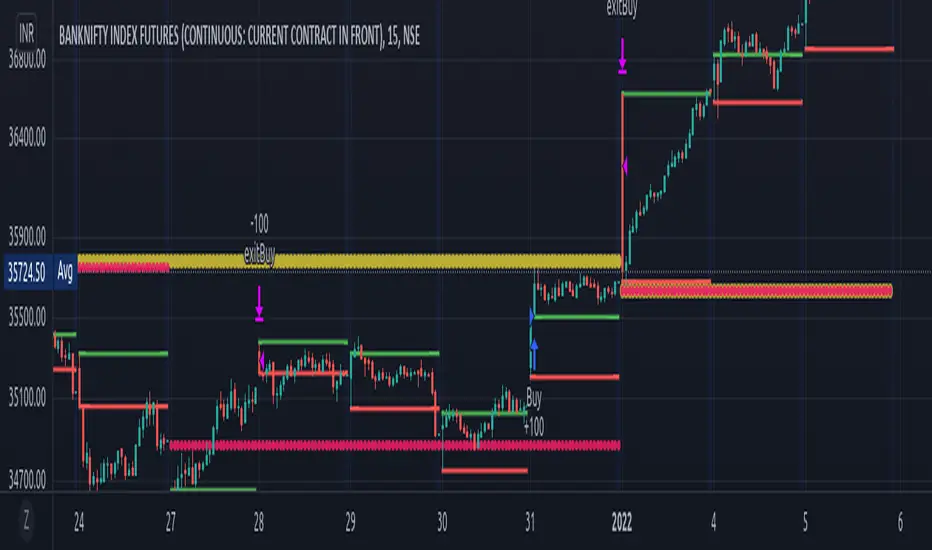
TDI Strategy @Version=2 by SodewalaThis strategy will automatically find good big up trend and filte most choppy/sideways market. please like if you find useful. comment if you have some good suggestions. Thanks
Cari dalam skrip untuk "TDI"

TDI Pro's Analytic Tool by YardleyRosette
This tool simplifies the general rules of a strategy based on Traders Dynamic Index to my best ability.
The trader must only enter at the most reasonable place, such as when the signal says to buy or sell but it really means a retracement has formed in the view of the trader, for entry into opposite direction.
For example, using KK_TDI_BH, to see oversold or overbought conditions such as:
KK_TDI_BH: RSI/TSL crossing up from under 32 level for a good buy entry with MBL under 50.
Or, RSI/TSL crossing down from above 68 level for a good sell entry with MBL over 50.
Also, close entry orders are potential reversal entries if overlay MBL declines direction and/or KK_TDI_BH: V.B. squeezes on the time frame or a second time frame used.
HigherTF MAs, guide in seeing market conditions and support/resistance overall and combination of them with current time frame to especially help stay in longer-term trades.
By not entering and exiting blindly with this tool, the trader will be able to do on-the-job training. Will work best with traders using TradingView Pro and above (using multiple charts)
Strategy Results overview based on FOREX 0.3 lot size
Sistema de compraventas ( Trading ), usando mi herramienta de analítica y en base al Índice Dinámico de Comerciantes.
Se necesita entrenamiento para usarlo a mayor utilidad.
_______________________

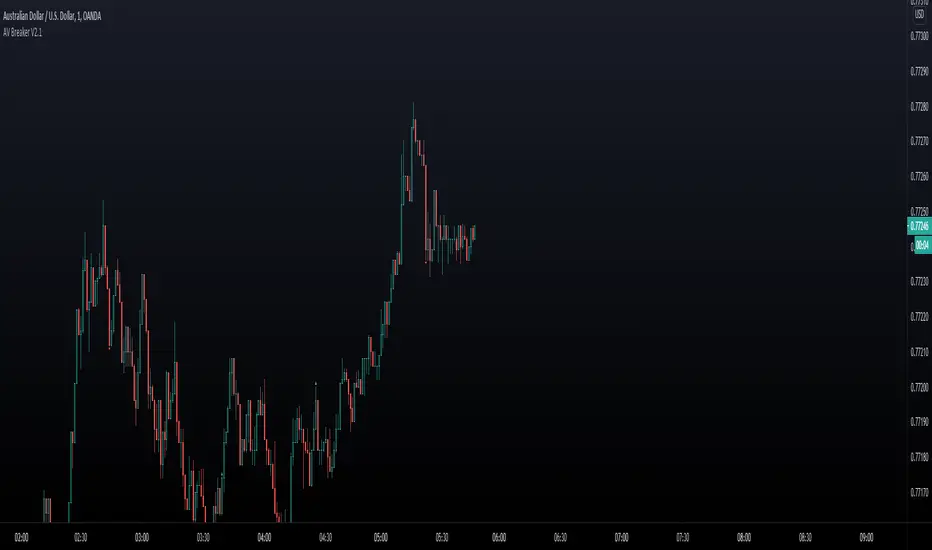
THE AV BREAKERTHE SHARKFIN
The AV Breaker uses a TDI to define sharkfins. You can set it up so it only
alert sharkfins at a specific level. Like 70/30 above/below. Or at anytime
it sharkfin the upper/lower band (Not using any level criteria.)
THE BREAKER
A breaker happens when an order block is taken out after a sharkfin setup.
This gives a HIGH probabillity reversal signal. If used with your own
higher Timeframe strategy.
THE ALERTS
The AV Breaker has built in Alert Function. You can however tell The AV breaker
what hours you want to see the alerts. You can also color the chart with a click
of a button during your alert hours session.
The Alert Session Plotted on Chart uses New York Time.
Settings:
- Time Session (Between what hours you want alert to be active)
- Highlight Session Range If you want chart to color selected "Time Sessiion Hours"
- Number of candles in The Order Block (Set your requirement for an Order Block)
TDI Settings: (The TDI do not need to be added to chart, but can be handy visually to add)
- TDI Low Level: 30 Default
- TDI High Level: 70 Default
- Use High/Low TDI Levels (If sharkfin has to be created above/below choosen TDI Level)
-- (Plus you can set any number on The TDI (Bands, RSI, MA's etc) --
How to use:
How you use it is up to you. However upon signal of The Breaker it can be good to wait
for a pullback to breaking opposite candle, or use a simple ABC 50% Fibs or similar.
Advanced Session Profile Predictor with SR Boxes & ORAdvanced Session Profile Predictor with Momentum Arrows
Designed for intraday traders, this indicator analyzes price action across Asia, London, and New York sessions to predict market profiles and highlight key trading opportunities. By combining session-based profiling, Opening Range (OR) visualization, and momentum signals from Traders Dynamic Index (TDI), it offers a unique tool for anticipating trends, reversals, and breakouts. Ideal for forex, indices, and crypto on 15M–1H charts.
What Makes This Indicator Unique?
Unlike typical session indicators that only mark time zones or standard TDI scripts that focus on momentum, this tool:
Predicts market profiles (e.g., "Trend Continuation," "NY Manipulation") by analyzing session ranges and directional moves, offering actionable insights into how sessions interact.
Visualizes Opening Range (OR) boxes for the first 15 minutes of each session, helping traders spot early breakout levels.
Integrates TDI with momentum to generate precise bullish/bearish arrows, filtered by session context for improved reliability.
Simplifies decision-making with dynamic profile labels showing real-time long/short conditions based on price levels.
How Does It Work?
Session Tracking:
Asia (00:00–08:00 UTC, yellow), London (08:00–16:00 UTC, red), and New York (13:00–21:00 UTC, blue) sessions are highlighted with background colors and high/low lines (crosses).
OR boxes (first 15 minutes) are drawn for each session: yellow for Asia, red for London, blue for NY.
Profile Prediction:
Compares Asia and London session ranges and directions (e.g., trending if range > 1.5x 5-period SMA).
Examples:
Trend Continuation: Asia and London trend in the same direction—long above Asia high (uptrend) or short below Asia low (downtrend).
NY Manipulation: Asia trends, London consolidates—watch for NY breakouts at London high/low.
Displays the predicted profile and entry conditions in labels (e.g., "IF price hits 1.2000 LONG").
Momentum Arrows:
Uses TDI (RSI period 21, bands 34, fast MA 2) and 12-period momentum.
Green up arrow: Fast MA > upper band (>68) and momentum rising (bullish).
Red down arrow: Fast MA < lower band (<32) and momentum falling (bearish).
Support/Resistance (SR):
Plots dynamic SR boxes based on pivot highs/lows, filtered by volume (inspired by ChartPrime’s methodology, credited below).
How to Use It
Setup: Apply to a 15M–1H chart. Adjust time zone (default: UTC) and session times if needed. Customize TDI/momentum settings for sensitivity.
Trading:
Check the top-right labels for the current profile and entry conditions (e.g., "IF price hits LONG/SHORT").
Confirm entries with green up arrows (bullish) or red down arrows (bearish).
Use OR boxes and session high/low lines to identify breakout or reversal levels.
Example: In "NY Manipulation," wait for price to hit London high (long) or low (short) during NY session, confirmed by an arrow.
Best Markets: Forex (EUR/USD), indices (SPX500), crypto (BTC/USD) with sufficient intraday volatility.
Underlying Concepts
Session Profiling: Detects trends (range > SMA * threshold) and manipulation (e.g., London breaking Asia’s high/low) to predict NY behavior.
OR Boxes: Marks the first 15 minutes’ high/low as a breakout zone (time-based, 900,000 ms).
TDI + Momentum: Combines RSI-based bands with price change (close – close ) for momentum signals.
SR Boxes: Identifies pivots over a lookback period (default 20), scaled by ATR and filtered by volume thresholds.
Credits
The SR box logic is inspired by ChartPrime’s volume-filtered support/resistance methodology, adapted with custom breakout/hold detection. Original authors are credited for their foundational work.
Chart Setup
Displays session backgrounds, OR boxes, high/low lines, TDI arrows, and profile labels. Keep other indicators off for clarity.

My Ultimate Reversal Probability Signal (Adaptive)Adaptive indicator combining RSI, T3, ZigZag, Torben, TDI, POB, and reversal probability (credit to original Author) to identify potential trend reversals with customizable settings.
My Ultimate Reversal Probability Signal (Adaptive)
Overview:
This advanced technical indicator is designed to help traders identify potential trend reversals by combining multiple analytical methods into a single, customizable tool. It integrates adaptive RSI, T3 Moving Average, ZigZag Multi-Scale, Torben Moving Median, Trend Direction Index (TDI), Point of Balance (POB) Oscillator, and a Trend Reversal Probability model. The indicator provides clear visual signals and a detailed table for real-time market analysis, making it suitable for traders of all experience levels.
Key Features:
Adaptive RSI: Dynamically adjusts RSI length based on market volatility, with customizable min/max lengths (5–50).
T3 Moving Average: Smooths price data with adaptive length (5–50) for trend detection.
ZigZag Multi-Scale: Identifies key swing points with adaptive length (3–20) and plots an average line.
Torben Moving Median: Provides robust trend bands using a median-based approach (5–50).
Trend Direction Index (TDI): Assesses future trend direction with adaptive length (3–7) and ADX integration.
Point of Balance (POB) Oscillator: Measures market equilibrium with adaptive length (5–50).
Trend Reversal Probability: Estimates reversal likelihood using a statistical model based on SMA crossovers.
Reversal Zones: Highlights overbought/oversold conditions with RSI-based zones (default: 70/30).
Future Trend Visualization: Projects potential price movements using volume delta analysis.
Comprehensive Table: Displays real-time values for RSI length, T3 length, ZigZag length, Torben length, TDI length, POB length, Delta1, and reversal probability.
Backtesting Metrics: Tracks win rate, profit factor, and total trades within a user-defined date range.
Customizable Settings: Extensive input options for enabling/disabling components, adjusting lengths, and tweaking volatility influence.
How It Works:
The indicator combines multiple signals to generate buy/sell conditions, visualized as upward (▲) or downward (▼) arrows on the chart. Each component (RSI, T3, etc.) can be enabled or disabled via the settings panel, allowing traders to tailor the tool to their strategy. The adaptive lengths adjust dynamically based on market conditions, ensuring relevance across different timeframes and assets. A table in the bottom-left corner provides a snapshot of key metrics, including the newly added Delta1 (volume delta for the first period), enhancing decision-making.
Usage Tips:
Timeframes: Works on any timeframe, but higher timeframes (e.g., 1H, 4H, Daily) may reduce noise.
Assets: Suitable for stocks, forex, cryptocurrencies, and commodities.
Confirmation: Combine with price action or other indicators for stronger signals.
Settings: Adjust RSI overbought/oversold levels (default 70/30) and enable/disable components to match your trading style.
Backtesting: Use the built-in win rate and profit factor metrics to evaluate performance within a custom date range.
Settings:
Main Settings: ATR period (14), RSI length (min 5, max 50, default 14).
Signal Filtering: Enable/disable T3, ZigZag, VolDelta, Torben, TDI, POB, Reversal Probability, and Reversal Zones.
T3 Settings: Adaptive/static length (5–50), volume factor (0.7), volatility influence (0.3).
VolDelta Settings: Adaptive/static length (3–20), volatility influence (0.3).
Torben Settings: Adaptive/static length (5–50), volatility influence (0.3).
Trend Reversal Settings: Adaptive/static length (5–50), SMA periods (5/34).
TDI Settings: Adaptive/static length (3–7), ATR/ADX periods (14), smoothing factor (0.5).
POB Settings: Adaptive/static length (5–50), volatility influence (0.3).
Colors: Customize up/down colors and volatility band display.
Backtest Date Range: Set start/end dates for performance metrics.
Visual Elements:
Plots: T3 line, ZigZag average line, Torben bands, volatility bands, reversal zones.
Shapes: Buy (▲) and sell (▼) signals, T3 crossover markers (🞛).
Boxes: Volume delta-based future trend boxes (drawn on the last bar).
Table: Displays adaptive lengths, Delta1, and reversal probability.
Labels: Optional reversal labels for overbought/oversold conditions.
Intended Audience:
Day traders seeking precise reversal signals.
Swing traders analyzing multi-timeframe trends.
Technical analysts combining multiple indicators.
Beginners learning adaptive indicator mechanics.
Disclaimer:
This indicator is for educational and analytical purposes only. It does not guarantee profits or predict future market movements. Always conduct your own research, use proper risk management, and consider market conditions before trading. The author is not responsible for any financial losses incurred.
Feedback:
I welcome your feedback and suggestions to improve this indicator. Please share your experience in the comments or contact me directly. Happy trading!

Indicators: Traders Dynamic Index, HLCTrends and Trix Ribbon1) Trix Ribbon
===============================================================
This was built on request. Many Stock/FX traders overlay multiple Trix lines to form the ribbon, this indicator makes it easy.
Also, optionally this can plot a BollingerBand on Trix_1.
More info on Trix:
stockcharts.com
2) High/Low/Close Trend Indicator
===============================================================
Simple indicator using EMAs of H/L/C. If blue line is above the red line, the trend is up, else down. Keep an eye on the zero line too.
3) Traders Dynamic Index
===============================================================
This hybrid indicator helps to decipher and monitor market conditions related to trend direction, market strength, and market volatility.
TDI has the following components:
* Green line = RSI Price line
* Red line = Trade Signal line
* Blue lines = Volatility Bands
* Orange line = Market Base Line
Trend Direction - Immediate and Overall:
----------------------------------------------------
* Immediate = Green over Red...price action is moving up.
Red over Green...price action is moving down.
* Overall = Orange line trends up and down generally between the lines 32 & 68. Watch for Orange line to bounces off these lines for market reversal. Trade long when price is above the Orange line, and trade short when price is below.
Market Strength & Volatility - Immediate and Overall:
----------------------------------------------------
* Immediate = Green Line - Strong = Steep slope up or down.
Weak = Moderate to Flat slope.
* Overall = Blue Lines - When expanding, market is strong and trending. When constricting, market is weak and in a range. When the Blue lines are extremely tight in a narrow range, expect an economic announcement or other market condition to spike the market.
Entry conditions:
----------------------------------------------------
* Scalping - Long = Green over Red,
Short = Red over Green
* Active - Long = Green over Red & Orange lines
Short = Red over Green & Orange lines
* Moderate - Long = Green over Red, Orange, & 50 lines
Short= Red over Green, Green below Orange & 50 line
Exit conditions:
----------------------------------------------------
If Green crosses either Blue lines, consider exiting when the Green line crosses back over the Blue line.
* Long = Green crosses below Red
* Short = Green crosses above Red
More info on a complete system using TDI:
www.forexmt4.com

Democratic MultiAsset Strategy [BerlinCode42]Happy Trade,
Intro
Included Trade Concept
Included Indicators and Compare-Functions
Usage and Example
Settings Menu
Declaration for Tradingview House Rules on Script Publishing
Disclaimer
Conclusion
1. Intro
This is the first multi-asset strategy available on TradingView—a market breadth multi-asset trading strategy with integrated webhooks, backtesting capabilities, and essential strategy components like Take Profit, Stop Loss, Trailing, Hedging, Time & Session Filters, and Alerts.
How It Trades? At the start of each new bar, one asset from a set of eight is selected to go long or short. As long there is available cash and the selected asset meets the minimum criteria.
The selection process works through a voting system, similar to a democracy. Each asset is evaluated using up to five indicators that the user can choose. The asset with the highest overall voting score is picked for the trade. If no asset meets all criteria, no trade is executed, and the cash reserve remains untouched for future opportunities.
How to Set Up This Market Breadth Strategy:
Choose eight assets from the same market (e.g., cryptos or big tech stocks).
Select one to five indicators for the voting system.
Refine the strategy by adjusting Take Profit, Stop Loss, Hedging, Trailing, and Filters.
2. Voting as the included Trade Concept
The world of financial trading is filled with both risks and opportunities, and the key challenge is to identify the right opportunities, manage risks, and do both right on time.
There are countless indicators designed to spot opportunities and filter out risks, but no indicator is perfect—they only work statistically, hitting the right signals more often than the wrong ones.
The goal of this strategy is to increase the accuracy of these Indicators by:
Supervising a larger number of assets
Filtering out less promising opportunities
This is achieved through a voting system that compares indicator values across eight different assets. It doesn't just compare long trades—it also evaluates long vs. short positions to identify the most promising trade.
Why focus on one asset class? While you can randomly select assets from different asset classes, doing so prevents the algorithm from identifying the strongest asset within a single class. Think about, within one asset class there is often a major trend whereby different asset classes has not really such behavior.
And, you don’t necessarily need trading in multiple classes—this algorithm is designed to generate profits in both bullish and bearish markets. So when ever an asset class rise or fall the voting system ensure to jump on the strongest asset. So this focusing on one asset class is an integral part of this strategy. This all leads to more stable and robust trading results compared to handling each asset separately.
3. Included Indicators and Compare-Functions
You can choose from 17 different indicators, each offering different types of signals:
Some provide a directional signal
Some offer a simple on/off signal
Some provide both
Available Indicators: RSI, Stochastic RSI, MFI, Price, Volume, Volume Oscillator, Pressure, Bilson Gann Trend, Confluence, TDI, SMA, EMA, WMA, HMA, VWAP, ZLMA, T3MA
However, these indicators alone do not generate trade signals. To do so, they must be compared with thresholds or other indicators using specific comparison functions.
Example – RSI as a Trade Signal. The RSI provides a value between 0 and 100. A common interpretation is:
RSI over 80 → Signal to go short or exit a long trade
RSI under 20 → Signal to go long or exit a short trade
Here, two comparison functions and two thresholds are used to determine trade signals.
Below is the full set of available comparison functions, where: I represents the indicator’s value and A represents the comparator’s value.
I < A if I smaller A then trade signal
I > A if I bigger A then trade signal
I = A if I equal to A then trade signal
I != A if I not equal to A then trade signal
A <> B if I bigger A and I smaller B then trade signal
A >< B if I smaller A then long trade signal or if I bigger B then short trade signal
Image 1
In Image 1, you can see one of five input sections, where you define an indicator along with its function, comparator, and constants. For our RSI example, we select:
Indicator: RSI
Function: >< (greater/less than)
Comparator: Constant
Constants: A = 20, B = 80
With these settings a go short signal is triggered when RSI crosses above 80. And a go long signal is triggered when RSI crosses below 20.
Relative Strength Indicator: The RSI from the public TradingView library provides a directional trade signal. You can adjust the price source and period length in the indicator settings.
Stochastic Relative Strength Indicator: As above the Stoch RSI offers a trade signal with direction. It is calculated out of the RSI, the stochastic derivation and the SMA from the Tradingview library. You can set the in-going price source and the period length for the RSI, for the Stochastic Derivation and for the SMA as blurring in the Indicator settings section.
Money Flow Indicator: As above the MFI from the public Tradingview library offers a trade signal with direction. You can set the in-going price source and the period length in the Indicator settings section.
Price: The Price as Indicator is as simple as it can be. You can chose Open, High, Low or Close or combinations of them like HLC3 or even you can import an external Indicator. The absolute price or value can later be used to generate a trade signals when certain constant thresholds or other indicators signals are crossed.
Volume: Similar as above the Volume as Indicator offers the average volume as absolute value. You can set the period length for the smoothing and you can chose where it is presented in the base currency $ or is the other. For example the trade pair BTCUSD you can chose to present the value in $ or in BTC.
Volume Oscillator: The Volume Oscillator Indicator offers a value in the range of . Whereby a value close to 0 means that the volume is very low. A value around 1 means the volume is same high as before and Values higher as 1 means the volume is bigger then before. You can set the period length for the smoothing and you can chose where it is presented in the base currency $ or is the other. For example the trade pair BTCUSD you can chose to present the value in $ or in BTC.
Pressure Indicator: The Pressure is an adapted version of LazyBear's script (Squeeze Momentum Indicator) Pressure is a Filter that highlight bars before a bigger price move in any direction. The result are integer numbers between 0 and 4 whereby 0 means no bigger price move excepted, while 4 means huge price move expected. You can set the in-going price source and the period length in the Indicator settings section.
Bilson Gann Trend: The Bilson Gann Trend Indicator is a specific re-implementation of the widely known Bilson Gann Count Algorithm to detect Highs and Lows. On base of the last four Highs and Lows a trend direction can be calculated. It is based on 2 rules to confirm a local pivot candidate. When a local pivot candidate is confirmed, let it be a High then it looks for Lows to confirm. The result range is whereby -1 means down trend, 1 means uptrend and 0 sideways.
Confluence: The Confluence Indicator is a simplified version of Dale Legan's "Confluence" indicator written by Gary Fritz. It uses five SMAs with different periods lengths. Whereby the faster SMA get compared with the (slower) SMA with the next higher period lengths. Is the faster SMA smaller then the slower SMA then -1, otherwise +1. This is done with all SMAs and the final sum range between . Whereby values around 0 means price is going side way, Crossing under 0 means trend change from bull to bear. Is the value>2 means a strong bull trend and <-2 a strong bear trend.
Trades Dynamic Index: The TDI is an adapted version from the "Traders Dynamic Index" of LazyBear. The range of the result is whereby 2 means Top goShort, -2 means Bottom goLong, 0 is neutral, 1 is up trend, -1 is down trend.
Simple Moving Average: The SMA is the one from the Tradingview library. You can compare it with the last close price or any other moving average indicator to indicate up and down trends. You can set the in-going price source and the period length in the Indicator settings section.
Exponential Moving Average: The EMA as above is the one from the Tradingview library. You can compare it with the last close price or any other moving average indicator to indicate up and down trends. You can set the in-going price source and the period length in the Indicator settings section.
Weighted Moving Average: The WMA as above is the one from the Tradingview library. You can compare it with the last close price or any other moving average indicator to indicate up and down trends. You can set the in-going price source and the period length in the Indicator settings section.
Hull Moving Average: HMA as above is the one from the Tradingview library. You can compare it with the last close price or any other moving average indicator to indicate up and down trends. You can set the in-going price source and the period length in the Indicator settings section.
Volume Weighted Average Price: The VWAP as above is the one from the Tradingview library. You can compare it with the last close price or any other moving average indicator to indicate up and down trends. You can set the in-going price source in the Indicator settings section.
Zero Lag Moving Average: The ZLMA by John Ehlers and Ric Way describe in their paper: www.mesasoftware.com
As the other moving averages you can compare it with the last close price or any other moving average indicator to indicate up and down trends. You can set the in-going price source and the period length in the Indicator settings section.
T3 Moving Average: The T3MA is the one from the Tradingview library. You can compare it with the last close price or any other moving average indicator to indicate up and down trends. You can set the in-going price source, the period length and a factor in the Indicator settings section. Keep this factor at 1 and the T3MA swing in the same range as the input. Bigger 1 and it swings over. Factors close to 0 and the T3MA becomes a center line.
All MA's following the price. The function to compare any MA Indicators would be < or > to generate a trade direction. An example follows in the next section.
4. Example and Usage
In this section, you see how to set up the strategy using a simple example. This example was intentionally chosen at random and has not undergone any iterations to refine the trade results.
We use the RSI as the trade signal indicator and apply a filter using a combination of two moving averages (MAs). The faster MA is an EMA, while the slower MA is an SMA. By comparing these two MAs, we determine a trend direction. If the faster MA is above the slower MA the trend is upwards etc. This trend direction can then be used for filtering trades.
The strategy follows these rules:
If the RSI is below 20, a buy signal is generated.
If the RSI is above 80, a sell signal is generated.
However, this RSI trade signal is filtered so that a trade is only given the maximum voting weight if the RSI trade direction aligns with the trend direction determined by the MA filter.
So first, you need to add your chosen assets or simply keep the default ones. In Image 2, you can see one of the eight asset input sections.
Image 2
This strategy offers some general trade settings that apply equally to all assets and some asset-specific settings. This distinction is necessary because some assets have higher volatility than others, requiring asset-specific Take Profit and Stop Loss levels.
Once you have made your selections, proceed to the Indicators and Compare Functions for the voting. Image 3 shows an example of this setup.
Image 3
Later on go to the Indicator specific settings shown in Image 4 to refine the trade results.
Image 4
For refine the trade results take also a look on the result summary table, development of capital plot, on the list of closed and open trades and screener table shown in Image 5.
Image 5
To locate any trade for any asset in the chronological and scroll-able trade list, each trade is marked with a label:
An opening label displaying the trade direction, ticker ID, trade number, invested amount, and remaining cash reserves.
A closing label showing the closing reason, ticker ID, trade number, trade profit (%), trade revenue ($), and updated cash reserves.
Additionally: a green line marks each Take Profit level. An orange line indicates the (trailing) Stop Loss.
The summary table in the bottom-left corner provides insights into how effective the trade strategy is. By analyzing the trade list, you can identify trades that should be avoided.
To find those bad trades on the chart, use the trade number or timestamp. With replay mode, you can go back in time to review a specific trade in detail.
Image 6
In Image 6, you can see an example where replay mode and the start time filter are used to display specific trades within a narrow time range. By identifying a large number of bad trades, you may recognize patterns and formulate conditions to avoid them in the future.
This is the backtesting tool that allows you to develop and refine your trading strategy continuously. With each iteration—from general adjustments to detailed optimizations—you can use these tools to improve your strategy. You can:
Add other indicators with trade signals and direction
Add more indicators signals as filter
Adjust the settings of your indicators to optimize results
Configure key strategy settings, such as Time and Session Filters, Stop Loss, Take Profit, and more
By doing so, you can identify a profitable strategy and its optimal settings.
5. Settings Menu
In the settings menu you will find the following high-lighted sections. Most of the settings have a i mark on their right side. Move over it with the cursor to read specific explanation.
Backtest Results: Here you can decide about visibility of the trade list, of the Screener Table and of the Results Summary. And the colors for bullish, side ways, bearish and no signal. Go above and see Image 5.
Time Filter: You can set a Start time or deactivate it by leave it unhooked. The same with End Time and Duration Days . Duration Days can also count from End time in case you deactivate Start time.
Session Filter: Here, you can chose to activate trading on a weekly basis, specifying which days of the week trading is allowed and which are excluded. Additionally, you can configure trading on a daily basis, setting the start and end times for when trades are permitted. If activated, no new trades will be initiated outside the defined times and sessions.
Trade Logic: Here you can set an extra time frame for all indicators. You can enable Longs or Shorts or both trades.
The min Criteria percentage setting defines the minimum number of voices an asset has to get to be traded. So if you set this to 50% or less also weak winners of the voting get traded while 100% means that the winner of the voting has to get all possible voices.
Additionally, you have the option to delay entry signals. This feature is particularly useful when trade signals exhibit noise and require smoothing.
Enable Trailing Stop and force the strategy to trade only at bar closing. Other-ways the strategy trade intrabar, so when ever a voting present an asset to trade, it will send the alert and the webhooks.
The Hedging is basic as shown in the following Image 7 and serves as a catch if price moves fast in the wrong direction. You can activate a hedging mechanism, which opens a trade in the opposite direction if the price moves x% against the entry price. If both the Stop Loss and Hedging are triggered within the same bar, the hedging action will always take precedence.
Image 6
Indicators to use for Trade Signal Generating: Here you chose the Indicators and their Compare Function for the Voting . Any activated asset will get their indicator valuation which get compared over all assets. The asset with the highest valuation is elected for the trade as long free cash is present and as long the minimum criteria are met.
The Screener Table will show all indicators results of the last bar of all assets. Those indicator values which met the threshold get a background color to high light it. Green for bullish, red for bearish and orange for trade signals without direction. If you chose an Indicator here but without any compare function it will show also their results but with just gray background.
Indicator Settings: here you can setup the indicator specific settings. for deeper insights see 3. Included Indicators and Compare-Functions .
Assets, TP & SL Settings: Asset specific settings. Chose here the TickerID of all Assets you wanna trade. Take Profit 1&2 set the target prices of any trade in relation to the entry price. The Take Profit 1 exit a part of the position defined by the quantity value. Stop Loss set the price to step out when a trade goes the wrong direction.
Invest Settings: Here, you can set the initial amount of cash to start with. The Quantity Percentage determines how much of the available cash is allocated to each trade, while the Fee percentage specifies the trading fee applied to both opening and closing positions.
Webhooks: Here, you configure the License ID and the Comment . This is particularly useful if you plan to use multiple instances of the script, ensuring the webhooks target the correct positions. The Take Profit and Stop Loss values are displayed as prices.
6. Declaration for Tradingview House Rules on Script Publishing
The unique feature of this Democratic Multi-Asset Strategy is its ability to trade multiple assets simultaneously. Equipped with a set of different standard Indicators, it's new democratic Voting System does more robust trading decisions compared to single-asset. Interchangeable Indicators and customizable strategy settings allowing for a wide range of trading strategies.
This script is closed-source and invite-only to support and compensate for over a year of development work. Unlike other single asset strategies, this one cannot use TradingView's strategy functions. Instead, it is designed as an indicator.
7. Disclaimer
Trading is risky, and traders do lose money, eventually all. This script is for informational and educational purposes only. All content should be considered hypothetical, selected post-factum and is not to be construed as financial advice. Decisions to buy, sell, hold, or trade in securities, commodities, and other investments involve risk and are best made based on the advice of qualified financial professionals. Past performance does not guarantee future results. Using this script on your own risk. This script may have bugs and I declare don't be responsible for any losses.
8. Conclusion
Now it’s your turn! Chose an asset class and pick 8 of them and chose some indicators to see the trading results of this democratic voting system. Refine your multi-asset strategy to favorable settings. Once you find a promising configuration, you can set up alerts to send webhooks directly. Configure all parameters, test and validate them in paper trading, and if results align with your expectations, you even can deploy this script as your trading bit.
Cheers

Musashi_Fractal_Dimension === Musashi-Fractal-Dimension ===
This tool is part of my research on the fractal nature of the markets and understanding the relation between fractal dimension and chaos theory.
To take full advantage of this indicator, you need to incorporate some principles and concepts:
- Traditional Technical Analysis is linear and Euclidean, which makes very difficult its modeling.
- Linear techniques cannot quantify non-linear behavior
- Is it possible to measure accurately a wave or the surface of a mountain with a simple ruler?
- Fractals quantify what Euclidean Geometry can’t, they measure chaos, as they identify order in apparent randomness.
- Remember: Chaos is order disguised as randomness.
- Chaos is the study of unstable aperiodic behavior in deterministic non-linear dynamic systems
- Order and randomness can coexist, allowing predictability.
- There is a reason why Fractal Dimension was invented, we had no way of measuring fractal-based structures.
- Benoit Mandelbrot used to explain it by asking: How do we measure the coast of Great Britain?
- An easy way of getting the need of a dimension in between is looking at the Koch snowflake.
- Market prices tend to seek natural levels of ranges of balance. These levels can be described as attractors and are determinant.
Fractal Dimension Index ('FDI')
Determines the persistence or anti-persistence of a market.
- A persistent market follows a market trend. An anti-persistent market results in substantial volatility around the trend (with a low r2), and is more vulnerable to price reversals
- An easy way to see this is to think that fractal dimension measures what is in between mainstream dimensions. These are:
- One dimension: a line
- Two dimensions: a square
- Three dimensions: a cube.
--> This will hint you that at certain moment, if the market has a Fractal Dimension of 1.25 (which is low), the market is behaving more “line-like”, while if the market has a high Fractal Dimension, it could be interpreted as “square-like”.
- 'FDI' is trend agnostic, which means that doesn't consider trend. This makes it super useful as gives you clean information about the market without trying to include trend stuff.
Question: If we have a game where you must choose between two options.
1. a horizontal line
2. a vertical line.
Each iteration a Horizontal Line or a Square will appear as continuation of a figure. If it that iteration shows a square and you bet vertical you win, same as if it is horizontal and it is a line.
- Wouldn’t be useful to know that Fractal dimension is 1.8? This will hint square. In the markets you can use 'FD' to filter mean-reversal signals like Bollinger bands, stochastics, Regular RSI divergences, etc.
- Wouldn’t be useful to know that Fractal dimension is 1.2? This will hint Line. In the markets you can use 'FD' to confirm trend following strategies like Moving averages, MACD, Hidden RSI divergences.
Calculation method:
Fractal dimension is obtained from the ‘hurst exponent’.
'FDI' = 2 - 'Hurst Exponent'
Musashi version of the Classic 'OG' Fractal Dimension Index ('FDI')
- By default, you get 3 fast 'FDI's (11,12,13) + 1 Slow 'FDI' (21), their interaction gives useful information.
- Fast 'FDI' cross will give you gray or red dots while Slow 'FDI' cross with the slowest of the fast 'FDI's will give white and orange dots. This are great to early spot trend beginnings or trend ends.
- A baseline (purple) is also provided, this is calculated using a 21 period Bollinger bands with 1.618 'SD', once calculated, you just take midpoint, this is the 'TDI's (Traders Dynamic Index) way. The indicator will print purple dots when Slow 'FDI' and baseline crosses, I see them as Short-Term cycle changes.
- Negative slope 'FDI' means trending asset.
- Positive most of the times hints correction, but if it got overextended it might hint a rocket-shot.
TDI Ranges:
- 'FDI' between 1.0≤ 'FDI' ≤1.4 will confirm trend following continuation signals.
- 'FDI' between 1.6≥ 'FDI' ≥2.0 will confirm reversal signals.
- 'FDI' == 1.5 hints a random unpredictable market.
Fractal Attractors
- As you must know, fractals tend orbit certain spots, this are named Attractors, this happens with any fractal behavior. The market of course also shows them, in form of Support & Resistance, Supply Demand, etc. It’s obvious they are there, but now we understand that they’re not linear, as the market is fractal, so simple trendline might not be the best tool to model this.
- I’ve noticed that when the Musashi version of the 'FDI' indicator start making a cluster of multicolor dots, this end up being an attractor, I tend to draw a rectangle as that area as price tend to come back (I still researching here).
Extra useful stuff
- Momentum / speed: Included by checking RSI Study in the indicator properties. This will add two RSI’s (9 and a 7 periods) plus a baseline calculated same way as explained for 'FDI'. This gives accurate short-term trends. It also includes RSI divergences (regular and hidden), deactivate with a simple check in the RSI section of the properties.
- BBWP (Bollinger Bands with Percentile): Efficient way of visualizing volatility as the percentile of Bollinger bands expansion. This line varies color from Iced blue when low volatility and magma red when high. By default, comes with the High vols deactivated for better view of 'FDI' and RSI while all studies are included. DDWP is trend agnostic, just like 'FDI', which make it very clean at providing information.
- Ultra Slow 'FDI': I noticed that while using BBWP and RSI, the indicator gets overcrowded, so there is the possibility of adding only one 'FDI' + its baseline.
Final Note: I’ve shown you few ways of using this indicator, please backtest before using in real trading. As you know trading is more about risk and trade management than the strategy used. This still a work in progress, I really hope you find value out of it. I use it combination with a tool named “Musashi_Katana” (also found in TradingView).
Best!
Musashi

MFT MACD Trend [by: Bijan Ajdary]This indicator highlights the market trend Base on Macd...
It's also a multi-time frame indicator, which helps traders to make the best decision.
You can send your feedback and comments to my email address: bj.ajdary@gmail.com
@The_Last_Savior
My Other Scripts in TradingView:

KK_Traders Dynamic Index_Bar HighlightingHey guys,
this is one of my favorite scripts as it represents a whole trading system that has given me very good results!
I have only used it on Bitcoin so far but I am sure it will also work for other instruments.
The original code to this was created by LazyBear, so all props to him for this great script!
I have linked his original post down below.
You can find the full rules to the system in this PDF (which has also been taken from LBs post):
www.forexmt4.com
Here is a short summary of the rules:
Go long when (all conditions have to be met):
The green line is above 50
The green line is above the red line
The green line is above the orange line
The close is above the upper Band of the Price Action Channel
The candles close is above its open
(The green line is below 68)
Go short when (all conditions have to be met):
The green line is below 50
The green line is below the red line
The green line is below the orange line
The close is below the lower band of the Price Action Channel
The candles close is below its open
(The green line is above 32)
Close when:
Any of these conditions aren't true anymore.
I have marked two of the rules in brackets as they seem to cut out a lot of the profits this system generates. You can choose to still use these rules by checking the box that says "Use Original Ruleset" in the options.
The system also contains rules regarding the Heiken Ashi bars. However these aren't as specific as the other rules. This is where your personal judgement comes in and this part is hard to explain. Take a look at the PDF I have linked to get a better understanding.
So far, this is just the TDI trading system and LBs script, now what have I changed?
I have incorporated the Price Action Channel to the system and changed it so that it highlights the bars whenever the system is giving a signal. As long as the bars are green the system is giving a long signal, as long as they are red the system is giving a short signal. Keep in mind that this doesn't consider the bar size of the HA bars. I recommend coloring all bars grey via the chart settings in order to be able to see the bar highlighting properly.
I have also published the Price Action Channel seperately in case some of you wish to view the Channel.
I am fairly new to creating scripts so use it with caution and let me know what you think!
LBs original post:
The seperate Price Action Channel script:

Sylwia 9.1 Ultimate – Full MTF + TDI (mobile-flat)Pour tester le script de nombreux réglages dans les options

XAU/USD Scalping Bot [Jake-Style 1500+] FINALDescription:
This advanced scalping bot is engineered for XAU/USD using Jake-style visual overlays with predictive trade triggers, early entry signals, and multi-layer confirmation tools.
Key Features:
• EMA Cloud System with color-coded directional bias (5/13/21/55/144/377)
• PSAR Flip-Only Dots to highlight trend reversal moments without chart clutter
• Bollinger Band Zones to visualize volatility channels
• Predictive Entry Flags for early buy/sell signals before momentum candles (≥2 pip move)
• TRUE Candle Logic for confirmed trend-following entries
• Multi-Level TP/SL Lines with real-time alerts:
• TP1 / TP2 / TP3 with precise trigger logic
• Stop Loss hit detection
• Red Flag Warnings for exit caution during reversal zones (overbought TDI / failed breakouts)
Optimized For:
• 1m / 3m / 5m / 15m / 30m timeframes
• Scalping & intraday trading with high-precision entries
• Traders who prefer visual confirmation before committing to entries
Created by: @Livingstonedan
Powered by: ChatGPT x Jake-style automation logic

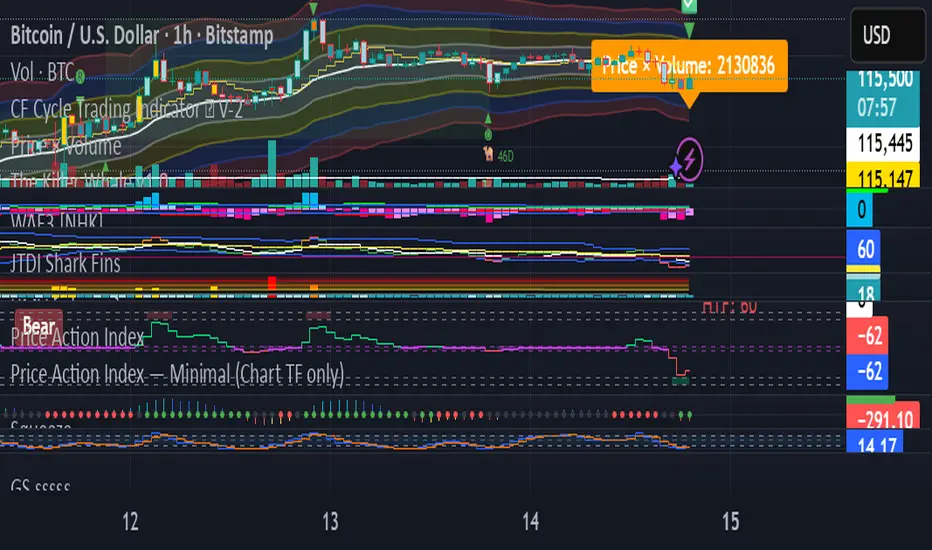
Bitcoin PivotFind [BTC Cycle Tops & Bottoms Finder]What is PivotFind?
PivotFind is a custom indicator designed to track 30+ data points of different nature (technical, sentiment, macro, on-chain), and across multiple timeframes (from 1D to 60D), to detect the market conditions that may indicate the formation of potential Cycle Tops and Bottoms .
PivotFind's goal is to help you navigate Bitcoin's price movements and key happenings over its approximately 4-year cycles to help you craft a mid-term investment plan focused on the larger swings, rather than the shorter-term fluctuations.
What Does PivotFind Show/Do?
Market Phase Assessment and Visualization:
- Uses color-coded backgrounds (green for bull, red for bear, yellow for trend reversal) to show the current (assessed) market phase. Note that the price line itself changes color to reinforce the current phase identification.
- Helps you understand if we're in a uptrend, downtrend, or potentially changing direction (reversal), often an open question for traders, with a mid-term horizon
Cycle Top and Bottom Warnings:
- Places red dots above the price line to warn of potential cycle peaks.
- Shows green dots below the price line to indicate possible cycle bottoms.
These markers appear when multiple indicators reach certain thresholds, which historically have often coincided with significant market pivots (from bull to bear, or viceversa). Clusters of tops and bottom warnings are expected to appear at truly pivotal moments.
Parabolic Growth Signals:
- Displays upward arrows when conditions suggest potential for the rapid price increases that historically anticipated blow-off tops
- These signals are based on a combination of technical indicators and market sentiment reaching certain thresholds.
Altcoin Season Indicators:
- Marks with white diamonds the conditions that have historically led to "altseasons" (i.e. Altcoins overperforming BTC's growth rate).
- Based on factors like Bitcoin dominance decrease and certain altcoin performance metrics.
Fibonacci Retracement Bands:
Plots long-term support and resistance zones based on Fibonacci retracement levels.
These bands are calculated from previous major market highs and lows and shed light on the nature of short-term retracements in the context of major trends.
Price Scenario
PivotFind also provides reference price levels for the upcoming halving cycle, including potential thresholds for increased market interest (retail FOMO), possible overvaluation, and theoretical cycle peak ranges. These projections are based on historical data and should be considered as points of reference rather than definitive predictions.
Comprehensive Data Tables:
Right-side Table: Shows current cycle stage, Bitcoin/Altcoin market dominance percentages, and evaluates key economic factors (like inflation and interest rates) for their potential impact.
Bottom Table: Displays real-time values of over 30 key indicators, including RSI, MVRV ratio, and Fear & Greed Index.
Alerts
PivotFind offers you the ability to set up custom alerts (via the standard TradingView alert functionality) or receive automated notifications for significant market events. Despite its sophisticated analysis, PivotFind is designed to be user-friendly, with pre-set parameters that don't require complex adjustments.
How Does It Work?
PivotFind analyzes over 30 different indicators across multiple timeframes (from 1 day to 60 days), grouped into four main categories:
1. Technical Analysis:
Uses standard indicators like RSI, Stochastic RSI, Williams %R, Elliot Oscillator, TDI, and mean reversion concepts.
Looks for divergences between price and multiple indicators (like OBV, MFI, CCI, RSI, SRSI, MACD and others) to spot potential reversals.
2. Market Sentiment:
Incorporates the Crypto Fear & Greed Index (0-100 scale).
Tracks social media trends and influencer follower counts as a gauge of public interest.
3. Macroeconomic Factors:
Monitors inflation rates, interest rates, US rate yields, and money supply (M2) figures.
Tracks the U.S. Dollar Index (DXY) and bond market health through ETFs like TLT and HYG.
4. On-Chain Analytics:
Analyzes MVRV (Market Value to Realized Value) ratio to spot potential over/undervaluation.
Examines NUPL (Net Unrealized Profit/Loss) and active Bitcoin addresses.
PivotFind analyzes these indicators collectively, looking for significant correlations and confluences, to provide a view of the market's position within the 4-year cycle and spot the conditions for potential Cycle tops and bottoms (cycle pivots).
Who Is This For?
PivotFind may be particularly useful for:
- Long-term investors looking to optimize entry and exit points within the 4-year cycle
- Individuals who want to understand mid-term trends without engaging in daily analysis of multiple charts (due to lack of time and/or financial knowledge)
- Bitcoin Holders and miners planning their decisions around critical market pivot points
It's less suitable for scalpers, day-traders or those focused on short-term price movements.
Value Proposition
PivotFind simplifies market analysis by bringing together a wide range of indicators and data sources across different timeframes. It uses built-in logic to interpret these inputs within the context of Bitcoin's cycles, giving users an efficient way to spot potential major market shifts. This all-in-one approach helps make sense of complex market conditions and supports more informed decision-making.
Since Bitcoin’s broader cycle strongly influences the entire crypto market, PivotFind can also be useful for investors who are focused on Altcoins, not just Bitcoin.
Important Note (Disclaimer)
Past performance, and patterns, do not guarantee future results. Therefore, PivotFind should be used as one of many tools in your analysis. While the indicator provides a multi-faceted and multi-timeframe analysis of factors historically correlated with pivotal price shifts, it cannot predict future prices with certainty. It's a tool to help inform your decisions, not make them for you. Always conduct your own research and remember that all investments, especially in cryptocurrencies, involve risk.
Recommended Settings
PivotFinds works best on the 1D INDEX:BTCUSD chart (dark-mode, logarithmic scale).
This indicator is not publicly available and requires special access.

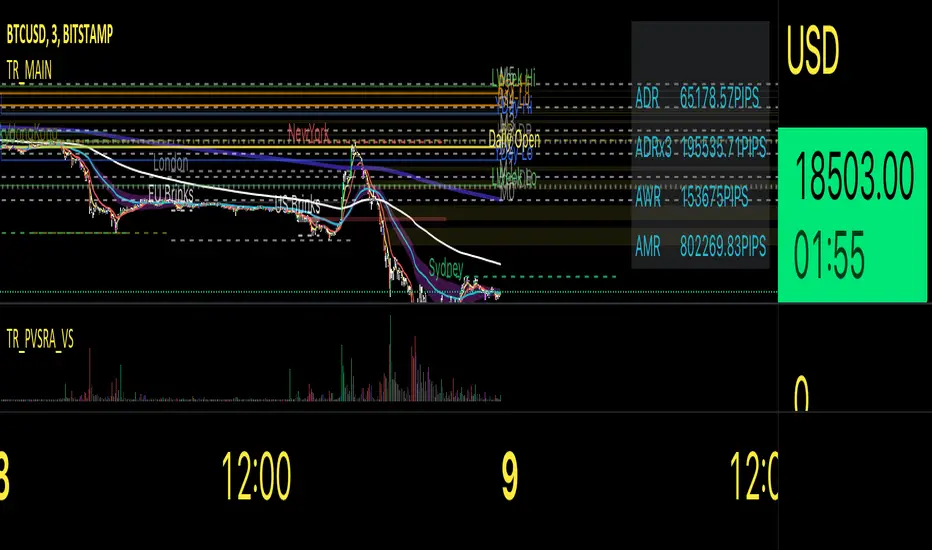
Traders Reality MainThis indicator serves as the Tradingview equivalent of an MT4 indicator suite.
It differentiates from existing TV indicators in its style and total feature set (most notably PVSRA and PVSRA Override)
It was originally designed for forex markets, and it will work for crypto as well, but it has not been tested on stocks.
List of features:
PVSRA Candles
Market boxes (NY/JP/ HK /UK/ FR and Brinks Boxes)
5/13/50/200/800 EMAs (cloud for 50EMA)
Pivot points (S/M/R 1,2,3; PP )
Yesterday and Last Week price range
Average Daily Range (Weekly and Monthly as well)
Daily Open
PVSRA Override
Psychological High/Low
Vector Candle Zones
All of these are configurable in the indicator settings.
Usage instructions:
PVSRA Candle colors meaning:
Green (bull) and red (bear): Candles with volume >= 200% of the average volume of the 10 previous chart candles, and candles where the product of candle spread x candle volume is >= the highest for the 10 previous chart time candles.
Blue (bull) and blue-violet (bear): Candles with volume >= 150% of the average volume of the 10 previous chart candles
PVSRA Override
In order to get reliable bar coloring, we need accurate data. If you're on a chart with low volume on some obscure exchange, you may want to use another exchanges datafeed for the symbol you are on to calculate the PVSRA bar colors with. This lets you do exactly that. By default it's off, but you can turn it on and use INDEX:BTCUSD, or really any other chart you want. You can combine charts too, e.g. use BINANCE:BTCUSDT+COINBASE:BTCUSD.
PVSRA Alerts
Alerts can be made for PVSRA "vector"/"climax" candles:
1. Create Alert (Clock with + sign)
2. Set Condition: "Traders Reality",
3. Select "Alert on Vector Candle",
4. Set it to Once per Bar,
5. choose your notification options.
Market boxes
The market boxes times are configurable and will change depending on the exchange timezone. I recommend to pick your main exchange/chart and adjust the times so that they are correct. Technically you will need to shift the time from the exchanges' timezone to GMT . Default values should be good for UTC based exchanges in current US+UK summer time.
Psychological High/Low
Configurable for Crypto or Forex - draws the perceived Psychological High/Low ranges for the week. Can display historical values too.
Vector Candle Zones
displays unrecovered liquidity left behind on unrecovered vectors. Configurable to take into account candle bodies or candles and wicks.
Recommended additional Tradingview indicator(s):
- TDI - Goldminds, Edited for Market Makers Method by Jakub Donovan
Footnotes
The code was originally by plasmapug, continued development (with permission) is now done by infernix and peshocore and xtech5192 in collaboration with TradersReality.
If you have suggestions or questions, you can message me or leave a comment.
Indicateur C17V2 Not long ago I discovered the TDI(kiss Soxman),
but I needed to know where my market was framed so I started tampering with the open source indicators on TV to make one my way, I'm not not a developer, just a trader homeless.

yuyutsu-banknifty-beta"yuyutsu-banknifty-beta" indicator is a strategy especially made for NSE/BSE Banknifty. Strategy has various sub strategies which can be selected to check back tested accuracy and profit factor. Strategies works best on 3m /15m for intraday. Sub strategy "Swing" can be applied on either nifty and banknifty.
I have also added checkboxes for 3m/15m which implictly selects best combination for desired results.
Below are the sub strategies which user can use and perform back testing.
HMA
Daily Weekly Closing
Daily Monthly Closing
Pivot
Previous day open close
Gap up/down
75m analysis
ORB
Swing
TDI
VMWA
VWAP
Ripster clouds
FxASTLite Strategy[ALLDYN]This strategy can be used on ANY instrument (Forex, Stocks, Cryptocurrency, etc.) AND on ANY TF (Time Frame). The purpose of me sharing this is to show people the power of using a Fibonacci-based trading system combined with Institutional market looks and how associated price action reacts and responds at these levels within the market. This is nothing new with the work that Charles Dow did with the Dow Theory and what Ralph Nelson Elliott expanded upon with the Elliott Wave principle. It is about synergism and simplicity with what works. There is no "holy grail" in trading except the one between your ears. This is just a tool to give you a confirmation with multiple built-in confluences that can be tied with an oscillator for additional confluence.
It is helpful to know Supply & Demand Zones as well as candlestick patterns and where these reversal patterns happen within the market. They are more meaningful if they happen within Supply & Demand Zones. The 4 candlestick patterns I look for in Supply & Demand Zones are Hammer/Hanging Man (Pinbar), Engulfing Candle Pattern (blended lines), Dark Cloud Cover/Piercing Candle Pattern (blended lines), and Tweezer Tops/Bottoms.
I through The Ichimoku Cloud on top of this so you can see the transitions as the market moves in its fractal nature. I use the MACD, TDI, and RSI for confirmation of what associated price action is doing on the chart. I say associated price action because nothing happens without volume. There are some built-in Volume tools in TV that give some good insight into what is happening (overall volume - VPVR, at price - session volume, & overtime - vol. )
***PURPOSE of the RIBBON***:
-The Ribbon allows you to get in at the START/BEGINNING of a Correction/Trend Change (Associated price action should always be the ENTRY condition).
-If the associated price action stays above the Ribbon, then this allows you to stay in the BUY trade longer.
*Note - Exit of the BUY trade would be if associated price action BELOW the Ribbon.
-If associated price actions stay below the Ribbon, this allows you to stay in the SELL trade longer (Associated price action should always be the ENTRY condition).
*Note - Exit of the SELL trade would be if associated price action closed ABOVE the Ribbon.
***PURPOSE of the Oracle (Solid purple line)***
-The Oracle will act as Trend confirmation and associated price action target as the Trend is TRANSITIONING
***SYSTEM FEATURES***
-Inputs (Style, Visibility = NA):
You are able to toggle ALLDYN FxASTLite from the chart.
You are able to toggle PSARs from the chart.
You are able to toggle background (Affects White/Black line)
If you suffer from any type of Color Blindness you can select different options to help.
*****DISCLAIMER*****
I am not a financial advisor or commodity trade advisor. This "TOOL" is for EDUCATIONAL PURPOSES ONLY. Any use of this financial educational tool in ANY demo/live market you do so at your own RISKS. Trading in leveraged financial markets has inherent RISKS associated with such actions. Do Not Trade Money YOU Can't Afford to LOSE.
Legacy Scalper - Trend Trading SystemLegacy Scalper Trend Trading System
Welcome to the Legacy Scalper
This indicator is based on a trend trading strategy using multiple EMA's, with an added colored algo to help traders enter orders while simultaneously reducing noise in the markets by changing candlesticks to one solid color dependant upon direction of price.
This indicator capitalizes on short term momentum while ensuring that you are trading with the trend using the commonly known fact of EMA's being above or below price to ensure the trend.
The customization and plotting of different length EMA's allows for freedom to design your own system within the realm of the indicators, or use the recommended strategies below.
////////
The Legacy Scalper plots 3 main EMA's listed as following:
-50 EMA
-200 EMA
-800 EMA
Additionaly there is an algo coded into the mix that allows for:
- Tradingview alarms for buys and sells
- change of period (frequency) for buys and sells
- color selection of the moving average
- change all candlestick color dependant upon buy and sell alerts.
////////
The Strategies (Or Create Your Own)
Basic
Sell only when you get an alert above the 50 EMA (Only 50 EMA plotted on screen)
Buy only when you get an alert with the 50 EMA below price (Only 50 EMA plotted on screen)
Sell Example:
Intermediate
Sell only when 50EMA is below the 200EMA and you get a sell alert
Buy only when the 50 EMA is above the 200EMA and you get a buy Alert
Buy Example:
Advanced
Sell only when you get a sell alert with all EMA's above price
Buy only when you get a buy alert with all EMA's below price
Example:
Legacy Mode
Backtesting is highly recommended
Remove EMA's and plot a high period MA and take alerts both ways to capitalize on longer moves
And/Or
Add Ema's for swing trading with a higher plot MA
Example:
NOTES:
This is designed to work on all time frames
This is designed to work on all financial instruments
Feel free to backtest which period setting is best, however visually glancing at most charts the default setting appears the best across all instruments.
Feel free to add in other indicators for additional confirmation such as an RSI, TDI, Stoch, or WAE
DISCLAIMER
THIS IS NOT FINANCIAL OR INVESTMENT ADVICE AND SHOULD NOT BE INTERPRETED AS SUCH.
Trading foreign exchange on margin carries a high level of risk, and may not be suitable for all investors. Past performance is not indicative of future results. The high degree of leverage can work against you as well as for you. Before deciding to invest in foreign exchange you should carefully consider your investment objectives, level of experience, and risk appetite. The possibility exists that you could sustain a loss of some or all of your initial investment and therefore you should not invest money that you cannot afford to lose. You should be aware of all the risks associated with foreign exchange trading, and seek advice from an independent financial advisor if you have any doubts.

EBB & Flow: a multi-EMA-based BB cloudIntro
This is an idea evolved out of the market maker method and EMA convergence, divergence, and mean reversion.
The market maker method informs us that the 5, 13, 50 and 200 EMAs are important to regulating price. Those EMA lengths are multiples of the 50 and 200 on lower major timeframes -- the 1 minute, 5, 15, 1H, 4H, 1D. I include the 21 because it is also a multiple and in crypto very often respected.
When market makers are testing price, they set their range and spike in the direction they test for liquidity. This can get chaotic. For instance, in a shorter time frame consolidation inside a bigger timeframe uptrend, it can be too easy to forget where you are in the many trends playing out.
When the EMAs are dragged over each other during normal price movement, you get these crisscrossing tracks of price, and the individual breaks can be hard to trace.
The range is what matters, ultimately, and the range is dynamic. In that case, the Bollinger Band is a great tool for detecting outliers in this case.
The Answer
So the answer this indicator seeks to give, is to look for outliers. This gives you a scalping strategy built on Traders Reality thinking and best put together with the PVSRA indicator, which I may include in this indicator just for the sake of concision, but they can work alongside each other or separately.
The key thing is the different EMA clouds, which are bollinger bands. Tight bands mean imminent breaks, favouring the trend. Vector candles out of a zone, pins to the low/high, etc. are all very relevant alongside this indicator.
You can also use it on its own and scalp the breaks of a cloud.
How it works
Each cloud is a standard deviation from their respective EMA, all in the same colour. The deviation multiple is 1.618 by default. Yes, fibonacci sequences are usually nonsense, but it works better with the BB than 2, 2.5 or 3.
Using just the clouds, you can see where each EMA is headed and how it behaves within the deviation of the others.
But that on its own isn't enough.
The indicator will also print snowflakes above and below the candle for notable outliers. It will be in the colour of the cloud it breaks, but only if that break is also breaking the smaller EMA clouds too.
The most snowflakes will be yellow because that's the 13 EMA. That one is dependent on nothing else and every break will print a snowflake. The 21 will be dependent on the 13. The 50 dependent on the 13 and 21 breaks. The 200 the most important.
For example, if the 200 EMA-BB or EBB is broken at the upper band, deviating by more than 162% of price over a 200 period EMA, and that break is not above the 50 EMA cloud, there will be no snowflake. However, if it exceeds the 13, 21, 50, and 200 clouds, then a purple snowflake will appear above the bar.
Any snowflake is an extreme in price. The purple is an especially good point of entry. That doesn't mean it is a perfect entry. You can build position from it, though, and be relatively certain of a price correction in the near future, because not only was this major EMA cloud violated, but all of the smaller ones too.
Reminder
You still need your PVSRA and candlesticks. This indicator on its own may have a nice hit rate for scalping and building position, as an alternative to the TDI or alongside it, but it is not enough on its own, just like the TDI.
Enjoy!

ASFX ADR,Daily HiLo,PivotsASFX Average Daily Range + Yesterday High/Low + Pivot Points
For those with basic Tradingview account this is useful to have along with the EMA /AR and TDI . this way you are equipped with all the necessary indicators to study your charts before trading.
How I use this:
=============
I don't leave this on at all times, only toggle on to check the significant levels and mark anything relevant in the way of my trade and toggle off.

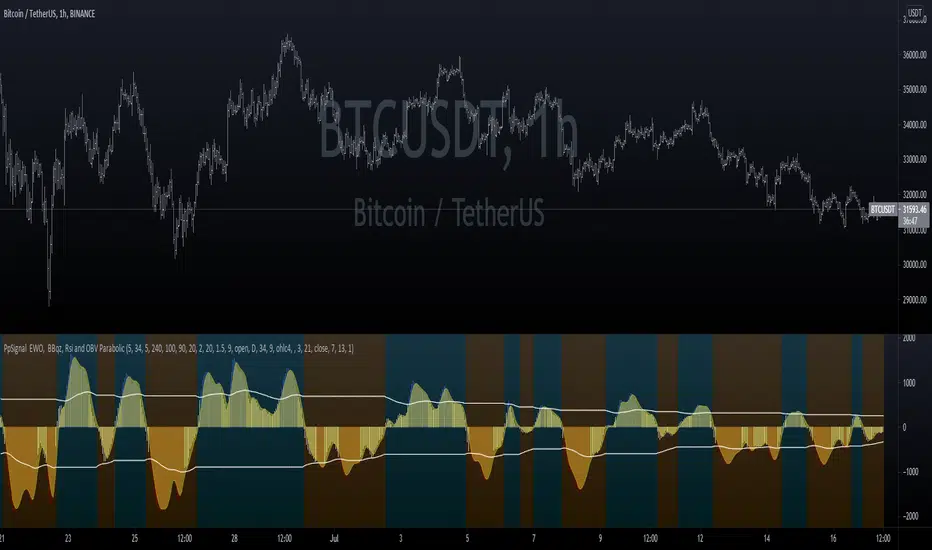
PpSignal EWO, BBqz, Rsi and OBV ParabolicEWO Break Band, bbsqeeze, rsi tdi and OBV of rsi all in one.
Buy when the oscillator change a color blue and sell when the oscillator changes color to red.
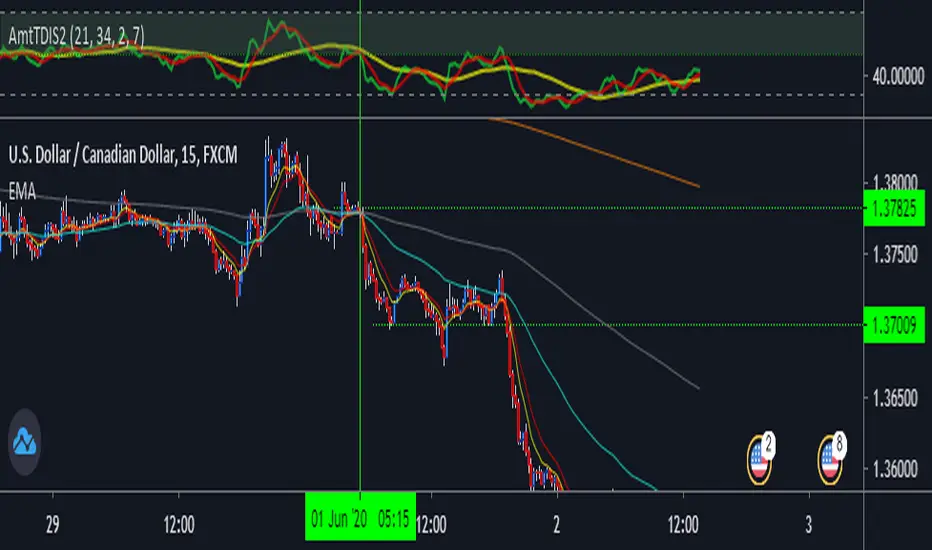
Amt TDI S2 Pattern Yellow line-Liquid 50
Green Line-RSI
Red Line-Trend line
You can use it best on 15 min & 5min chart specially for intraday.
Buy Conditions-
: When yellow line is above green zone or 50.
:Green & Red line should cross or above yellow line. Green line should be above redline.
Sell Conditions-
: When yellow line is below green zone or 50.
:Green & Red line should cross or below yellow line. Green line should be below redline.
For better accuracy use it with EMA's.
NOTE- Dont use this strategy when market is sideways or very much volatile.