[BACKTEST]Traders Dynamic Index Indicator Alert by JustUncleLBy request, this script is a "strategy" version of my "Traders Dynamic Index Indicator Alert" script, made available for backtesting to help find optimal trade settings for a particular asset.
Cari dalam skrip untuk "alert"

SSL Channel w/alertSSL Channel with cross alert when channels cross up or down. Built on ErwinBeckers SSL Channel script.
Efficient Trend Step ModThis is my mod of a wonderful script by alexgrover. See his comprehensive description of the logic behind the script at his page at
Added are labels, alerts and selection of periods among (mainly;)) fibo numbers.


BTC 1D Alerts V1This script contains a variety of key indicator for bitcoin all-in-one and they can be activated individually in the menu. These are meant to be used on the 1D chart for Bitcoin.
1457 Day Moving Average: the bottom of the bitcoin price and arguably the rock bottom price target.
Ichimoku Cloud: a common useful indicator for bitcoin support and resistance.
350ma fibs (21 8 5 3 2 and 1.6) : Signify the tops of each logarthmic rise in bitcoin price. They are generally curving higher over the long term. For halvening #3, the predicted market crash would be after hitting the 350ma x3 fib. Also the 350 ma / 111 ma cross signifies bull market top within about 3 days as well. Using the combination of the 350ma fibs and the 350/111 crosses, reasonably identify when market top is about to occur.
50,120,200 ma: Common moving averages that bitcoin retests during bull market runs. Also, the 50/200 golden and death crosses.
1D EMA Superguppy Ribbons: green = bull market, gray is indeterminate, red = bear market. Very high specificity indicator of bull runs, especially for bitcoin. You can change to 3D candle for even more specificity for a bull market start. Use the 1W for even more specificity. 1D Superguppy is recommended for decisionmaking.
1W EMA21: a very good moving average programmed to be shown on both the daily and weekly candle time. Bitcoin commonly corrects to this repeatedly during past bull runs. Acts as support during bull run and resistance during a bear market.
Steps to identifying a bull market:
1. 50/200 golden cross
2. 1D EMA superguppy green
3. 3D EMA superguppy green (if you prefer more certainty than step 2).
4. Hitting the 1W EMA21 and bouncing off during the bull run signifies corrections.
Once a bull market is identified,
Additional recommended buying and selling techniques:
Indicators:
- Fiblines - to determine retracements from peaks (such as all time high or recent highs)
- Stochastic RSI - 1d, 3d, and 1W SRSI are great time to buy, especially the 1W SRSI which comes much less frequently.
- volumen consolidado - for multi exchange volumes compiled into a single line. I prefer buying on the lowest volume days which generally coincide with dips.
- MACD - somewhat dubious utility but many algorithms are programmed to buy or sell based on this.
Check out the Alerts for golden crosses and 350ma Fib crosses which are invaluable for long term buying planning.
I left this open source so that all the formulas can be understood and verified. Much of it hacked together from other sources but all indicators that are fundamental to bitcoin. I apologize in advance for not attributing all the articles and references... but then again I am making no money off of this anyway.


Adaptive Trailing StopIntroduction
The ability to adapt to possible markets states is important in technical analysis, this is why making adaptive indicator might help get better results. I propose a trailing stop indicator using recursion that can adapt to the efficiency ratio. I have added alerts since it's a often requested feature.
The Indicator
Its quite classical, bands are firstly made then a trailing stop is built around them. The bands are recursive, this allow for faster calculations in general but it also allow for a faster adaptivity. An higher length or factor will make the indicator detect longer term trends, factor determine the raising power of the efficiency ratio.
When smooth is checked the trailing stop will appear smoother.
When adaptive is unchecked the indicator will still act as a trailing stop but might be more affected to ranging markets.
Set a static/trailing stop loss :
You can set your stop loss based on the indicator, a static stop loss can be set at the value of the trailing stop when you enter the market. You can also set it as trailing stop, the indicator will follow the trend thus allowing for potential profits to grow's.
Determine The Trend Direction :
You can generate buy sell signals based on the indicator position relative to the price, when the indicator is lower than the price this indicate a up trending market, when the indicator is higher than the price this indicate a down trending market. If the trailing stop move this indicate a strong current trend.
False signals with trailing stops can happen, the price might go toward the trailing stop making it generate another signal, when market is ranging and exhibiting cyclical behaviour this can affect the indicator and the user might get stuck in a series of false signals, higher length/factor values can fix that at the cost of less early signals.
Identification Of Support And Resistance
Bands during low volatility/ranging markets can return potential reversal points when crossing with the price. The indicator can also do it, even if high/low crosses are better suited to determine support and resistance levels when using a trailing stop. You can use support/resistance identification in conjonction of the current trend detected by the indicator.
Conclusion
The indicator is fully operational in fixed mode while having potential down points in adaptive mode. As you can see the code that return the bands is fully recursive and might provide a great way to create adaptive bands in the future.
I have been asked to give more detail about the indicator uses rather than the construction, i hope the showcased uses are convenient.
Note that the showcased uses can be applied to any trailing stop.
Thanks for reading.

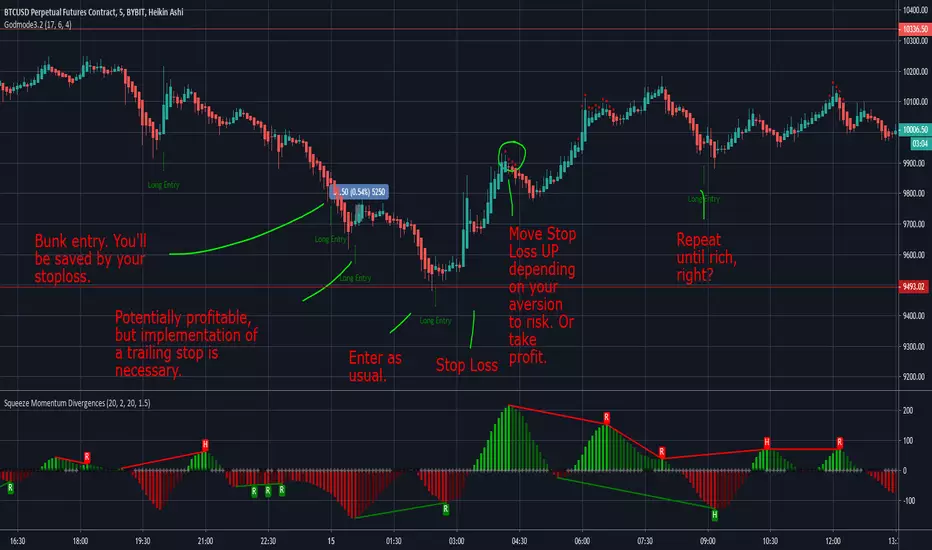
Godmode3.2 - Long Signals (with alerts)Building upon an indicator that I really like, I decided to add alerts and plot shapes for extra certainty. Credits to all the programmers who actually did all the heavy lifting on the calculations - I just added easy stuff (and what I think are good conditions for going long).
Tenkan Kijun Cross AlertTenkan Kijun cross alert, best used alongside a Volume indicator to help aid with finding those trend continuation patterns.
I prefer to use the Chaikin Money Flow, when it indicates and holds above the 0 line then you will bias Longs, and when below then you will Bias shorts
If you like this then please donate
BTC: 1LRbUgrkvFLQ5Mt7C62EJRD9aMvhDNT22K
ETH: 0xa509b89bccb788234278eFE63470c10946E26F3c
LTC: LV7MUr6arvCffS5N6pbTWgav5S3Yi1Eejp

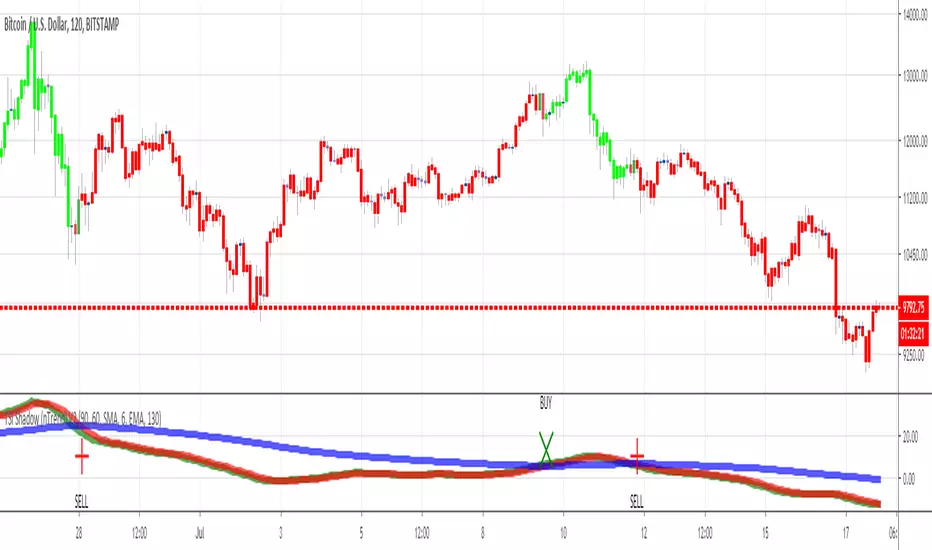
TSI Shadow (with custom candle coloring)Hello traders
This indicator is based on my TSI shadow previously published
This custom version will also color the candles based on the TSI shadow trend
Bullish condition = TSI > MA2 and MA1> MA2
Bearish condition = TSI < MA1 and MA1 < MA2
I made alerts available for this indicator so you can set them on your account
Enjoy
Dave
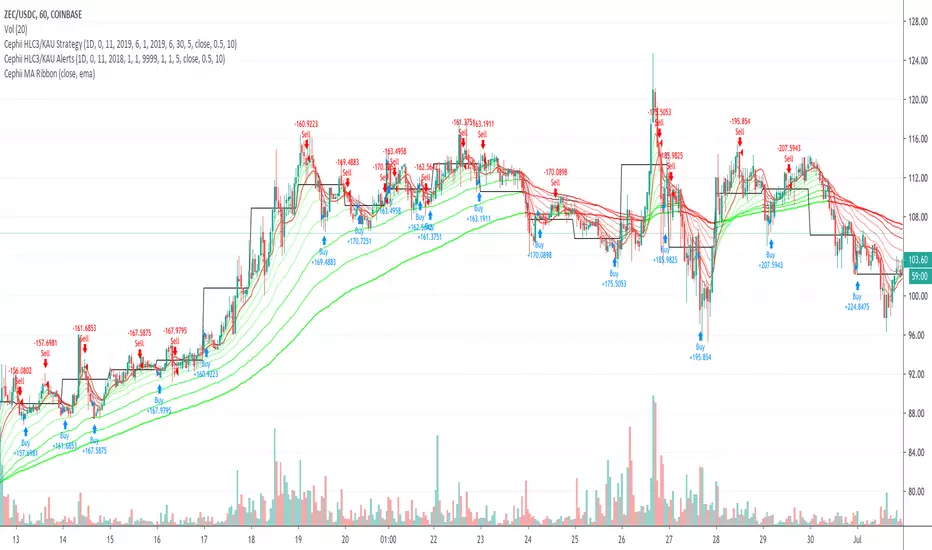
HLC3/Kaufman Alerts (Cephii Edit)The alerts component to be used after using the strategy version by the same name. Modified from Marco.
WaveTrend + Alert + LSMA + CrossWaveTrend inspired by LazyBear's WT indicator with addition of crossing dots, crossing alert and LSMA
SW Support / Resistance System plus EMA cross alerts//=====================================================================
//SW Support / Resistance System plus EMA cross alerts
//(Some parts belong to ChrisMoody)
// June 23rd, 2019
//=====================================================================

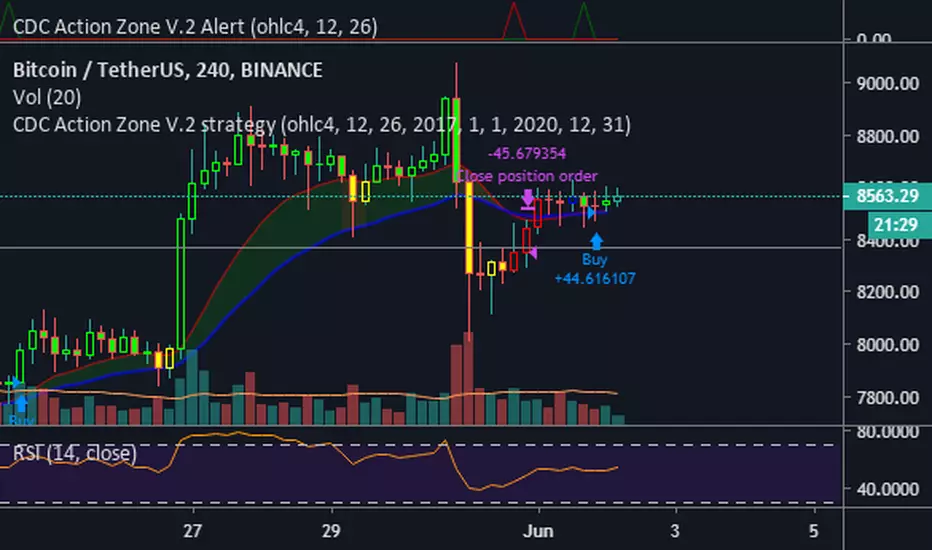
CDC Action Zone V.2 Alertวิธีใช้ให้ตั้งค่า ดังนี้
Condition = CDC Action Zone V.2 Alert
= Short หรือ Long (ขาย หรือ ซื้อ)
= Crossing Down
= Value
= 0.9
หมายเหตุ : ที่ต้องเลือก Crossing Down เพื่อให้มีการยืนยันแท่งเขียวแรกก่อน ซึ่งจะตรงกับ strategy ด้วย
Strategy Ref:
RSI MFI with alertsModified from the various scripts I've found on TradingView. This scripts adds alerts for oversold overbought conditions. It also has the ability to add in another RSI at a different time interval.
I've also added an MFI with bollinger bands to the chart to preceed the RSI. This can sometimes tell you the direction the RSI is moving. usually when it is out of the bollinger bands on the MFI the price/RSI tends to slow.

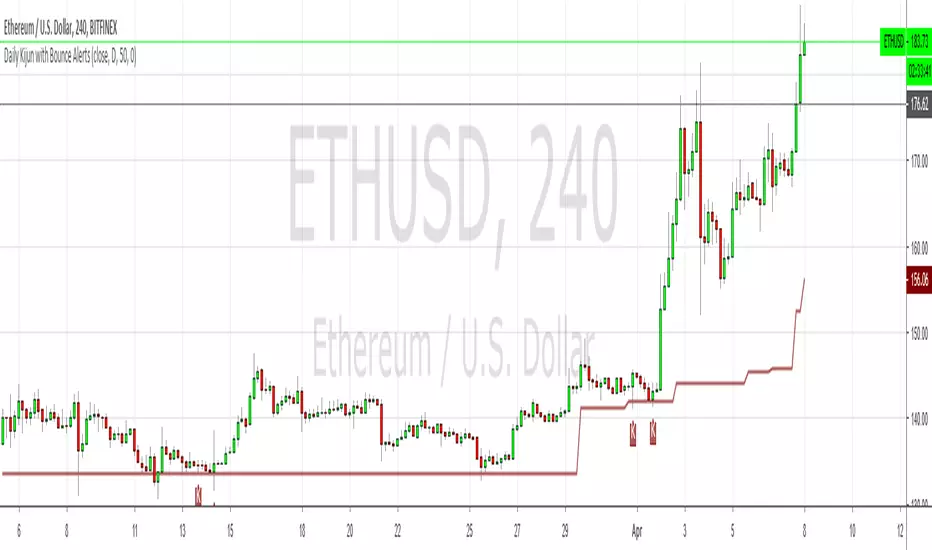
Daily Kijun with Bounce AlertsShows the daily Kijun on all timeframes using a period of 50, which makes it into a dynamic 50% fib of sorts, especially when it's flat. Also shows Kijun bounces labeled with Ks, and allows you to set alerts for bullish, bearish or bi-directional bounces.
It doesn't show any of the other Ichimoku components.
Heikin Ashi Candle Colour Change AlertsThis script allows you to set alerts for Heikin Ashi up and down candles. For example, you may wish to exit a trade when the first down candle is printed after a sequence of up candles.

MACD Enhanced System MTF with optional TSL and Alerts [LTB]This script is developed to analyse MACD, MACD Signal, MACD Histogram movements by using current and higher time frame. Script calculates higher time frame automatically, no manuel entry. there is trailing stop loss line that is optional.
You can change the parameters as you wish.
btw. you should know that MACD is more successful when there is a trend.
I already shared this as a strategy script. Some ppl wanted to see the code.
You might want to see strategy test =>
by LonesomeTheBlue

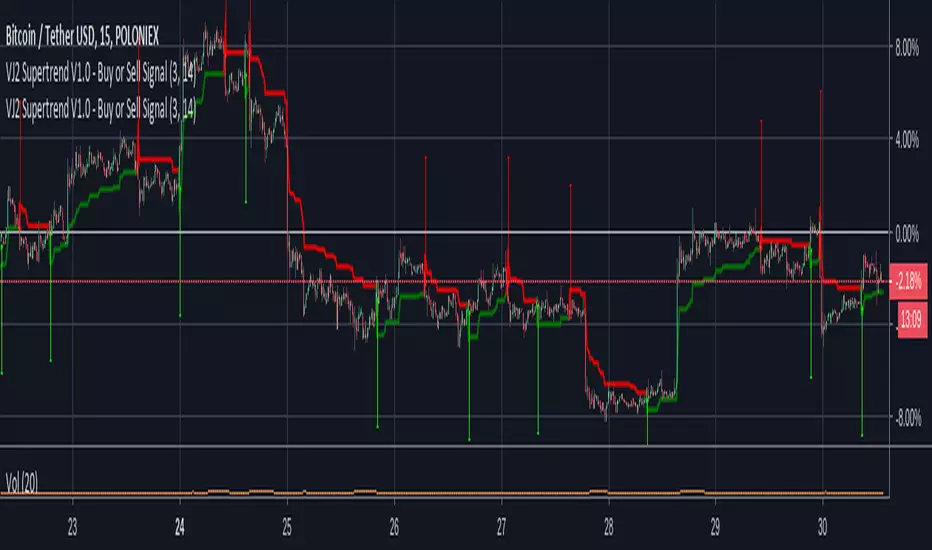
VJ2 Supertrend V1.0 - Buy or Sell Signal with alert supertrend indicator added alert on short and long