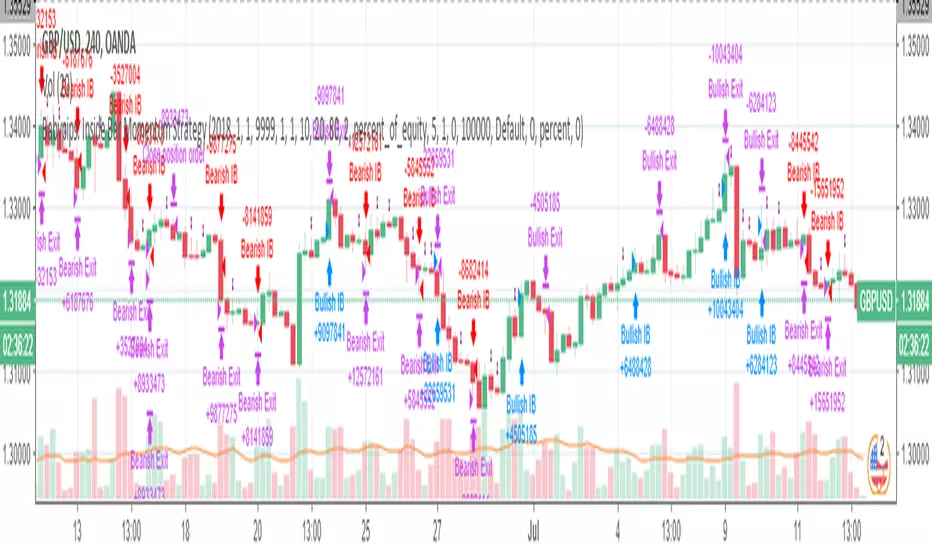
Babypips: Inside Bar Momentum StrategyThe strategy contained in this post comes courtesy of babypips (.com), an excellent resource for all thing forex related. If you are new to trading, the site is definitely worth checking out!
Code commentary and an introduction to Inside Bars are available for this post on the Backtest-Rookies (.com) website.
Note: If you are interested in custom development services, please check out our services page on the Backtest-Rookies site.
Strategy Overview
Inside Bar Momentum Strategy.
Inside Bar Detection
Position sizing based on stoploss distance ( Note: Based on equity and assumes that the account currency is the counter currency.
Stop buys for entries
Takeprofit / Stoplosses for exits
Control Stopbuy, Takeprofit and Stoploss targets with inputs
Control Backtest start/end dates
Cari dalam skrip untuk "backtest"
Hucklekiwi Pip - HLHB Trend-Catcher SystemThe strategy was authored by Hucklekiwi Pip back in 2015 and is still being updated today. She says that the system was designed to simply catch short-term forex trends. At its heart, the system is a simple EMA crossover strategy with a couple of other indicators used for confirming entries.
Strategy Rules
See her original post here:
www.babypips.com
Be sure to check out the updates and tweaks over the years!
HOW TO USE
For full information on how to use this strategy and how to correctly set the exit time, see this post:
backtest-rookies.com

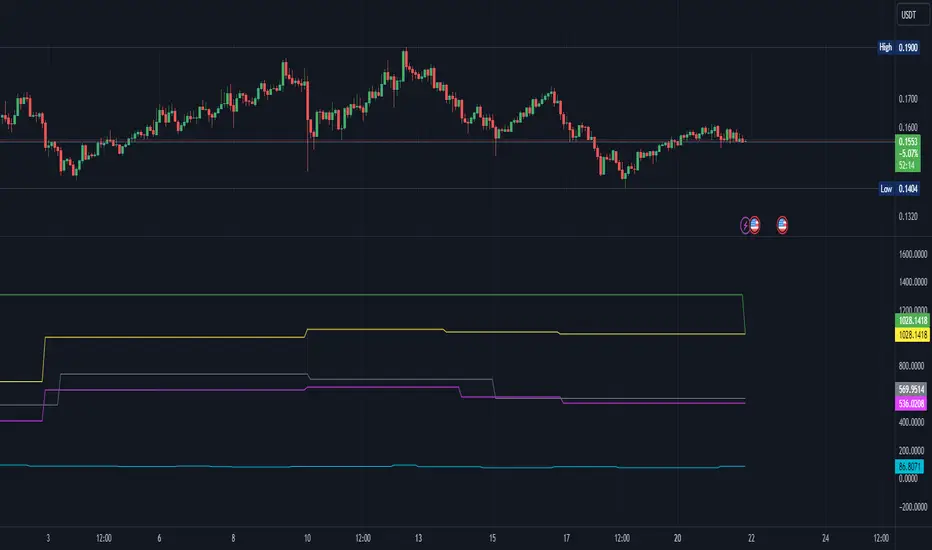
Synergy StatsSynergy Stats
This indicator is intended to complement the Synergy indicator. It provides the following statistics:
A percentage showing how often the two assets move in the opposite direction over a given lookback period.
Similarly, another percentage showing how often the two assets move in the same direction over the same lookback period.
Count the number of times (occurrences) when the two assets move in the same direction for more than 4 bars.
Count the number of times the alternative asset moves more than x%
Count the number of times that chart asset moved in the same direction of the alternative asset when the alternative asset moved more than x%
Both indicators were developed for use in an investigation/tutorial using Pine Script to analyse Gold and US Dollar Index correlation.
The full free post can be found here: backtest-rookies.com

SynergySynergy
This indicator was developed for use in an investigation/tutorial using Pine Script to analyse Gold and US Dollar Index correlation.
The first indicator shall measure the percentage change between the open and close of each bar and compare it to the same percentage change of an alternative asset. Additionally, we shall color the background when the two assets move in the same direction. This should allow us to more easily see when the two assets move together and spot trends in their moment.
The yellow bars show use the percentage change in the price of gold. The blue bars show the percentage change in the price of the US Dollar index. If the bar is above zero, it means that the asset closed up. Conversely, if it is below zero, it means the asset closed down. Finally, the grey bars show bars in which the two assets closed in the same direction.
It can be used in conjunction with a second indicator (to be published soon) that provides statistics generated from this indicator.
The full free post can be found here: backtest-rookies.com

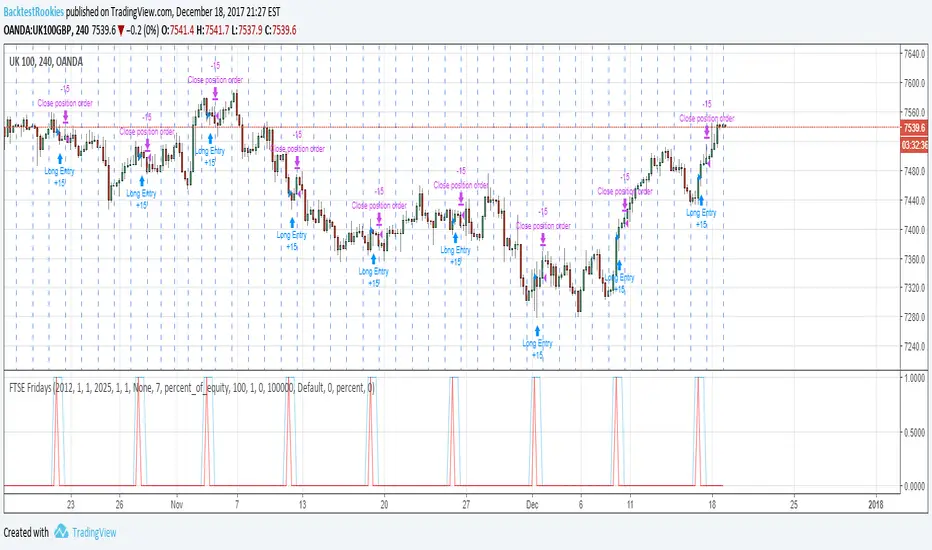
FTSE FridaysThis code snippet below is a quick and dirty follow up to some statistical analysis performed on the FTSE 100. It showed that over the long run, (since 1995) going long on a Friday appeared to have a statistical edge (53%). As a bit of fun, I wanted to create a quick pine script backtest to test this and see if it is possible to profit from it. After all, the index might finish up 53% of the time, but that doesn't mean one can profit from it.
A full commentary to the script and FTSE analysis post can be found on the Backtest-Rookies website. To comply with house rules, I cannot post a direct link here.
Important Note
The script must run on the 4H time frame…..Why? It is a quick and dirty implementation and it relies on entering a long position on the 4H bar before the market opens. This way the position will enter at the open of the market. (Since positions are always opening on the bar following an entry signal).
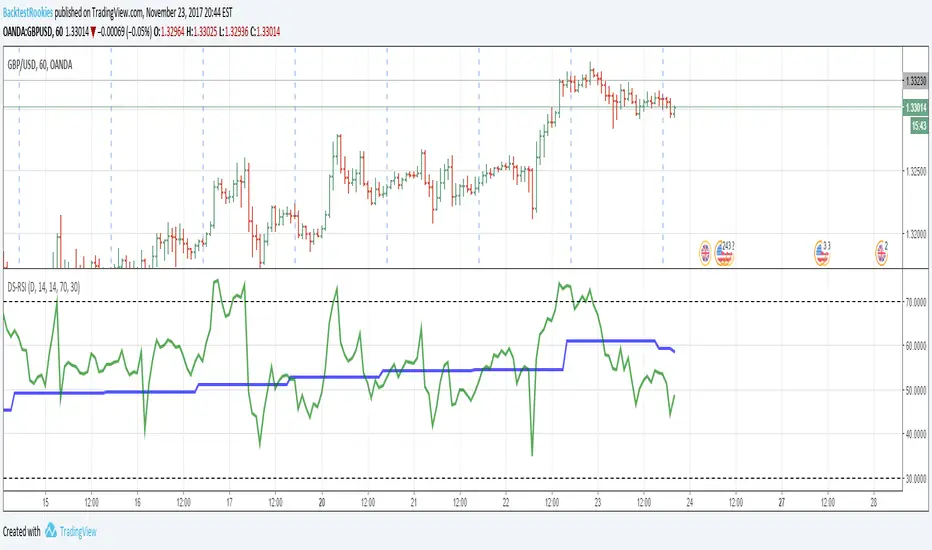
Dual Strength RSIDual Strength RSI Indicator
Republished: The original script violated house rules by including an external link to Backtest Rookies.
Background
This is a simple indicator was designed as part of a tutorial on the Backtest-Rookies website.
Logic
The indicator will plot RSI values from 2 timeframes. The first plotted line will be the current timeframe and the second line will be a user selected timeframe. The theory is that if the instrument is overbought / oversold on two timeframes at the same time, it might be more likely to reverse or revert to the mean.
As with most oscillating indicators, this will likely be most suitable for ranging market conditions.
Examples
Automatic TrendlinesIntroduction
For a full free tutorial explaining this code in more detail, visit the backtest-rookies (.com) website.
This indicator will plot two trend lines at any given time. A resistance trend line and a support trend line. The resistance trend is shown with red circles and is created by joining swing highs together. The second is a support trend which is created by joining swing lows.
Since we need swings to make the trend, the trend line code contains code for the swing detection. You can play around with the swing detection to alter how frequently new trend lines are detected. Relying on swings also means that there will be some delay in trend detection depending on how you configure the swing detection. The higher you set rightbars, the more lag you will have before a trend is detected. However, at the same time the quality of the pivots found will increase. So it is a trade-off you need to come to terms with and decide what the best settings are for you.
Lines
A single trend line is made up of several components.
Pivot Points: Marked as blue or orange circles. There will be two pivots per trend.
Orange/Purple Lines: Connecting all pivot points. You will see these lines change direction slightly each time a new pivot is detected (new circles appear).
Green/Red Circle lines: Showing the trend line from the earliest moment a new trend is detected.
Blue Dashed lines: Joining the purple and green/red circle lines so the full trend line can be seen.
Note: The blue dashed lines use pine-scripts drawing functions. As such, there is a limit to how many of these can be placed on a chart. When the limit is reached, the oldest line will be removed so the newest can be drawn. This means that if you detect enough trends and scroll back in time, the blue dashed lines will disappear at some point!

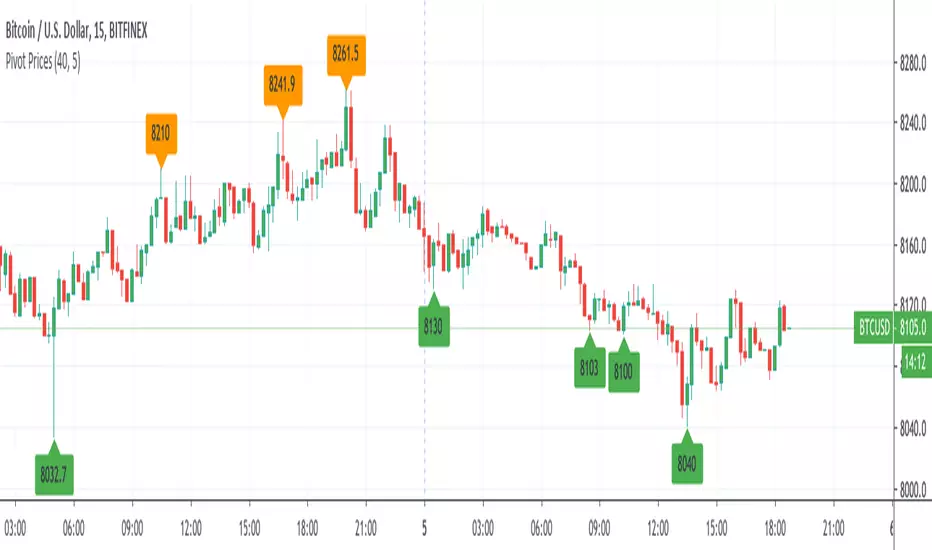
Pivot Prices - ExampleA simple example script showing how to use label.new() to plot pivot prices on the chart.
A full tutorial and commentary is available on the backtest-rookies website.
Volume Profile: Intra-bar VolumeThis indicator was developed as part of a free blog post tutorial on the Backtest-Rookies website for detailed code commentary, head over there.
Scope
The indicator shall attempt to do the following:
Look at a lower time-frame. E.g 5 minutes when on a 1-hour chart.
Create a function to loop through through candles and make an assessment.
If the candle it closed up, the volume will be categorized as buying volume. Conversely, if it closed down, the volume will be categorized as selling volume
The function will then be passed to the security() function to run on a lower timeframe.
All buying volume and selling volume from the lower time-frame shall be summed and displayed on the main chart.
Important Note
This indicator will not give you genuine buying or selling volume. It simply follows the assumption that if price closed up, there must have been more buyers than sellers and if it closed down we assume the opposite.
Usage
In order to use this indicator, users will need to calculate how many lower time-frame bars are contained in the time-frame on the main chart. So for example, the default settings are configured for the indicator to be run on the 1H chart. As a result, we need to set the "Bars on Lower Timeframe" input to 12. This is because there are 12 x 5-minute bars in 60 minutes.

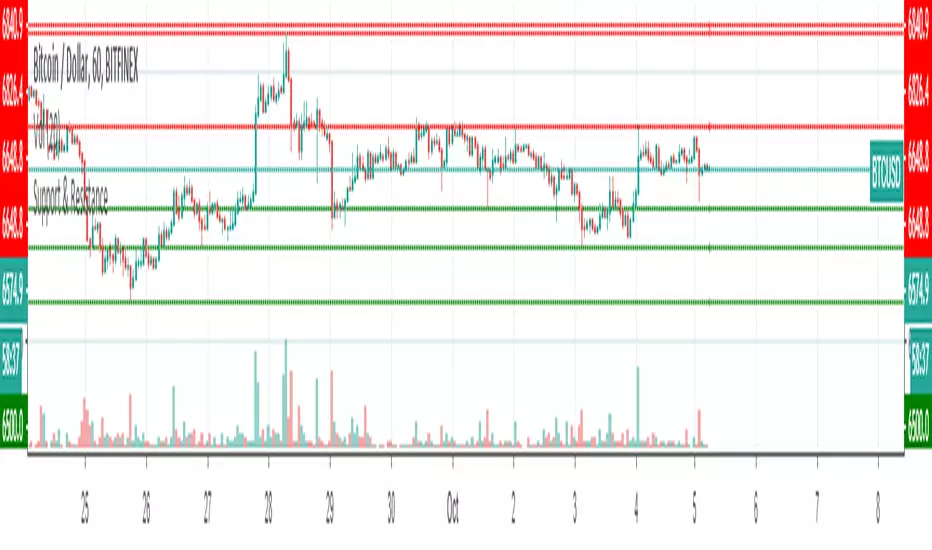
Support & ResistanceThis indicator detects large swings/pivots in historical price action to highlight tops and bottoms which might act as future levels of support or resistance. The code by default detects the last 3 significant swing highs and the last 3 swing lows. It then places lines on the chart to highlight those levels.
For a full overview of the indicator and code commentary visit the backtest-rookies (.com) website.
Example
Upper Timeframe - Repaint FixThis script is a proof of concept and one possible solution for how to deal with upper timeframe repainting issues. It works for Strategies only .
Strategies that utilize data from upper timeframes can still be subject to repainting issues when forward testing. Users can copy the code and use a similar solution in your own scripts.
For full code commentary, explanations and examples visit the backtest-rookies (.com) website.
Average DownThis strategy has been published for a Pyramiding tutorial on the Backtest Rookies website.
For a full overview of the code and an introduction to Pyramiding check out our site.
Summary
The code example will create a simple script that allows us to average down whenever our portfolio is down x%. The idea will be to bring our average cost down so that we can still exit with a profit when conditions improve. With this in mind, the strategy shall also have a simple take profit exit at x% above our average price.
Inputs
Target Loss to Average Down (%) : This is the target percentage level will trigger us to average down. In other words, if we have a close below this level from our average buying price, we will average down.
Target Take Profit : A standard take profit percentage level. Use this to set how much profit you will target.
% Of Current Holdings to Buy : Is the number of shares/contracts we will aim to buy when we average down. 50 will mean we buy 50% of our current holdings. So if we have 100 shares, then we buy 50 when we average down.
SMA Period : Defines our SMA lookback period. Our strategy will enter the first/initial position when we have a close above our SMA level.

Swing IndicatorThis indicator provides some base code for looping over data to identify swings in price action. Full code commentary can be found on the backtest rookies website.
The indicator shall allow users to "analyse" a recent historical candle to detect whether it was a swing point. This will work by inputting a number to select which historical candle you want to check. The indicator will then check all candles after it until the current candle. It shall also check the same amount of candles before it. If the candle analysed has the lowest low or highest high in the complete range, then we know it was a swing point.

52 Week High/Low52 Week High / Low Indicator
A simple, unobtrusive indicator that can be used on any timeframe to display the 52 week high/low values.
Features
Works on any timeframe.
Unobtrusive: Simple horizontal lines showing only the current 52 week values.
Allows the user to select whether to calculate the 52-week values from candle close values or the respective highs/lows.
For full overview and code commentary - Visit the backtest-rookies website.

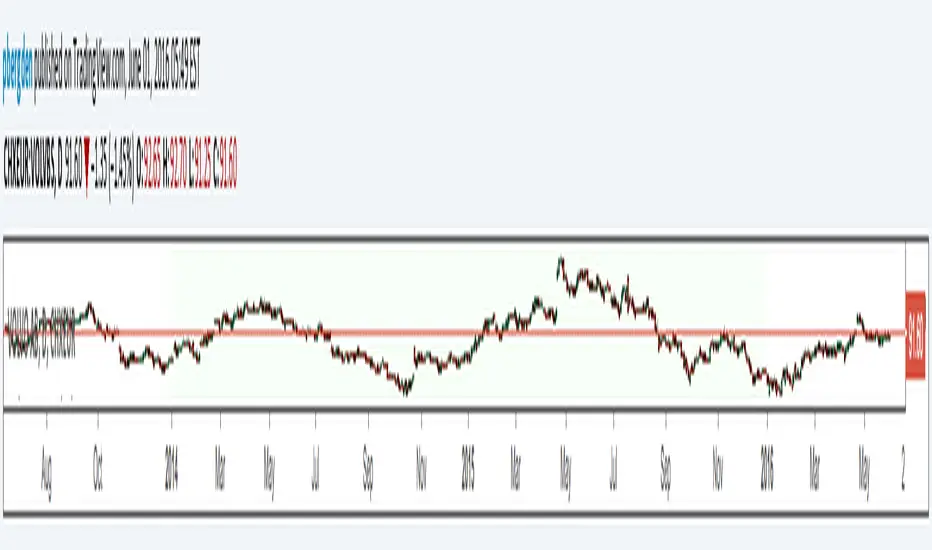
Currency StrengthRepublished: The original script violated house rules by including an external link to Backtest Rookies.
Background
The currency strength indicator takes up to 4 forex pairs and calculates the average strength across all pairs. The indicator uses the pair's daily percentage change to calculate the overall strength. For flexibility, it can accept any instrument as an input. This means you can use multiple instances to track various currency strengths. It was designed with the major pairs in mind but there is no reason why it cannot be used for other FX pairs.
Note: The indicator defaults to GBP. When setting it up for other currencies, be sure to flag whether the currency is a counter currency or not.
The code is provided free and open source. Please modify it as you see fit.
Screenshots
Defaults with Annotation
Yen strength beating pound strength
Opposing Trends

Multi SMA'sRepublished: The original script violated house rules by including an external link to Backtest Rookies.
Background
This is a simple “multi” SMA indicator so that multiple SMA’s can be monitored whilst only using a single indicator slot. It also has a couple of features that let you mix time frames and de-clutter the chart.
The code is open for anyone to modify and a copy
About the Indicator
Although the indicator does nothing more than it says on the tin, There are a couple of points worth mentioning:
The indicator will let you view up to 4 SMA’s
You can set the period for each SMA independently
You can set the resolution for each SMA independently (So you can see the see the daily SMA level when on the 15-minute chart for example)
Each SMA can be turned on/off independently to avoid clutter.
Screenshot - Default Settings

Backtest Strategy Optimizer Adapter - Supertrend ExampleSample Code
This is a sample code for my Backtest Strategy Optimizer Adapter library.
You can find the library at:
Backtest Strategy Optimizer Tester
With this indicator, you will be able to run one or multiple backtests with different variables (combinations). For example, you can run dozens of backtests of Supertrend at once with an increment factor of 0.1, or whatever you prefer. This way, you can easily grab the most profitable settings and use them in your strategy. The chart above shows different color plots, each indicating a profit backtest equal to tradingview backtesting system. This code uses my backtest library, available in my profile.
Below the code you should edit yourself
You can use ChatGPT or write a python script to autogenerate code for you.
// #################################################################
// # ENTRIES AND EXITS
// #################################################################
// You can use the link and code in the description to create
// your code for the desired number of entries / exits.
// #################################################################
// AUTO GENERATED CODE
// ▼▼▼▼▼▼▼▼▼▼▼▼▼▼▼▼▼▼▼▼▼▼▼▼▼▼▼▼▼▼▼▼▼▼▼▼▼▼▼▼▼▼▼▼▼▼▼▼▼▼▼▼▼▼▼▼▼▼▼▼▼▼▼▼▼
= ti.supertrend(10, 0.1)
= ti.supertrend(10, 0.2)
= ti.supertrend(10, 0.3)
= ti.supertrend(10, 0.4)
// 005 etc...
pnl_001 = backtest.profit(date_start, date_end, entry_001, exit_001)
pnl_002 = backtest.profit(date_start, date_end, entry_002, exit_002)
pnl_003 = backtest.profit(date_start, date_end, entry_003, exit_003)
pnl_004 = backtest.profit(date_start, date_end, entry_004, exit_004)
plot(pnl_001, title='0.1', color=backtest.color(001))
plot(pnl_002, title='0.2', color=backtest.color(002))
plot(pnl_003, title='0.3', color=backtest.color(003))
plot(pnl_004, title='0.4', color=backtest.color(004))
// Make sure you set the correct array size.
// The amount of tests + 1 (e.g. 4 tests you set it to 5)
var results_list = array.new_string(5)
if (ta.change(pnl_001))
array.set(results_list, 0, str.tostring(pnl_001) + '|0.1')
if (ta.change(pnl_002))
array.set(results_list, 1, str.tostring(pnl_002) + '|0.2')
if (ta.change(pnl_003))
array.set(results_list, 2, str.tostring(pnl_003) + '|0.3')
if (ta.change(pnl_004))
array.set(results_list, 3, str.tostring(pnl_004) + '|0.4')
// ▲▲▲▲▲▲▲▲▲▲▲▲▲▲▲▲▲▲▲▲▲▲▲▲▲▲▲▲▲▲▲▲▲▲▲▲▲▲▲▲▲▲▲▲▲▲▲▲▲▲▲▲▲▲▲▲▲▲▲▲▲▲▲▲▲
// AUTO GENERATED CODE
// #################################################################
QFL single TF with alertsBacktesting compatible QFL pine script w/alerts
This version of QFL was made based on this one:
From author:
www.tradingview.com
I made the following additions according to my requirements:
- I need to use pine script 4
- I needed to avoid repainting issues so I'm not calling directly security, I'm using the wrapper function.
- There might be still repainting issues when you use "max base age" which uses the function "barssince" so be careful, you can disable it by setting its value to zero.
- Alerts so I can use it for automated trading and bots
- In order to make this signal compatible with the backtest script there's an option provided in the settings. If you enable this option this indicator will plot 1 whenever there's a BUY signal. This will allow the backtest to pick the "QFL Buy" from external indicator so it can perform the backtest.
I recommend some of these settings to start playing with the chart in 15 min / QFL in 1, 2 or 4 hours.
The higher the TF the more conservative.
QFL with 3.5% is pretty popular but you can try higher QFL percentage settings for a more conservative approach.

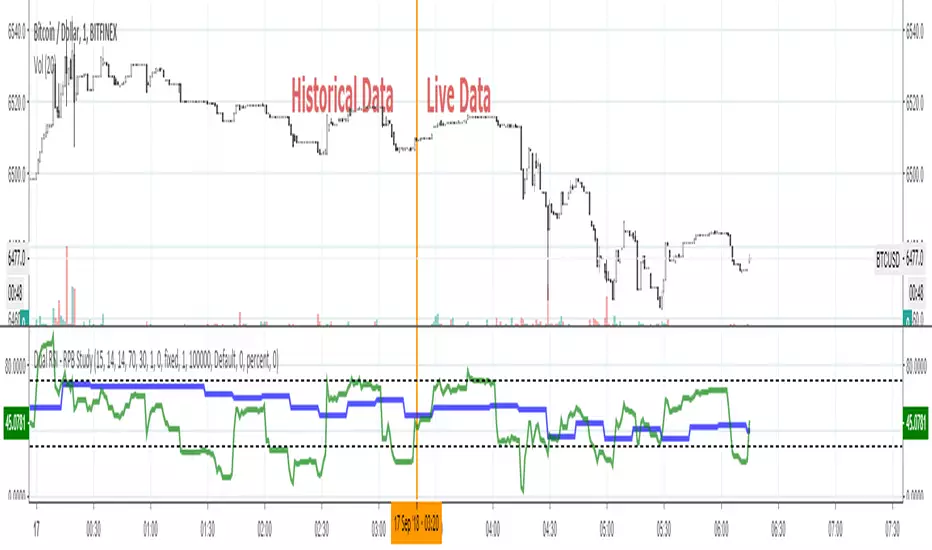
Backtester UtilityLook ahead bias is the most evil bias responsible for overestimation of the performance of the trading system.
As the Bar replay feature is only available to paid users which is a great tool for manual testing of the trading system. Leaving other users prone to the evil of Look ahead bias.
So that I have developed this indicator which will help users to manually backtest the strategies.
This indicator hides the price action after specified date and time.
Here are the steps for using the indicator.
1) Hide your chart manually.
2) Plot the indicator.
3) Change the input of time and date after which you want to hide price action.
4) Change the script according to your trading strategy.
5) Enjoy the free of cost manual backtesting.
Good trading buddies !
Note : This post is only for educational purpose , it does not contain any financial advise.
Backtests Are BrokenThis script demonstrates a fatal flaw with Trading View backtests involving trailing stops. Trading View assumes the most optimistic case for trailing stops, always giving you the best case high/low of a bar instead of the worst or average case. Within a bar, the price could reverse against your position after the open and trigger your trailing stop for a loss before the price goes in your favor, but Trading View backtests do not consider this and instead always give you the best case returns. This allows a trivial strategy to appear as though it would perform miracles.
This strategy enters on a random bar and sets a trailing stop triggered one tick better than the current price with 0 trailing distance. Trading View then generously gives this strategy the difference between the open price and best possible wick as a profit. The only way this strategy can lose money in simulation is if the price goes straight down after entry and never retraces. It works on all symbols on all timeframes due to this systematic problem with the Trading View backtester.

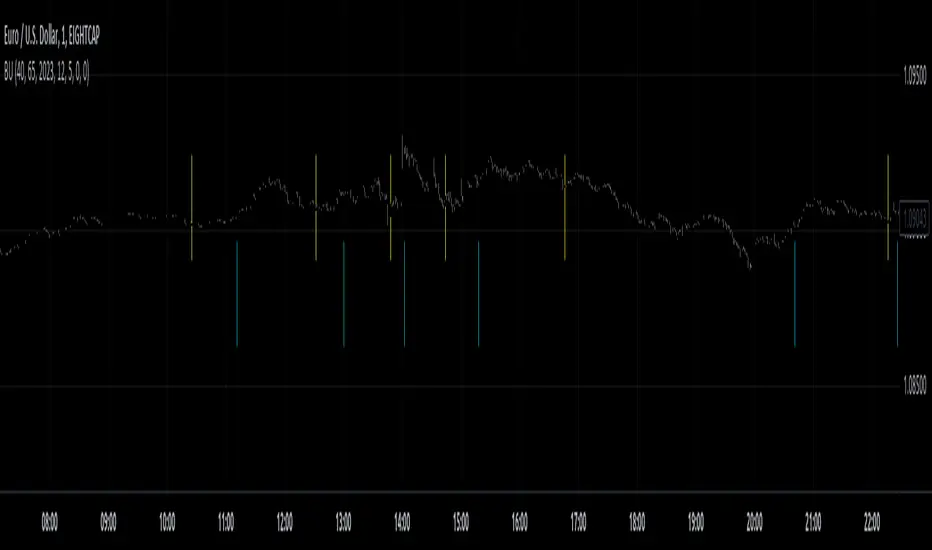
Backtesting Period Selector | ComponentDescription
It's nice to quickly be able to set the backtesting period when writing strategies.
To make this process faster I wrote a simple 'component'.
So this is not a strategy but rather code you can plug-into your strategy and use
if you need that specific functionality.
Then it's just a matter of selecting which dates you want to backtest.
You can also chose to color the background to visually show the testing period.
Unfortunately, the background color is fixed at 'blue' for now.
Ps. I like the idea of writing small components to be pluged into other strategies
I'll try to develop this idea a bit further and see how small pieces of code can
easily provide specific functionality to assist and make deving strategies a bit less 'Pineful'.
Usage
First copy the instructed part of the component code over to your strategy.
Next, use the testPeriod() function to limit strategies to the specified backtesting period.
Example usage:
if testPeriod()
strategy.entry("LE", strategy.long)
Todo / Improvements
There are many ways to improve this component and I'm not a very good coder so this is a very crude solutions.
Anyway, here are some things which would be nice to improve:
1. Enable color selection so that the user can choose the background color of his own liking.
2. Improve naming of variables.
3. Test for ilogical choices, such as test period start being at a later date, than test period stop.
4. Account for time zones.
As always, any feedback, corrections or thoughts are very much welcome!
/pbergden
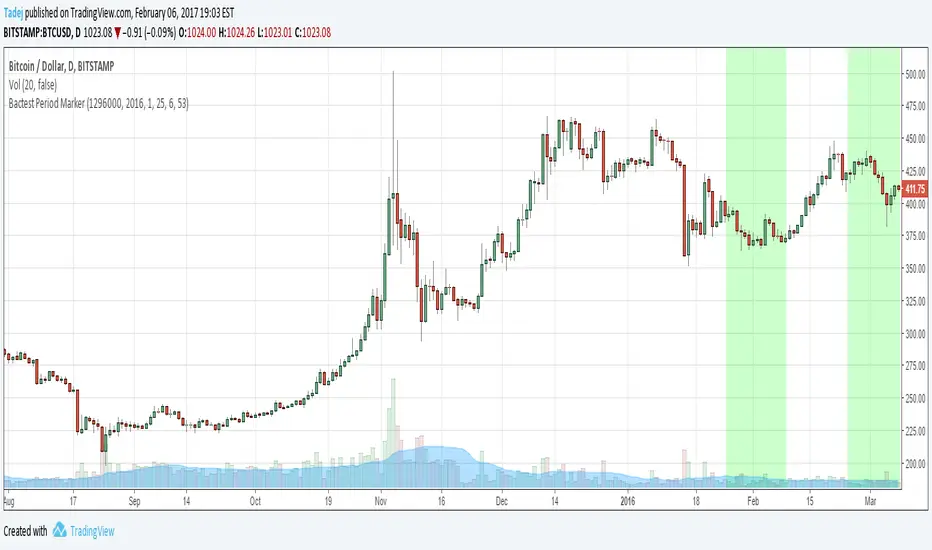
Bactest Period MarkerSimple script that will mark backtest periods (if you have to run backtests in multiple parts, like on CryptoTrader )
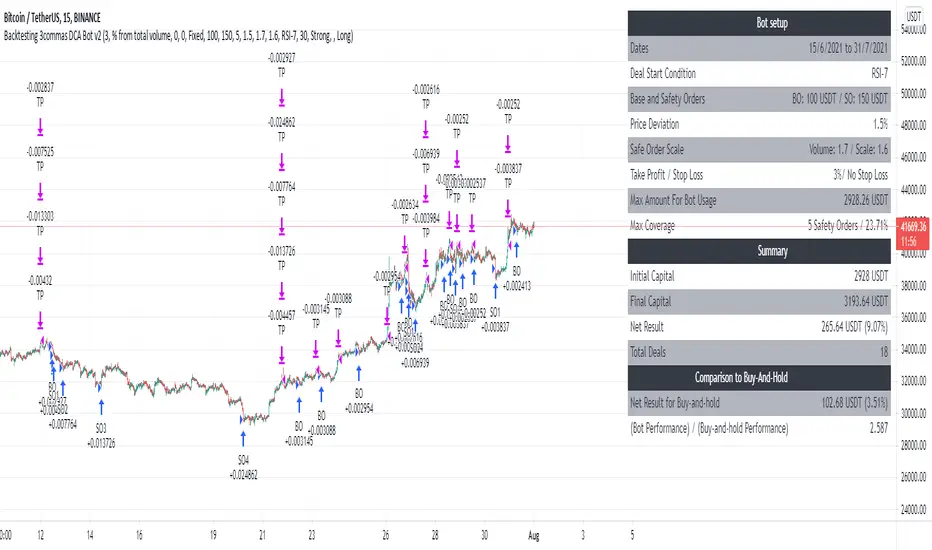
Backtesting 3commas DCA Bot v2Updating previously published simulated 3commas DCA logic with a sexier insert and more meaningful default parameters.