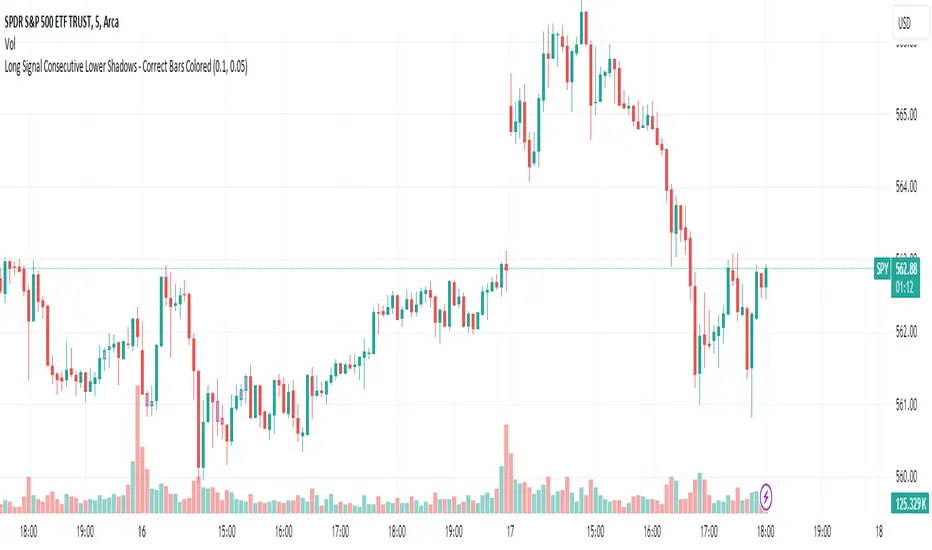
Long Signal Consecutive Lower Shadows - Correct Bars ColoredThis script identifies and highlights consecutive lower shadows on candlesticks in TradingView. A lower shadow is the portion of the candlestick between the low price and the lower of the open or close prices, often indicating price rejection at lower levels.
Key Features:
Threshold Settings: The user can customize the minimum length of the lower shadow (lowerShadowThreshold) and the maximum allowable price difference between consecutive lows (priceDifferenceThreshold).
Bar Coloring: When two consecutive bars meet the lower shadow condition, both bars are colored (default green).
Alerts: An alert is triggered when consecutive lower shadows are detected, allowing users to be notified of potential market reversals or buy opportunities.
Cari dalam skrip untuk "bar"
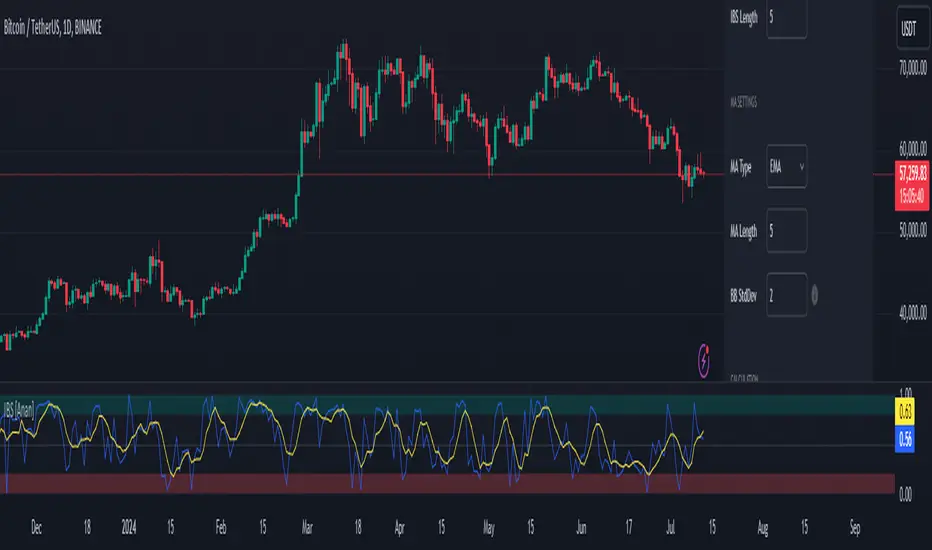
Internal Bar Strength IBS [Anan]This indicator calculates and displays the Internal Bar Strength (IBS) along with its moving average. The IBS is a measure that represents where the closing price is relative to the high-low range of a given period.
█ Main Formula
The core of this indicator is the Internal Bar Strength (IBS) calculation. The basic IBS formula is:
ibs = (close - low) / (high - low)
I enhanced the original formula by incorporating a user-defined length parameter. This modification allows for greater flexibility in analysis and interpretation. The extended version enables users to adjust the indicator's length according to their specific needs or market conditions. Notably, setting the length parameter to 1 reproduces the behavior of the original formula, maintaining backward compatibility while offering expanded functionality:
ibs = (close - ta.lowest(low, ibs_length)) / (ta.highest(high, ibs_length) - ta.lowest(low, ibs_length))
Where:
- `close` is the closing price of the current bar
- `lowest low` is the lowest low price over the specified IBS length
- `highest high` is the highest high price over the specified IBS length
█ Key Features
- Calculates IBS using a user-defined length
- Applies a moving average to the IBS values
- Offers multiple moving average types
- Includes optional Bollinger Bands or Donchian Channel overlays
- Visualizes bull and bear areas
█ Inputs
- IBS Length: The period used for IBS calculation
- MA Type: The type of moving average applied to IBS (options: SMA, EMA, SMMA, WMA, VWMA, Bollinger Bands, Donchian)
- MA Length: The period used for the moving average calculation
- BB StdDev: Standard deviation multiplier for Bollinger Bands
█ How to Use and Interpret
1. IBS Line Interpretation:
- IBS values range from 0 to 1
- Values close to 1 indicate the close was near the high, suggesting a bullish sentiment
- Values close to 0 indicate the close was near the low, suggesting a bearish sentiment
- Values around 0.5 suggest the close was near the middle of the range
2. Overbought/Oversold Conditions:
- IBS values above 0.8 (teal zone) may indicate overbought conditions
- IBS values below 0.2 (red zone) may indicate oversold conditions
- These zones can be used to identify potential reversal points
3. Trend Identification:
- Consistent IBS values above 0.5 may indicate an uptrend
- Consistent IBS values below 0.5 may indicate a downtrend
4. Using Moving Averages:
- The yellow MA line can help smooth out IBS fluctuations
- Crossovers between the IBS and its MA can signal potential trend changes
5. Bollinger Bands/Donchian Channel:
- When enabled, these can provide additional context for overbought/oversold conditions
- IBS touching or exceeding the upper band may indicate overbought conditions
- IBS touching or falling below the lower band may indicate oversold conditions
Remember that no single indicator should be used in isolation. Always combine IBS analysis with other technical indicators, price action analysis, and broader market context for more reliable trading decisions.
[LCS] Bar HeatmapThe script is an overlay aimed at making price action within a range more comprehensible, i.e. what is the “story” that the band range is telling in relation to the price. You’ll see bars become brighter as they come near the upper or lower band, and dimmer around the average/middle of the two bands. This makes it easier to spot when the price is within an oversold or overbought area or when its experiencing a strong trend movement. The color shift from one to the other can also give a sense as to whether the price action is changing character (going from bullish to bearish or vice versa).
Settings are available for customization to the user's liking.
How to use:
1. Add the indicator.
2. Add another indicator to use as the source, such as Bollinger Bands, which provides upper and lower plots for a channel range.
3. Click the gear icon to access the indicator settings.
4. Mandatory: Select the Upper Band and Lower Band settings as the upper and lower plots from your source indicator of choice to define the range.
5. Save settings. You should now see bars on your chart.
6. Access the Chart Settings (not the indicator settings) and hide the Body, Borders, and Wick for the default candle bars to avoid overlap.
You may need to perform additional configuration steps in your source indicator to appropriately size the range of the upper and lower band plots for a meaningful visualization.

S/R and Reversal BarsToday I'm proposing an idea to form S/R with a slightly different basic idea. This is a combination of CCI and candlestick study, and we will use this to mark possible reversal candles and possible S/R lines.
This is nothing complicated, I've used a basic CCI indicator with certain rules/system to mark S/R levels on the chart. (Have loaded traditional CCI indicator on bottom for comparison)
S/R levels are market as followed
Cross -
Lime = Support
Red = Resistance
Zero/Balance line - Yellow circles
The idea is to use this indicator to trade sideways market more successfully, in trending market this can be futile if you are not waiting for the break-out or breakdowns with confirmation.
Since this is based on CCI, it will give static result only when bar is closed, till then it will be susceptible for repaint. This is inherited nature from CCI readings on current bar. I could change this to only making reading on closed bar (historical bar), but that takes away from the uniqueness of this indicator in giving early indications.
This is a great tool for intraday scalping, but it does work on all timeframes, it's not bound by granularity.
This is for education purpose only.
Past success or seemingly positive results on published posts are not indication of future success.

Advanced Price Direction bar colorsIn the advanced price direction algorithm situations of faltering price directions (fda) are identified.
These are very interesting, because this happens at tops, flags and trend turns.
I got the idea of coloring the bars with fda in a distinguishing color, reddish gray for fda down and blueish gray for faltering up.
The remaining bars retain standard color, but now this color 'confirms' the trend.
To show that this is true, I also plot a simple moving average (sma) with the same length in the chart.
It turns out that somehow the bars react to being above or below the sma, but also react to the direction of the sma.
Very interesting.
Have fun

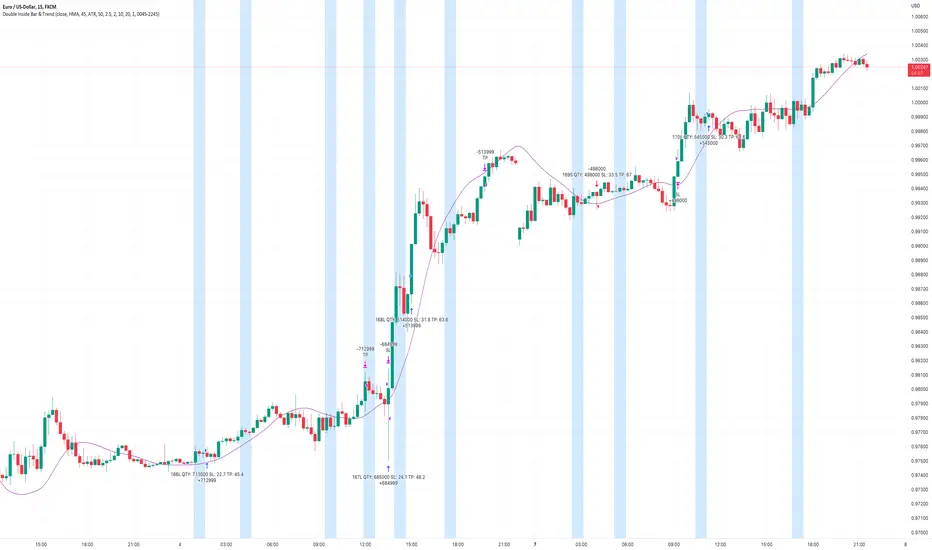
Double Inside Bar & Trend Strategy - KaspricciDouble Inside Bar & Trend Strategy - Kaspricci
This strategy combines the Double Inside Bar candlestick pattern with a trend filter. Once the second inside bar closes and price is above trend moving average, a buy stop order is placed at high of the candle. If price is below trend moving average, a sell stop order is placed at the low of the candle.
This strategy is for educational purposes only! It is not meant to be a financial advice.
Settings
Trend source, type of moving average and length for calculating trend
Stop Loss Type - default: ATR. You can switch between stop loss calculation based on Average True Range value or fixed value.
ATR Length / Factor / TP Ratio - default: 14 / 2.0 / 2.0. Used to calculate the Stop Loss as ATR * Factor and Take Profit as Stop Loss * TP Ratio.
FIX Stop Loss / Take Profit - default: 10 pips / 20 pips. In case you select Stop Loss Type = FIX, these value swill be used.
Risk in % - default: 1%, option to adjust the quantity of a trade based on a defined risk percentage. If enabled, it will overwrite the quantity parameter of the strategy settings.
On top you can filter trades by start and end date as well as time of the day.
NumberOfVisibleBarsLibrary "NumberOfVisibleBars"
This library calculates the number of visible bars on the user screen
NumberOfVisibleBars(No)
Calculates the number of visible bars on the user screen
Parameters:
No : paramters needed
Returns: The numbers of visible bars on the user screen (int)

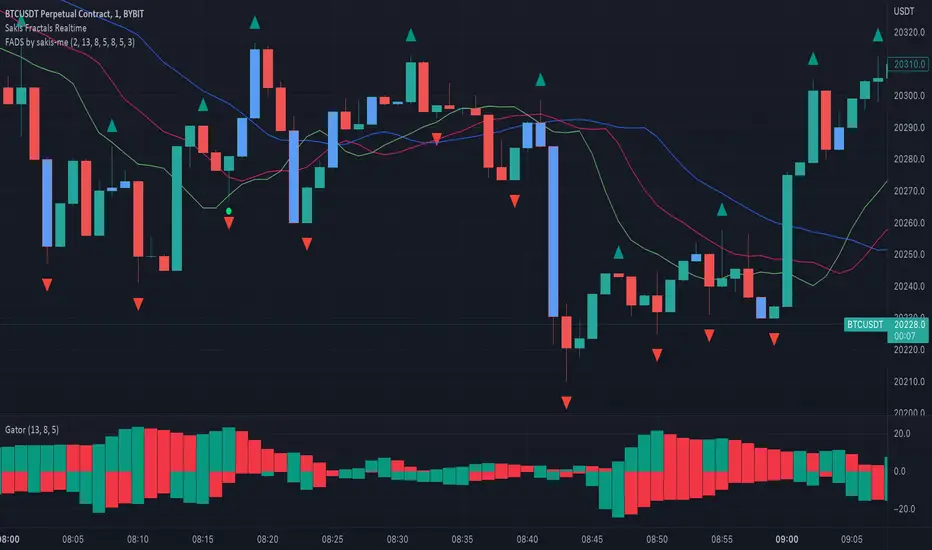
Fractals + Alligator + Divergent Bars + Squat BarsFractals + Alligator + Divergent Bars + Squat Bars Williams Indicators
All combined in one
MTF MACD BarOVERVIEW
This indicator shows MACD(Moving Average Convergence/Divergence) is up or down, represented by a bar. This indicator is compatible with MTF.
CONCEPTS
What do you want to know about market analysis?
Do you want a hard analysis? You can look for it.
All I want to know is whether the commonly known technical analysis is 'UP' or 'DOWN'.
All I want to know is whether the current market price is going up or down. Not only for the current, but also for the monthly, weekly, and daily status.
I want to make a decision in a moment. Without even thinking about it.
That is why I created a color-coded bar indicator to show the status.
No need to frown anymore.
DETAILS
You need more information about MACD, click here.
tradingview.com
MACD histogram Green ⇒ Bar is green.
MACD histogramRed ⇒ Bar is red.

[FR]Custom Candles/FVG/nSideBarCustom Candles /FVG/ nSideBar
- I used this as a learning project for understanding plot()'s Better
- My goal was to see if I could use normal plots to cleanly plot FVGs on the chart using only plots with out and boxes/lines
The problem was if multiple FVGs were on back to back bars the plot fill would fill the line to the next FVG/Bar
I solved this by using 4 plots and alternating them if consecutive FVGs form
- 2 MODES
- Slim
- Normal
//////////////////////////////////////////////////////////////////////////////////////////////////////////////////////////////////////////////////////////////////////////////
-Slim
Uses 3 plotcandle() parts and divides the candle between body/wicks/open and close
by manipulating the ohlc inputs and the colors I was able to pretty make them full customizable
all components are customizable with up/down colors
-Normal
These are your normal candles but they are full customize able from components to individual up/down colors
--------------------------------------------------------------------------------------------------------------------------------------------------------------------------------------------------------------------------------------------------------
- FVGs
There are 2 FVG settings can be used with both MODES
- Big
These are the FVGs that use plots and since there isn't a 500 object limit on plots you don't need to manage them in the code and they are there how ever far you need to look back
- Slim
These use a Line and the width of the line can be adjusted for user preferences
--------------------------------------------------------------------------------------------------------------------------------------------------------------------------------------------------------------------------------------------------------
- INSIDE-BARS
These will change the color of the body of either SLIM or NORMAL Candles
--------------------------------------------------------------------------------------------------------------------------------------------------------------------------------------------------------------------------------------------------------
Drawing Snap Features Work Just Fine!
I suggest hiding your chart candles with the eye in the top left of the screen and moving the indicator to the top of your object tree
I understand that the candles in the chart pictures are impractical I was just demonstrating the functionality of the tool
Hope You Enjoy!!
FFriZz

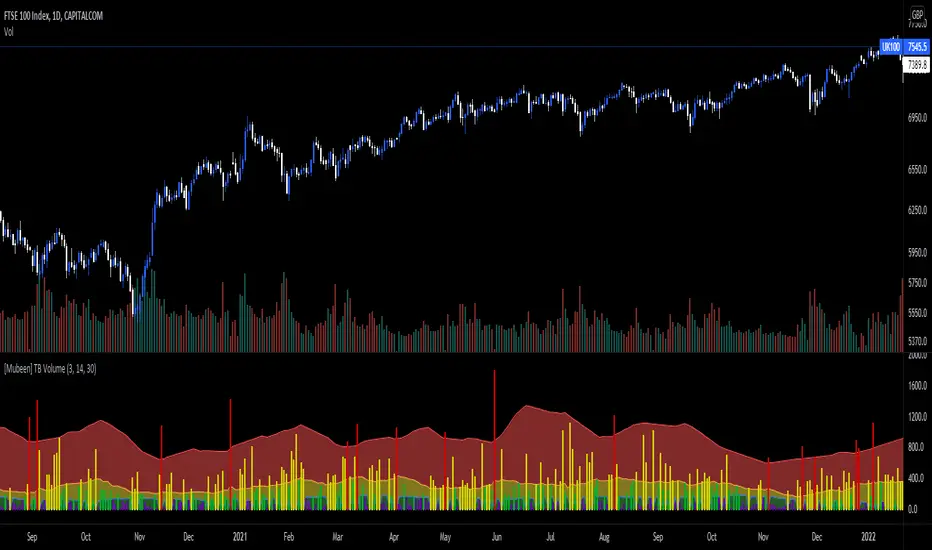
[Mubeen] True Bar VolumeTrue Bar Volume, or TB Volume, is an indicator that measures the volume against the price action that has occurred.
Volume can sometimes be miss leading as it does not necessary show whether it had an impact on the price of the underlying, as one individual (represented as one volume) who has put $100 into the underlying can impact the underlying the same as hundred individuals (represented as hundred volume) putting $1 into the underlying: but the volume will widely differ and can cause confusion for outsiders. With the True Bar indicator, it aims to show abnormal behaviour in the price change against the amount of volume that was stated. It visualises the effect of the volume on the underlying by colour coding the different levels of True Bar results, divided into Red, Yellow, Green, Purple.
Red indicates that the price has changed way out of portion compared with the volume that was seen. It is compared against the highest TB Volume values through selected periods and once the volume as broken out of the high, it is considered an anomaly.
Yellow indicates that the TB Volume values are representing the mean values so it is considered as normal trading activity. Spikes in yellow values can also be seen as rise in high interest in the underlying.
Green indicates that the TB Volume values are under performing in market activity.
Purple indicates that is it a null result as investors might be looking for a better entry into a market, or seen as interest is low in the market.
TB Volume should not be used on it's own as it only gives a reporting measurement of the volume performance, which may be meaningless without the supplementation of other indicators.
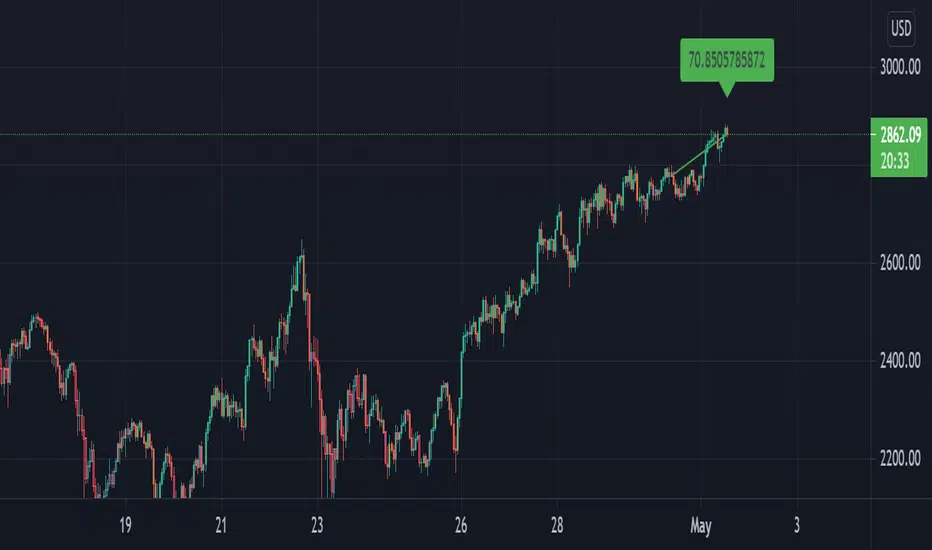
Current bar predicted volumeDrag this indicator in the same panel with the volume in the object tree, then right click on the scale bar and set "merge all scale into one" for a correct visualization.
This indicator multiply the current traded volume of a candle with the total time of that candle. This offer a prediction of where, in case the volumes would keep trading at a comparable magnitude, the volume bar would close when the candle will close.
The predicted volume is indicated with a blue short line above the current volume bar, and updates in real time.
I find this indicator extremely useful to offer at a glance an idea of an ascending or descending volume pattern, that can serve as confirmation for a reversal or breakout for example.
Very suitable for short time frames, where decisions have to be taken fast.
Enjoy,
Luca.

TrendStrength Turbo Bars - Directional TrendsMy interpretation of Danielle Shay's popular SimplerTrading TrendStrength Turbo indicator.
The TrendStrength indicator is based on a Fibonacci-based stacked EMA arrangement using the 5, 8, 13, 21 and 34 EMAs:
-> Green bars indicate an uptrend i.e. when the EMAs are positively stacked - there is more upward pressure than downward pressure in the price;
-> Red bars indicate a downtrend i.e. i.e. when the EMAs are negatively stacked - there is more downward pressure on the price; and
-> Yellow bars indicate no strong directional trend and potential for a reversal.
Volume spikes 50% above average volume are then flagged as dots at the bottom of the chart further confirming price momentum.
This indicator should compliment other popular indicators, as confirmation whether to stay in a position or not.
1St Bar GAP+BkOut Screener v2 by RMFirst Bar Gap and subsequent conditions are used as one of the several strategies for Day traders.
This script runs on first bar and checks if the stocks has an initial Gap (up or down), then checks for next bars to be inside the boundaries of the first candle
you can customize this screener according to your requirement. There are a number of very clever people I have taken bits of code and ideas, thanks to you all :)
Used part of this code as published by @PineCoders and Public Libraries. Also add some power query code to help you create the symbols input in the script
Disclaimer: This is not a Financial advisory tool. For education purposes only. * Use at your own risk *
Outline:
gap up/ gap down on 1 min first candle -> good
2nd candle inside 1st candle -> good
3rd to nth candle to break out from first candle range -> good /alert/ Plot flag
//M (Excel power query) code to load and format watchlist from txt file format
//Input: , Output:
let
// replace and for the correspondign values in your computer
Source = Csv.Document(File.Contents("C:\ \ "), ),
#"Transposed Table" = Table.Transpose(Source),
#"Sorted Rows" = Table.Sort(#"Transposed Table",{{"Column1", Order.Ascending}}),
#"Added Index" = Table.AddIndexColumn(#"Sorted Rows", "Index", 1, 1, Int64.Type),
#"Changed Type1" = Table.TransformColumnTypes(#"Added Index",{{"Index", type text}}),
#"Inserted Merged Column1" = Table.AddColumn(#"Changed Type1", "Merged", each Text.Combine({"0", }), type text),
#"Inserted First Characters" = Table.AddColumn(#"Inserted Merged Column1", "Two Characters", each Text.End( , 2), type text),
#"Removed Columns" = Table.RemoveColumns(#"Inserted First Characters",{"Index", "Merged"}),
#"Inserted Merged Column" = Table.AddColumn(#"Removed Columns", "Merged", each Text.Combine({"s", , " = input( '", , "' , type=input.string)"}), type text)
in
#"Inserted Merged Column"
//--> once input string is created Copy&Paste in this code after // Symbols _ Use Power Query in Excel
// end of M code to load watchlist from txt format

Equivolume Overlay - Volume BarsThis is an addon for displaying volume bars along with Equivolume bars which can be found here

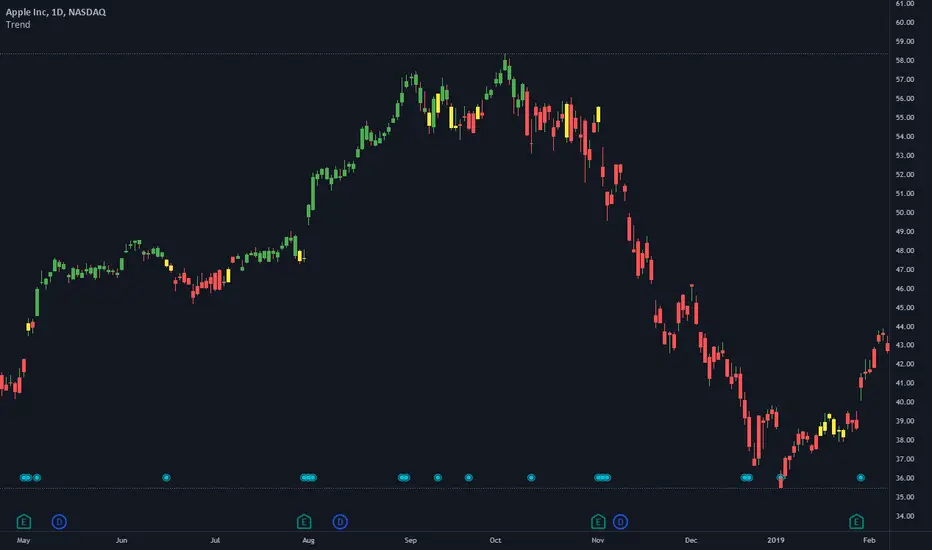
Price-Action-BarsThis script came as a discussion in our community forum.
It paints
1. Pin Bars (Bottom or Top)
2. inside/outside Bar
3. Bullish Bottom bar
It also has the ability to add alerts on your favorite stocks

B3_HH_LL_Break Bar PainterThis is a simple Highest High or Lowest Low Breakout Painter.
Defaults in the order that they may color bars - checks top color first:
where n = your input length
BLACK = Outside Bar HHLL(n)
RED = Lower Low LL(n)
GREEN = Higher High HH(n)
BLUE = Inside Bar HHLL(n)
You may customize the colors in the indicator's settings-cogwheel on the chart.
Enjoy!
d^.^b

Difference over barsDescription:
One of my followers asked about an indicator that shows the difference between the open and a previous close and didn't find one so I wrote this one. This is similar to a momentum indicator except it offers more flexibility. While the standard momentum indicator calculates a difference between current close and a previous close (sometimes customizable to work on open, high or lows instead of close), this allows to mix and match between open, high, low and close. It also offers multiple kinds of moving averages.
Settings:
Current point of reference
Previous point of reference
Difference over how many bars?
How it works:
The indicator calculates the difference between the current point of reference and a previous (n-bars back) point of reference (where n is given by the "Difference over how many bars?").
How to use it:
find historical support lines like the 0.68 line in the cart above where in the past the indicator tends to bounce back; similarly find resistance lines like the -0.75 line in the chart (which servers as a resistance line both for the main indicator line and its moving average )
look for convergence between the price and the indicator; for example, if the price is going up and the indicator is going down a change in the price direction may be coming soon
look for the indicator crossing its moving average: moving up will signify an up trend and vice-versa
since the difference between the open and previous close (which is what the blue line in the chart shows) since to go up to 0.68 (the upper horizontal line) and down to -0.75 (the lower horizontal line) most of the time, one strategy, using options, is to to buy, right before the close of a trading day, a "long iron butterfly": buy-to-open (BTO) both a call and a put at the strike price and sell-to-open (STO) a call at a strike of around $0.68 more and sell to open a put at a strike of around $0.75 less. The STO legs should be for the next expiration and the BTO legs for the next expiration after that. This way the STO will decrease their time value faster than the BTO legs if the price stays flat (which plays to your advantage) and the BTO legs may make profit if the next day it opens away from the price at which the ticker closed the previous day (when the position was opened). The most profit is when it moves right up to one of the STO legs. This position would normally be closed next day at opening. The percentage of profit it makes is low compared to other strategies but also the percentage of the total cost at risk is also low which could potentially allow a trader to increase the lot and thus, in the end, the total profit amount may be comparable to other strategies.
Notes:
The indicator in the chart above comes with the standard options. For a more standard momentum indicator set both the current and previous reference point to the same OHLC value (such as "close").
The 0.68 and -0.75 levels are for open/close (current/previous point of reference) for ticker INTC. Obviously, other tickers will likely have other levels and you will have to find those yourself. If you use INTC but use other combination of current and previous reference points, they will have different levels as well.

angle bar colors [LM]Hello guys,
I would like to introduce you angle bar colors indicator. It colors bars depending the angle of the bar x length back and current one
lime angle > 70 degrees
green 20 < angle < 70 degrees
orange 0 > angle <= 20 degrees
purple 0 > angle >= -20 degrees
red -20 > angle > -70 degrees
maroon angle < -70 degrees
Any suggestions are welcome
Trading margin, inside bars and outside barsThe indicator shows the trading range and the average trading range over a freely selectable period. Inside bars and outside bars are color-coded in the chart.
Der Indikator zeigt die Handelspanne und die durchschnittliche Handelspanne über eine frei wählbare Periode. Im Chart werden Innenstäbe und Außenstäbe farblich gekennzeichnet.

Paint 1 & 3 Bars (The Strat)Based on 'The Strat' methodology by Rob Smith.
This script will paint 1 & 3 bars per 'The Strat'.
N.B. Per 'The Strat' a bar is seen as a 1 (inside) when the bar's high or low is an equal tick to the previous bar.

Volume Color Bars with SMA MACD & Linear RegressionVolume Bars colored to make it easy to read with Volume Spread Analysis Indicator.
1. Red - Volume less than Simple Moving Average
2. Blue - Volume higher than Simple Moving Average
3. Black - Maximum volume of last Max_Count bar (default = 40 bars)
Additionally, you can plot Moving Average, Linear Regression and MACD of volume.

RSI & Volume Coloured BarsCandles get darker when volume is high, and brighter when volume is low. They are red or green depending on whether the RSI is above or below a threshold value, or alternatively you can pick a more vanilla coloring based on current close vs last close or last open.
For personal use as I enjoy the aesthetics of it. The more solid RSI coloring helps highlight the brightness variations from changing volume and makes trends crystal clear.
Inspired by "Volume Based Coloured Bars" by KivancOzbilgic:
and by and by RSI bars chart by taskman9: