Pin Bar CandlesPin Bar Candles can be used for identifying reversal points with the help of support and resistancePenunjuk Pine Script®oleh NikhilWange177
Three Bar Exit Trailing Stop - Naked Forex: Price ActionThree Bar Exit Trailing Stop - Naked Forex: Exit indicator based on price action. The naked trader locks in profit by trailing the stop loss behind the lowest low of the last three candlesticks (for buy trades) or above the highest high of the last three candlesticks (For sell trades) Penunjuk Pine Script®oleh Numlocka1197
How to Overlay First LTF Bar of DayExample how to overlay the first lower timeframe bar of the day across the entire day. Set chart to a timeframe that is lower than 1 Day period. Also included option for coloring wick pressure of that bar. NOTICE: This is an example script and not meant to be used as an actual strategy. By using this script or any portion thereof, you acknowledge that you have read and understood that this is for research purposes only and I am not responsible for any financial losses you may incur by using this script! Penunjuk Pine Script®oleh allansterTelah dikemas kini 88545
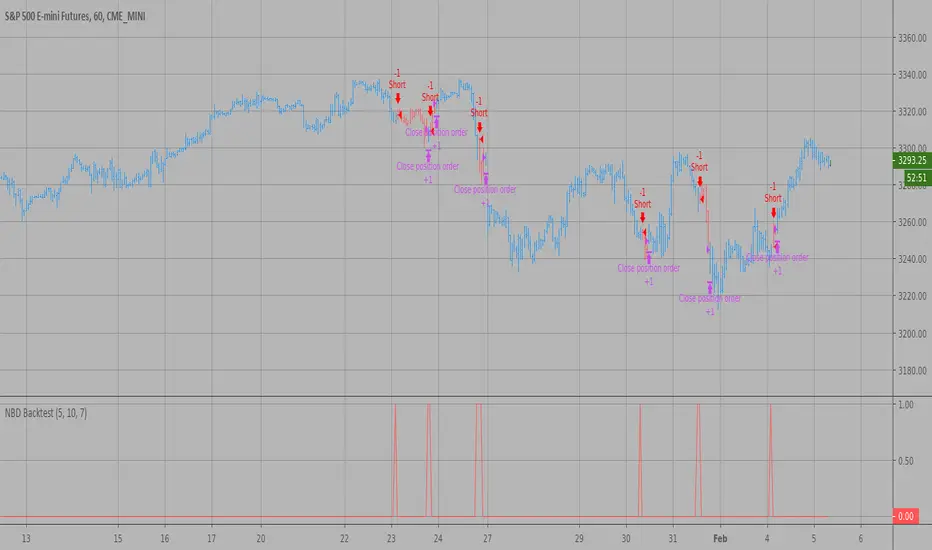
N Bars Down Backtest Evaluates for n number of consecutive lower closes. Returns a value of 1 when the condition is true or 0 when false. WARNING: - For purpose educate only - This script to change bars colors.Strategi Pine Script®oleh HPotter55
N Bars Up Backtest Evaluates for n number of consecutive higher closes. Returns a value of 1 when the condition is true or 0 when false. WARNING: - For purpose educate only - This script to change bars colors.Strategi Pine Script®oleh HPotter68
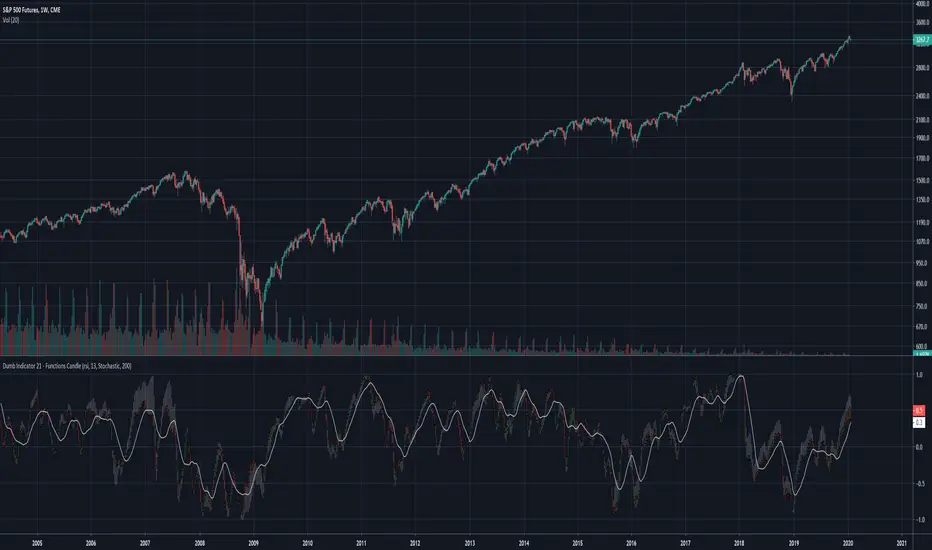
Dumb Indicator 21 - Function's Candlestick Bar's StyleThe idea is help traders to see the patterns and levels from a different point o view. This script create candlestick using the opening, high, low and close price as source on your favorite function. It's very simple to use: Select a function in the drop box list, the number of bars length, check or uncheck the boxes to treat source as logarithm, smooth, and if you want to plot the SMA from the results. To make a deeper analysis, you can select to plot the candles in Stochastic or in Percent Rank way. The Stochastic and Percent Rank plot will show how far the price is close to highest or lowest value of the source from the last "Stochastic Length" number of bars. Some functions with different names can plot the same results. This indicator works on every kind of market, but you will need to find the best function and length to use. Please, if you find anything good with this, share to everyone. Penunjuk Pine Script®oleh RodrigoKazuma44129
Williams Fractals - 3 or 5 Bar Wanted to give a user the option to choose between the original 5 bars in the Williams Fractal or 3 bars. Penunjuk Pine Script®oleh JoshuaMcGowanTelah dikemas kini 55627
Leledc Exhaustion Bar V4 PLUSLeledc Exhaustion Bar indicator created by glaz converted to Pine 4, plotshape was added.Penunjuk Pine Script®oleh DreadblitzTelah dikemas kini 1414866
Static Bars Back LineSimple indicator to color the background of a certain number of bars back.Penunjuk Pine Script®oleh BitcoinJesus-Not-Roger-VerTelah dikemas kini 46
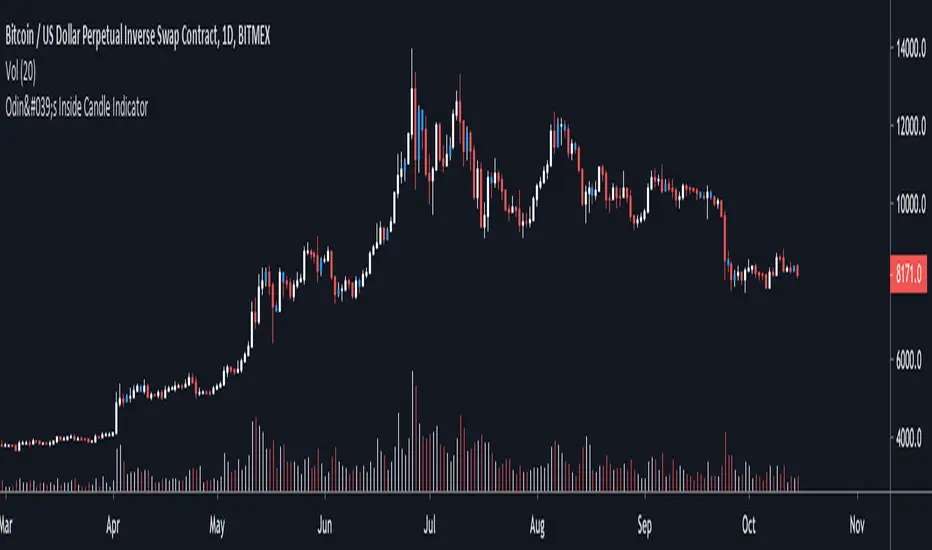
Odin's Inside Bar IndicatorA simple indicator that identifies "inside bars" by painting them blue. An inside candle is a candle that has a lower high and higher low than the previous candle. I like to use it on the daily chart to find areas of price compression that lead to a breakout. The price then often trends in the direction of the breakout. Especially powerful when combined with other market structure analysis. Cheers.Penunjuk Pine Script®oleh odinofcrypto125
Multiple SMAs + X-Bar High/LowWhen starting my daily analysis, I typically open a daily chart and check where the price is compared to several SMAs, as well as check the high/low of today and the 10-day high/low. This indicator was designed to save chart space as well as make finding the highs and lows more efficient. Everything is adjustable, so you don't have to stick with my 10-bar rule.Penunjuk Pine Script®oleh JoshJaySalazar40
vline() Function for Pine Script v4.0+It's been a long time coming, but here is a versatile vline() function applicable to PSv4.0+ utilizing line.new(). I decided to finally figure this out at the request of another member recently. I have been waiting myself for months, but it's now time for an idea who's time has come to unleash upon planet Pine Script. It's a handy little function I believe will be very useful in the future. It only requires 4 parameters of BarIndex, Color, LineStyle, and LineWidth. Make sure you place it in an appropriate if() block to use it properly. As displayed above, this plots every 10 bars using a conditional statement employing the rarely used modulus operator. Use it as you please, this is free code to implement into your new Pine projects. I don't require an credit for any one to use this function. I simply don't want any credit. I would however like to see some great ideas utilizing this when I randomly and accidentally come across them in the public library. I didn't know where to put this script, so I just tossed into the "Trend Analysis" category. I'm pondering we members need a "Miscellaneous" category some time in the future. The comments section below is solely just for commenting and other remarks, ideas, compliments, etc... regarding only this indicator, not others. If you do have any questions or comments regarding this indicator, I will consider your inquiries, thoughts, and concepts presented below in the comments section, when time provides it. When my indicators achieve more prevalent use by TV members, I will implement more ideas when they present themselves as worthy additions. As always, "Like" it if you simply just like it with a proper thumbs up, and also return to my scripts list occasionally for additional postings. Have a profitable future everyone! Penunjuk Pine Script®oleh ImmortalFreedomTelah dikemas kini 3030294
Current Price Bar LabelA simple Indicator to display the current price of the asset above the current bar. It shows a green label if the close is equal or greater than the open, red otherwise. Penunjuk Pine Script®oleh Westy_22108
Differential Price Counter for Bullish/Bearish BarsThis script can show the cumulative differential price of both bullish/bearish bars with the 0.1pip precision for the currencies having five decimal precision. However, can be useful for all markets.Penunjuk Pine Script®oleh SuYan2221
Previous Day High and Low Breakout Bar ColorPrevious Day High and Low Breakout Bar ColorPenunjuk Pine Script®oleh ceyhunTelah dikemas kini 66555
Inside BarsMark Inside Bars with a triangle above the calendar. This indicator supports having different colors and alerts for 1, 2 or 3 consecutive inside bars.Penunjuk Pine Script®oleh code_b11236
High Bar Color >7 ATRHighlights bar when over 7 days ATR (up or down)Penunjuk Pine Script®oleh FortFFX41
Color Bars VolumeThe bars are colored exclusively according to volume average: Ultra high Volume = Volume > Mean Volume * 3.5; Very high Volume = Volume > (Mean Volume * 2.5) and Volume <= (Mean Volume * 3.5); High Volume = Volume > (Mean Volume * 1.5) and Volume <= (Mean Volume *2.5); Medium Volume = Volume > (Mean Volume * 0.5) and volume <= (Mean Volume *1.5); Low Volume = (Volume > (Mean Volume * 0.5).Penunjuk Pine Script®oleh alissonlucrecio1186
candle barsI am trying to count volumes over a period of time. So that turned out awkwardly. Why is it, I do not understand. I did not see anything special about this topic. If someone digs on this topic, I ask for links. Why publish, well, if I take something from the community, I have to return something). Russian himself, so google translation. With zeros do not know on input. By default I enter numbers of candles, like drawsPenunjuk Pine Script®oleh chartmen1113