Calculated projected value one bar aheadcalc_proj - a some calculated value is plotted one bar ahead the current last bar. This was requested here getsatisfaction.comPenunjuk Pine Script®oleh vitvlkv102
Impulse BarsDetect impulse bars, with is a bar that is greater than the last 10 bars.Penunjuk Pine Script®oleh nohros4422
Net Volume BarsFlip the sign on down volume bars; negative net volume bars will appear below 0.Penunjuk Pine Script®oleh tsmmob44352
Average True Range - without open barBasic ATR without the current open bar in progress, it calculates the closed bars within the chosen ATR PeriodPenunjuk Pine Script®oleh TVUser388576825
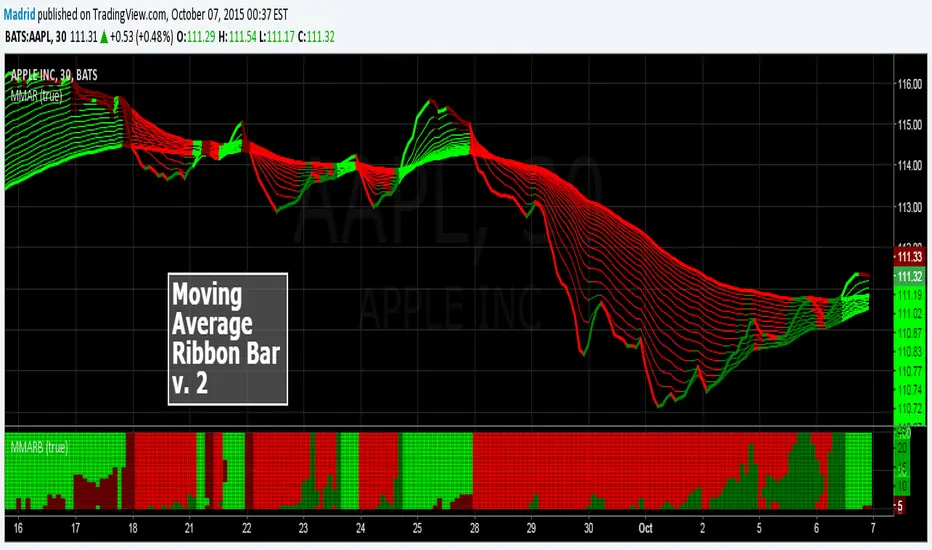
Madrid MA Ribbon Bar v2This script is the second version of the Moving average Ribbon Bar, a companion study of the MA Ribbon. In this version the display is changed, instead of lines, it display the results in stacked bars, making it more user friendly and allowing it to be expanded or contracted without loosing visual continuity. Penunjuk Pine Script®oleh MadridTelah dikemas kini 2424 4.9 K
Binary option trading by two previous barsThis simple script uses the idea of inertia of the market. if 2 previous candles have the same color, current meant to have that too. Following this signal is equal to buying a binary option on the start of the bar (week here). Signals are shown as arrows on the series. The color of the bar shows the outcome of the current option: yellow is success, black is failure. The same outcomes are at the bottom of the chart. The blue line is the total revenue of all options so far. Can be used as template for strategy simulation.Penunjuk Pine Script®oleh radixvinni1010 1.3 K
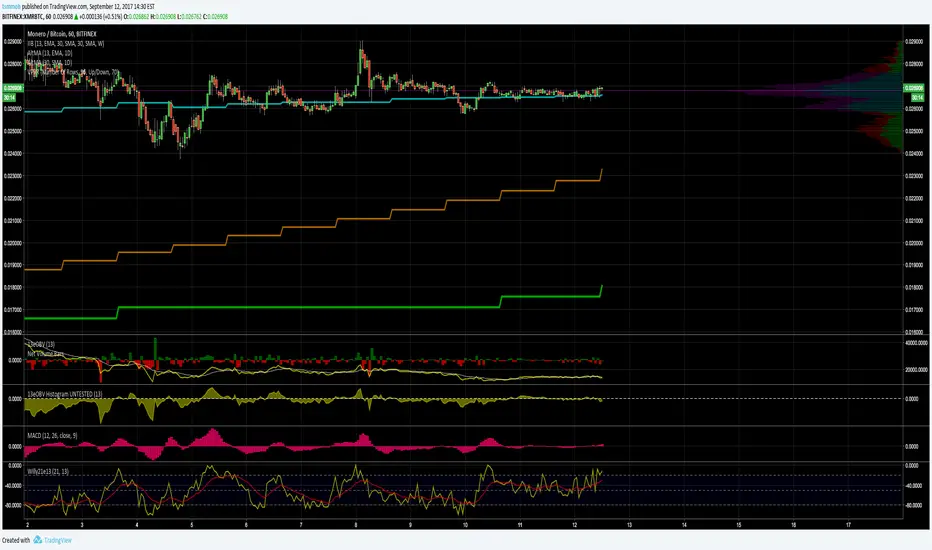
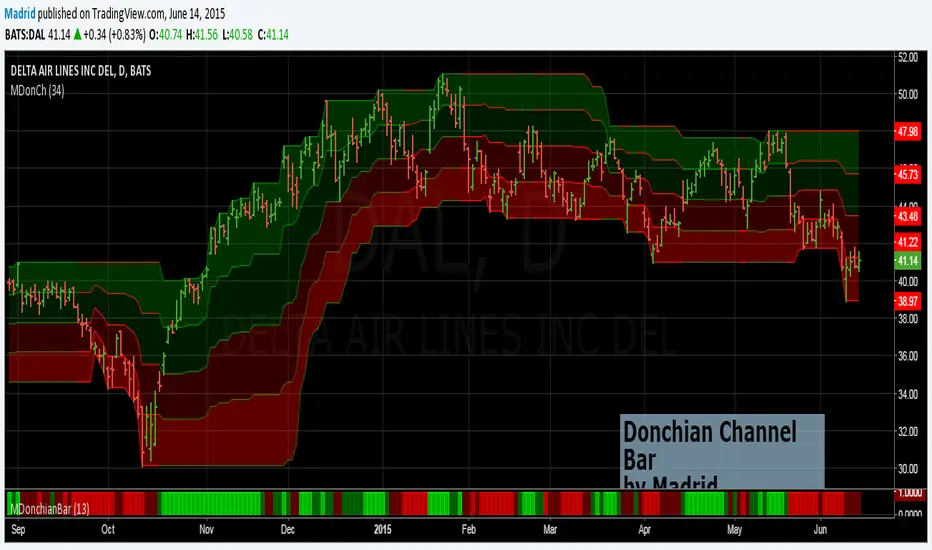
Madrid Donchian BarThis is the companion bar of the Donchian Channel study. This bar at the bottom of the screen depicts the detrended position of the closing price. This is useful to reduce clutter on the screen and locate the position of the closing price at a glance. Lime ; Extremely Bullish Green : Bullish Maroon : Bearish Red : Extremely BearishPenunjuk Pine Script®oleh Madrid11497
Gann N-Bar Swing ChartWhat it shows: - Solid swing lines connecting confirmed turns (green=upswing, red=downswing) - Dashed line for the active in-progress swing - H/L labels at each confirmed turn (High/Low) - Bar coloring by current swing direction - Swing N input in settings to toggle between minor (1), intermediate (2), and major (3) swings Note: line/label count is capped at 500 each by TradingView — on long charts, oldest markers auto-delete. Penunjuk Pine Script®oleh abrillant2313
MA Mix Cloud (Short + Long) + Trend Lines + Bar ColorMA Mix Cloud (Short + Long) + Trend Lines + Bar Color A dual-cloud trend visualization indicator built on a blended moving average model called MA Mix. Instead of relying on a single moving average type, this script combines multiple MA calculations to reduce bias and create a more balanced and adaptive trend representation. Core Concept – MA Mix MA Mix is calculated as the average of six different moving averages: SMA (Simple Moving Average) EMA (Exponential Moving Average) WMA (Weighted Moving Average) VWMA (Volume Weighted Moving Average) HMA (Hull Moving Average) RMA (Running Moving Average) By blending these, the indicator balances smoothness and responsiveness, helping reduce the weaknesses of any single MA type. Features Short Cloud Default: 20 / 60 lengths Designed to capture short-term trend direction and entry timing. Long Cloud Default: 100 / 200 lengths Used for higher-timeframe trend bias and market structure. Trend-Colored Lines Fast ≥ Slow → Bullish color Fast < Slow → Bearish color Instant visual confirmation of current trend state. Cloud Visualization The area between Fast and Slow MA Mix lines is filled: Bullish trend → Bull color fill Bearish trend → Bear color fill Both Short and Long clouds can be enabled or disabled independently. Candle Coloring Logic Candles are colored based on their position relative to the selected cloud. Selectable reference: Short Cloud Long Cloud Logic: Close above cloud → Bull color Close below cloud → Bear color Inside cloud → Neutral color This helps visually separate trending conditions from consolidation. Example Usage Use Long Cloud for overall market bias Use Short Cloud for entry timing Take longs only above the cloud Take shorts only below the cloud Stay cautious when price is inside the cloud This structure allows multi-timeframe thinking within a single chart.Penunjuk Pine Script®oleh Zippo7772
Reversion Zone Index with bar colos by MadScientistWhat is the Reversion Zone Index (RZI)? The RZI is a smart trading tool that helps you spot when the market has moved too far, too fast, and is likely to snap back (revert) to the average price. It combines three powerful indicators into one easy-to-read system: Momentum (Speed): How fast is price moving? (CCI) Volatility (Stretch): Is price stretched outside its normal range? (Bollinger Bands) Market State (Chop): Is the market trending or just chopping sideways? (Choppiness Index) How to Read the Colors (The Heatmap) The most important feature of this version is the Color System. You can see these colors on the indicator line itself, and optionally on your main price candles. Think of it like a Temperature Gauge: 🟢 Bright Green (Cold / Oversold): Meaning: The market is "cheap" or extended to the downside. Action: Look for Buy opportunities. Candles: If you turn on the toggle, your candles will turn bright green when the price is in this zone. 🔴 Bright Red (Hot / Overbought): Meaning: The market is "expensive" or extended to the upside. Action: Look for Sell opportunities. Candles: If you turn on the toggle, your candles will turn bright red when the price is in this zone. ⚪ Grey/Faded (Neutral): Meaning: The market is in a normal range. Action: No extreme conditions; standard trading applies. The Signals (Arrows) The indicator prints arrows to tell you exactly when the momentum has shifted: ▲ Green Triangle (Buy Signal): Appears when the RZI was in the Green Zone (Oversold) and has just crossed back up. This confirms the "snap back" has started. ▼ Red Triangle (Sell Signal): Appears when the RZI was in the Red Zone (Overbought) and has just crossed back down. This confirms the price is starting to drop. How to Use the Settings "Color Candles based on RZI?": Check this box to paint your price bars Green or Red based on the indicator. Uncheck it to keep your normal candle colors. Smoothing Length: Increase this number if you want fewer, smoother signals. Decrease it for faster, more frequent signals.Penunjuk Pine Script®oleh mhpr199111
9 EMA Full Candle Highlight (Bars Only)This indicator highlights individual candles that close completely above or completely below the 9 EMA. A candle turns yellow only when the entire candle (body and wicks) is fully on one side of the 9 EMA: • Fully above EMA → low is above the 9 EMA • Fully below EMA → high is below the 9 EMA Candles that touch or cross the EMA are ignored. Only the specific candle bar is colored — no background shading, no columns, and no extra signals — keeping the chart clean and distraction-free. Purpose Designed for simple, rule-based trading with minimal decisions. It visually marks strong momentum candles while filtering out chop around the EMA. How to use • Yellow candle above → bullish momentum • Yellow candle below → bearish momentum • No highlight → no clear edge Best used on: • 5-minute charts • SPY / highly liquid ETFs • Trend-following strategiesPenunjuk Pine Script®oleh myttthew3
2 Bar Strategy + Fib EntryCustom indicator for my 2 bar strategy, bullish or bearish waring setup signal included and entry zone Penunjuk Pine Script®oleh dansullivan3309
VJ TRIGGER BARTrigger Bar in the consolidation predicting a breakoutPenunjuk Pine Script®oleh velprakashj2
OU Depth of Market (DOM) Including Per Bar Volume ShapesWork in progress visualizing the volume per bar of a security, set for 15 second timeframe for ES NQ futures. Penunjuk Pine Script®oleh CallMeOptionPls0
Fair Value Gap Bar Locked Signals Fair Value Gap – Bar Locked + Signals (Stable)This is a clean Smart Money Concepts (SMC) indicator focused exclusively on detecting and tracking Fair Value Gaps (FVGs) with automatic mitigation tracking and trade signals. What It DoesIdentifies imbalances in price action (gaps where there's no trading overlap) and tracks them until they're "filled" (mitigated). These gaps represent areas where institutional orders may return to fill the inefficiency.Core ConceptsPenunjuk Pine Script®oleh jmslimus6
Volume footprint 15 bars by MH RaajThis multi volume data indicator is as same as the Volume footprint of previous version just difference is, it shows only the data of last 15 bars in classic mode of volume footprint.Penunjuk Pine Script®oleh MH_Raaj35
Engulfing + Pinbar + Inside BarThis indicator combines three powerful candlestick patterns in one tool: Engulfing Candles (Bullish & Bearish) Pinbars / Hammers (Reversal signals) Inside Bars (Consolidation + breakout setup) Each pattern can be enabled or disabled individually through the settings panel. Candle colors and labels help you quickly identify strong price action zones.Penunjuk Pine Script®oleh MG_108Telah dikemas kini 8
Inside Bar by bilalThis indicator will display inside bar candle to represent the value candle of the zone for any timeframe.Penunjuk Pine Script®oleh bilalbaazworld1
Gold Pin Bar Pivot Alerts - FixedThis script is designed for the high volatility of Gold (XAU/USD). It identifies Pin Bars with body less than 30% of the candle's total range, and the candle occuring at a structural Pivot High or Pivot LowPenunjuk Pine Script®oleh olushekun45
Surprise volume bar This is to detect the bar that is 3 times over the 60 average volume.Penunjuk Pine Script®oleh emhwang36
GKZ 3-Bar Compression ReversalThis one is NOT an indicator but a strategy Simple rules Weekly close is above 30 EMA weekly for atleast 3-5 weeks ( keeping fans of Stan Weinstein happy) following assumptions today is Day T , SO T-2 was a red candle T-1 was a green candle but its high is lower than T-2 and its close is above T-2 T ( confirmation candle): T's high is higher than T-2 and T-1 and its close is higher than T-1 aiyyo, this is so confusing...how do i find such stocks G? Drummmrolllllll : chartink.comStrategi Pine Script®oleh GKLDH69813
Volume Breakout % [No Bar Color]This indicaot use for all user when in 5 min chat. all time fream not wrok.Vol bar numbser of calculation .Penunjuk Pine Script®oleh DEVOLS1
Kai simple mother bar Identify mother bar break candles based on price action and above-average volume, helping to detect breakout points in the direction of the trend as well as potential reversals.Penunjuk Pine Script®oleh SimpleV4