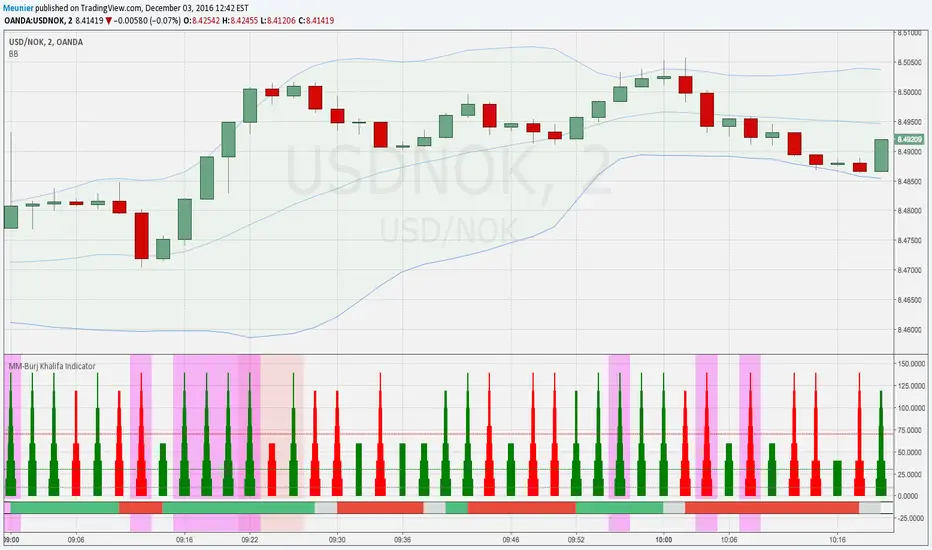
MM-Burj Khalifa Indicator
This indicator uses several signals to visualize a "perfect candle" to enter a trade.
It colors the background to identify the zones of interest (multiple configurable high or low RSI zones). Underlying is a trendbar with the current MACD direction. It's possible to tweak the indicator with a lot of options in the settings section (e.g. for which period you want a rising DM+-signal, etc.)
The indicator is using signals of:
--MACD
--RSI
--PVT
--ATR
--AD and DMI+/DMI-
When all 7 criterias are met it highlights the candle.
It also creates different colums with different height and width, so that you can see which signal is OK and which is maybe missing. When all signals are on GO you'll see a Burj-Khalifa-like figure. If not all signals are on GO you'see crippled versions.
To be clear:
it's not intended to detect trends or supertrends or reversals. It's purpose it's just to decide if this current candle is really going in the right direction. It doesn't prevent upcoming reversals in the opposite direction.
The Burj-Khalifa indicator could help to confirm the entry point of an trade which was already planned.
I'll come up with a more detailed documentation.
Cari dalam skrip untuk "binary"
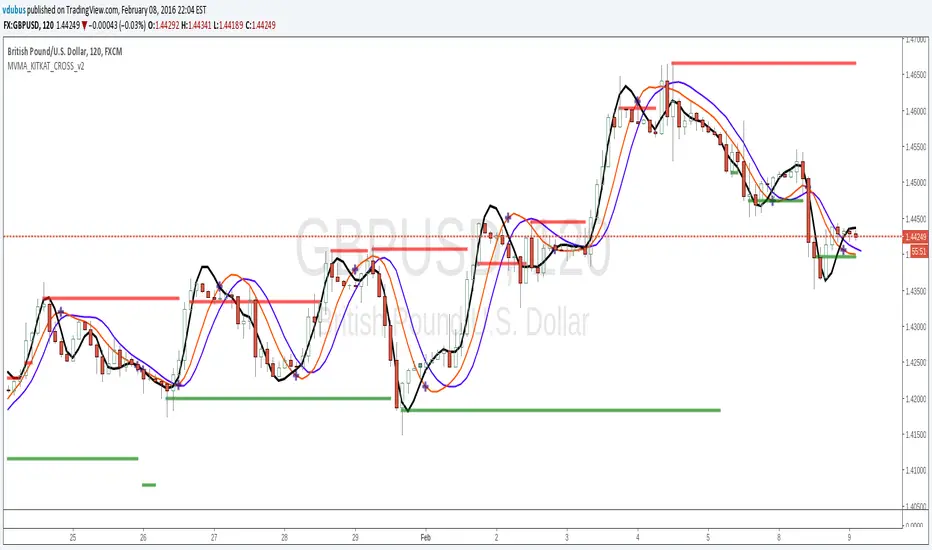
Momentum VMA KITKAT CROSS v2*Update Momentum VMA KITKAT CROSS v2
triple MVMA (Hull MA) with integrated Kitkat
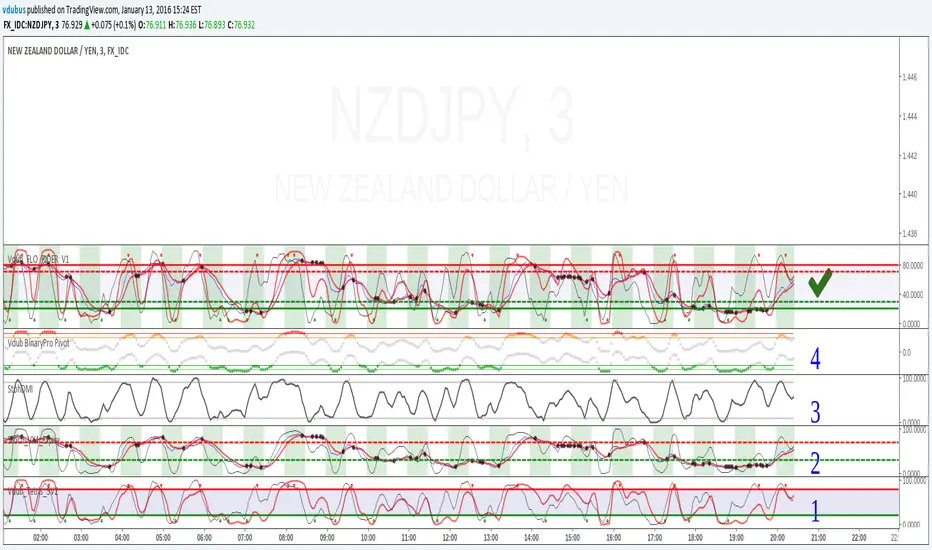
Stoch_VX4 Expiry / UpdateStoch_VX3 Update
Stoch crossover +
Fast stoch / Tops & bottoms
BO background expiry

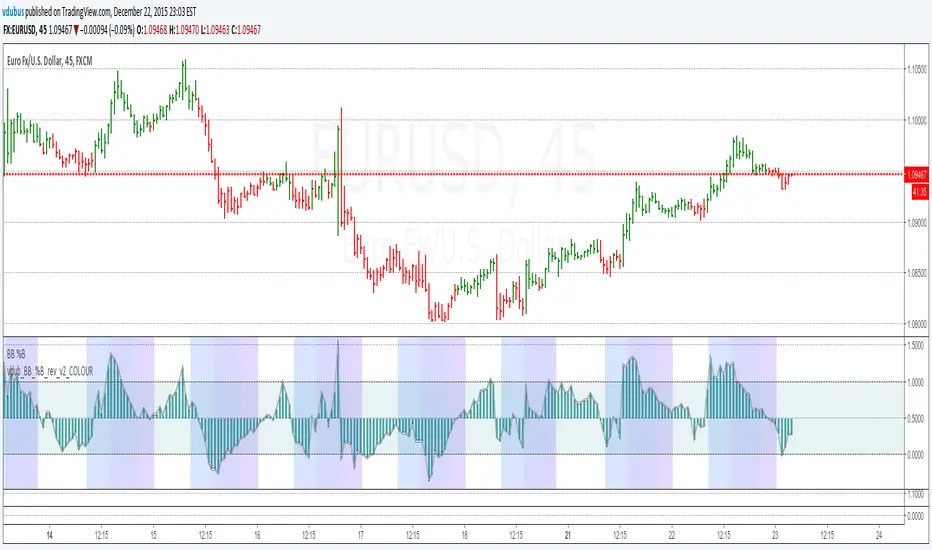
Vdub_BinaryBands_v1Combined 3 x Bollinger Bands With BUY & SELL zones
EMA,
Wma
SMA
Multiplier adjustment


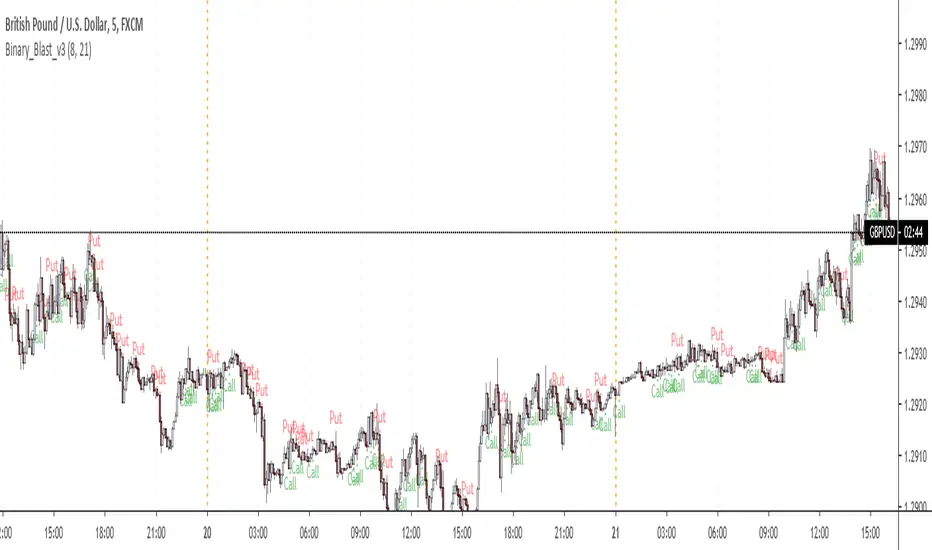
Binary_Blast_v3_directional biasThis is not my script.
The original was done by pizer.. I have just added an option to include a fast moving average and a slow moving average to filter the direction....implying should I look for "Put" or "Call"
Kay_StochasticRSIThis is a different version of Stochastic RSI. the only difference is the use of variable moving average by Lazybear instead of regular sma for K smoothing.
Its purely an experiment. I am not a professional trader but an enthusiastic programmer trying different indicator combination to see different results.
Criticizing and negative comments will be gracefully accepted. :)
Appreciation will be even more. :)
Binary Options v4.0This script fixes the situation of consecutive losses from single-direction trades through window logic

Binary ComboThis script combines Stochastic Divergence and WaveTrend Crosses.
Stochastic Divergence may be useful for seeing a shift in momentum before the price action reflects it.
WaveTrend gives us context to the short term trend.
You can combine these together to find good entries.


Binary Blast v2 Pipizer1 bar strategy after the signal bar closes. Maximum consecutive loses 5 found in back test!

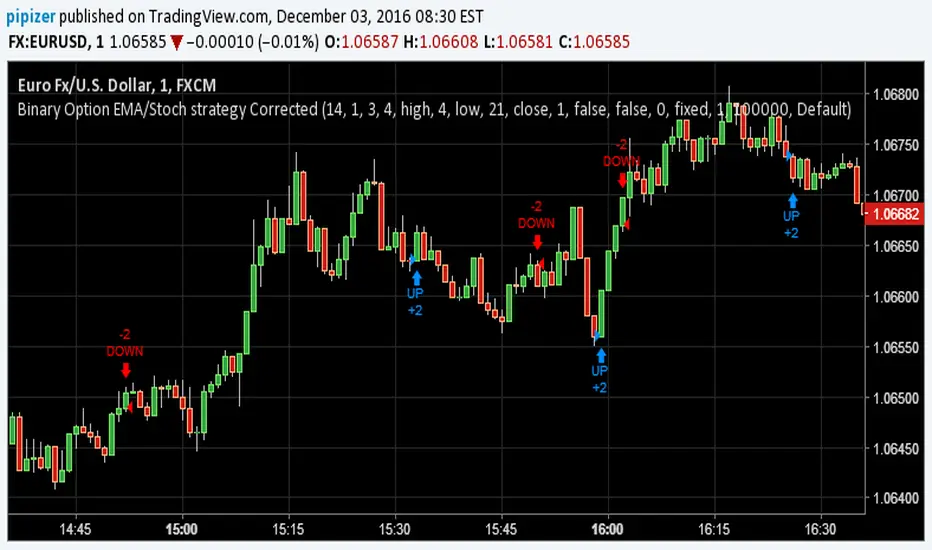
Binary Option EMA/Stoch strategy CorrectedPrevious indicator was flawed I mistakenly misplaced the script which was giving opposite signals. This on is corrected version of previous EMA/Stoch strategy.