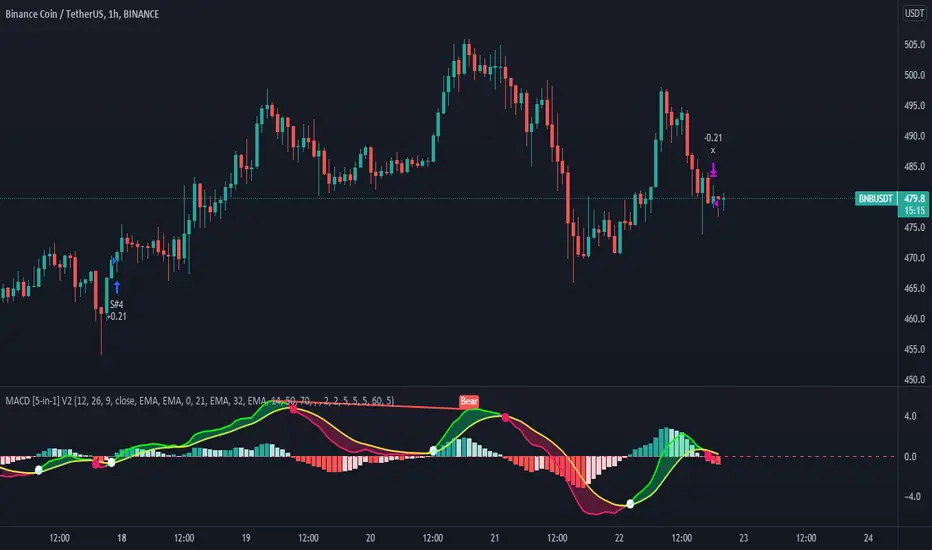
MACD 5 iN 1 [Pro-Tool]introducing MACD Which has different indicators inside,
And not only that, five different strategies have also been included in this indicator.
Strategy №1:👉 MACD Crossover Signal Line
Strategy №2:👉 MACD Crossover + MACD Overbought Section (for ignore false Crossover signals)
Strategy №3:👉 MACD Crossover + Market Close should b greater tha MOVING AVERAGE
Strategy №4:👉 MACD Crossover + Market Close should b greater tha MOVING AVERAGE ZONE
Strategy №5:👉 MACD Crossover + RSI Close should b greater tha 50 Level (or whatever level you choose)
also 5 types of MOVING AVERAGE you can choose
1: Simple Moving Average ( SMA )
2: Exponential Moving Average ( EMA )
3: Weighted Moving Average ( WMA )
4: Volume Weighted Moving Average ( VWMA )
5: Relative Moving Average (RMA)
and you can customize MACD Colors + Widths + Signals and MACD lines, and also can Hide or Unhide Histogram / Cross Sign / MACD Zone Color
hope so you like it, 🥰
Investing and trading in cryptocurrencies is very risky, as anything can happen at any time.
***NOT FINANCIAL, LEGAL, OR TAX ADVICE! JUST OPINION! I AM NOT AN EXPERT! I DO NOT GUARANTEE A PARTICULAR OUTCOME I HAVE NO INSIDE KNOWLEDGE! YOU NEED TO DO YOUR OWN RESEARCH AND MAKE YOUR OWN DECISIONS! THIS IS JUST EDUCATION & ENTERTAINMENT! USE ALTCOIN DAILY AS A STARTING OFF POINT!
Cari dalam skrip untuk "bitcoin"
SMA Offset StrategyThis strategy uses simple moving averages and some math to determine buy/sell points. We keep a SMA 100 day line as our basis for our offset. If the close price is below the line, we choose our open position based on how low below the line it is goes, this value (Low Offset) is a percentage and can be configured by the user. Same for closing your position, when the close is above our SMA 100 line, we determine how high above the line before selling. If we try to sell too early (while the price is still rising), the trailing stop loss will kick in. Backtested with Bitcoin and Ethereum.
Configurable variables:
SMA Fast (default is 14 days)
SMA Slow (default is 100)
SMA Reference (default is 30)
Low Offset % (default is 0.001)
High Offset % (default is 0.0164)
Order Stake % (default is 0.96)
Trailing stop loss % (default is 1.35)

Time of Day and Day of Week Buying and Selling StrategyThis strategy allows you to back test longing or shorting or do nothing during time increments of 30 minutes for various days of the week. For example if you want to see if every Saturday if Bitcoin dropped in value from 1600-7000 UTC, this script will allow you to test that.
Make sure you are in the 30 minute time frame while viewing the performance and trade history.

Day of Week Custom Buy/Sell StrategyThis strategy was made for bitcoin and allows you to back test longing or shorting for various days of the week. The price may tend to go in one direction or another for each week day, and this strategy allows you to test days across a range of dates to capitalize on this.
Make sure you are on the daily time frame while viewing the performance and trade history to ensure the script works as intended and you have the most historical data as possible from Trading View.

Multi-X by HamidBoxHello to All, introducing Multi Types Crossover strategy,
simply the best way of trading with Crossover and Crossunder Strategy, How it Works???
I added 5 types of Moving Averages,
1: Simple Moving Average ( SMA )
2: Exponential Moving Average ( EMA )
3: Weighted Moving Average ( WMA )
4: Volume Weighted Moving Average ( VWMA )
5: Relative Moving Average (RMA)
With this indicator, you can do scalping, You can trade not only with similar types of Moving Average indicators but also with different types of Moving Average indicators.
what is mean? like: Normal Condition is:
( Simple Moving Average ) Crossover to ( Simple Moving Average ), SMA x SMA
( Exponential Moving Average ) Crossover to ( Exponential Moving Average ), EMA x EMA
But we can Crossover with:
( Exponential Moving Average ) Crossover to ( Simple Moving Average ), EMA x SMA
( Simple Moving Average ) Crossover to ( Weighted Moving Average ), SMA x WMA
( Weighted Moving Average ) Crossover to ( Weighted Moving Average ), WMA x WMA
( Simple Moving Average ) Crossover to (Relative Moving Average), WMA x RMA
and also I added Moving Average ZONE in this tool, What does it work???
The zone will tell us what type of direction the market has, if the market is above the zone, it's mean we have a Bullish Trend, and if the market is below the zone, it means the market has a Bearish Trend,
so if you want to play on the safe side, never trade when the market is in Bearish Trend, and if you want to play on aggressive mood, you can skip Moving Average Zone section.

Trend Bounce [racer8]I discovered this mechanical trading system titled "This Algo Strategy Has Only 3 rules and 62% Win Rate".
I coded the trading system on Tradingview...and now I am introducing it to you guys.
I modified the system so that it has both buy & sell signals.
I've tested it repeatedly in different markets on TV including stocks, currency pairs, bitcoin, and commodities...and it works!
A buy signal is generated whenever the current close is below the previous 7-day low and the current close is above the 200 period moving average.
A sell signal is generated whenever the current close is above the previous 7-day high and the current close is below the 200 period moving average.
The system also has a 2-ATR stop loss which I coded.
This system is unique in that it has both trend-following and reversal elements in it.
The system trades short-term reversals while obeying the long-term trend.
Essentially, you are buying the dips of bullish trends! & selling at the peaks of bearish trends!
Enjoy ♡

Double Bollinger StrategyFrom "Bitcoin Trading Strategies: Algorithmic Trading Strategies For Bitcoin And Cryptocurrency That Work" by David Hanson.
*Works better with 1hr time frame and some input optimisations.
"Double Bollinger Band Scalping System
Recommended Timeframe: 1 minute or 5 minute *
Required Indicators:
// - RSI with a length of 14 (default settings)
// - Bollinger band #1 settings: Length = 50, stDev = 1 Hide the basis/middle line (basis line not needed for this strategy)
Note: This is the slower bollinger band in the directions
// - Bollinger band #2 settings: Length 20, stDev = 1 Hide the basis/middle line (basis line not needed for this strategy)
Note: This is the faster bollinger band in the directions
Enter Long/Buy Trade When:
// - RSI is above the level 50
// - A candle closes above the top of the faster bollinger band
Enter a long when a candle then closes above the top of the slower bollinger band, and price is above the top of both bands
Place a stop loss under the low of the entry candle Example of a long trade using this strategy
Exit Long Trade When: A candle closes below the top band of the fast bollinger band
Enter Short/Sell Trade When:
// - RSI is below the level 50
// - A candle closes below the bottom of the faster bollinger band
Enter a short when a candle then closes below the bottom of the slower bollinger band, and price is below both bands
Place a stop loss above the high of the entry candle Example of a short trade using this strategy
Exit Short Trade When: Price closes inside the bottom of the faster bollinger band"

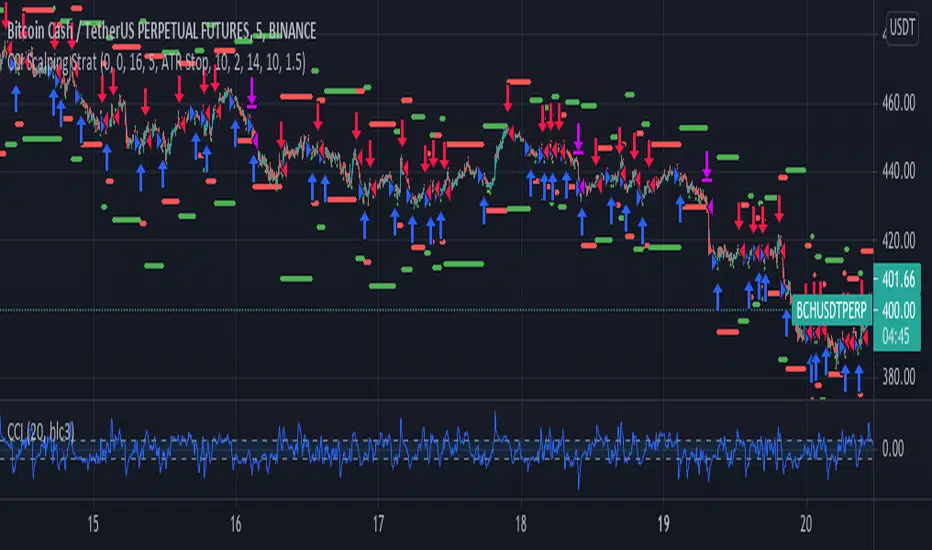
CCI Scalping Strategy---From the "Bitcoin Trading Strategies" book, by David Hanson---
After testing, works better with an ATR stop instead of the Strategy Stop. This parameter
can be changed from the strategy Inputs panel.
"CCI Scalping Strategy
Recommended Timeframe: 5 minutes
Indicators: 20 Period CCI, 20 WMA
Long when: Price closes above 20 WMA and CCI is below -100, enter when CCI crosses above -100.
Stop: Above 20 WMA"
BTC Volatility Band StrategyThis script/strategy is a pullback system designed for securities with high volatility so naturally Bitcoin is an excellent choice for trading this. This could be used both on a daily chart or on lower timeframes (I found good results on 3hr timeframe but haven't tested it on anything under 1hr).
A volatility band is created by comparing the candle close price of the previous 2 candles and and it uses this change in price to create a moving average. A band is wrapped around the moving average with a standard deviation of 1 for the inner band and 2 for the outer band. If the price is above a pre-set MA (moving average filter) then it is determined we are in an uptrend so the strategy will issue a buy signal when we are in an uptrend and there is a pullback which causes the lower inner deviation band to be spiked, but if the price continues and falls through the outer deviation band then a buy signal will not issue as this detriments that the volatility spike is to great. You can see a spike "buy" event occur on the indicator where the background is coloured green. For a short/sell then there will be a spike on the upper inner band and we are below the pre-set MA filter, for this it shows with red background on the indicator.
The user can change the date range they wish to test, the moving average period for the volatility tracking and the inner and outer band deviations. On BTC I left the inner deviation and outer deviation bands on standard settings but found the 3 period volatility tracking to be good for trading 1 day chart and the 5 period volatility tracking good for the 3hr chart. Since this is not a buy and hold strategy then for trading you would probably want to stick with the most liquid coins so you can get in and out very fast on any exchange. If you wanted to tray this on less volatile markets then changing the inner deviation band to ~0.75 would work okay in various futures markets likely stocks as well. The take profit and stop loss levels are based on a multiple of the trading range looking back the past 7 candles.
Attached result is trading 1 BTCUSDT contract on Binance.

Ichimoku Cloud Strategy Long Only [Bitduke]Slightly modificated and optimized for Pine Script 4.0, Ichimoku Cloud Strategy which, suddenly, good suitable for the several crypto assets.
Details:
Enter position when conversion line crosses base line up, and close it when the opposite happens.
Additional condition for open / close the trade is lagging span, it should be higher than cloud to open position and below - to close it.
Backtesting:
Backtested on SOLUSDT ( FTX, Binance )
+150% for 2021 year, 8% dd
+191% for all time, 32% dd
Disadvantages:
- Small number of trades
- Need to vary parameters for different coins (not very robust)
Should be tested carefully for other coins / stock market. Different parameters could be needed or even algo modifications.
Strategy doesn't repaint.

TEMA Cross +HTF BacktestThis is a follow up to a previous script release called " TEMA Cross Backtest ".
This new strategy uses two TEMA crosses, one for trend direction, one for entry and exit. The entry and exit parameters are the same as the previous script. The trend direction is based on a user configurable higher timeframe TEMA cross which determines when to take longs or shorts. When the indicator is purple, it is looking for shorts, and when it is yellow, it is looking for longs. The background of the chart is colored accordingly to see the trend direction at a glance.
The default settings are the ones I have found produce the highest backtest results. The backtest is set by default to use a $500 account, and use $500 for every entry and exit, no matter the direction or overall profit/loss.
Parts of script borrowed from other public scripts.

Technicals Rating Strategy v420Ichimoku, HMA, RSI, Stoch, CCI, MACD, Technicals Rating Strategy is a trading Bot that looks at these chosen indicators and assigns a value to each, then calculates the result of adding each indicators result value to a overall rating, which is then compared to a user set level. Here seen on Bitcoin, it has the broker fee included in the testing result. If you choose to use it on Forex etc, perhaps remove the broker fee which is unrealistic for FX trading.
It has a Win/Loss ratio of only 40% wins, but it catches the big moves and thats the main thing, so if ELON MUSK had of used this strategy instead of BUY and HOLD, he could of made 700% instead of 7% (as is, may, 2021)
Mainly intended for use as Automated TRADE BOT.
(imagine if Elon Musk did use this bot with his 1.3 billion $ worth of BTC, the drawdown would be like, half a billion or something haha (p.s.- use smaller lotsize % to get smaller drawdown, but then smaller profit....) )
For use with any pair and timeframe. In fact there is a timeframe setting to set the strategy to look at alternative timeframe from chart, but as default will just be set to charts timeframe.

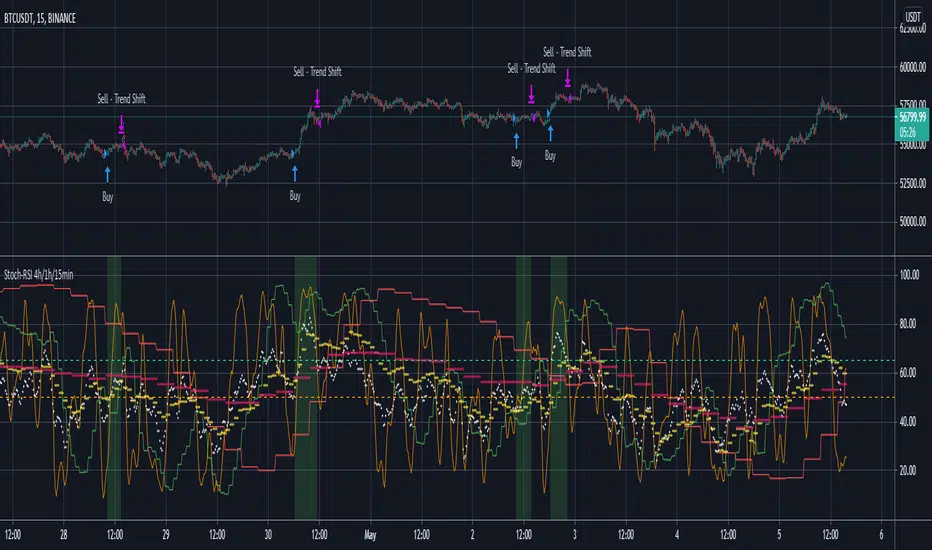
Stoch-RSI 4h/1h/15min!!!! Note: Run this on the 15min timeframe (Important) !!!!
Note the default settings on this indicator are best for BTC/USDT. For other pairs it might take some fiddling with variables to get a useful result (if a useful result is obtainable with the selected pair)
Generally, select between the options (RSI/Stoch) and (15min/1hour) and (1hour/4hours) - to find a strategy backtest result that is worth considering.
Only long positions are considered here (I tried shorts but could not get a credible backtest result with this approach).
This is an indicator which looks at RSI and StochRSI on the 15min, 1hour and 4hour timeframe.
The user can select a 15min/1hour option (RSI/Stoch) and then also a 1hour/4hour option (RSI/Stoch).
So there is one selection from a lower (15min/1hour) timeframe and another selection from a longer (1hour/4hour) timeframe.
The general idea is to, consider buying when, the lower timeframe (RSI/Stoch) is going upwards and also the longer timeframe (RSI/Stoch) is going upwards.
A good backtest result would suggest that the confluence in RSI/Stoch over the shorter and longer timeframes can estimate a good time to buy.
(Careful with a 1hour Stoch for the shorter timeframe variable as its possible to also select a 1hour Stoch for the longer timeframe variable.)
There are user set variables that can be set to avoid a buy signal, if either the lower or high timeframe variables are greater than.
For example, buying when a rsi/stoch is >65% might not be advisable as the rsi/stoch is most probably due for a downswing when above this value.
The strategy closes a position when either the shorter or longer timeframe variables no longer are going up.
There is also a take profit % which can be set to exit trades at a given %.
The default values on this indicator tool are for bitcoin, which shows a reasonable backtest result. - worth sharing on tradingview.
Please do get in touch for any additional information/suggestions.
Sincerely,
MoonFlag
Stochastic TrendDear community,
I've made another simple trading bot for you to use. This bot is based on the Stochastic Oscillator. It only produces long trades currently.
I changed the oscillation period to a much longer one, which in turn creates opportunities to trade long term trends.
The bot goes long when the Entry lines is crossed from below and it will close its long position once the Exit line has been crossed from above.

Excitement - Crypto Surfer v1For those of us who need more excitement in our crypto journey besides just HODL, here’s a simple crypto robot that trades on the hourly (1H) candles. I call it the Crypto Surfer because it uses the 20 and 40 EMAs (Exponential Moving Averages) to decide when to enter and exit; price tends to “surf” above these EMAs when it is bullish, and “sink” below these EMAs when it is bearish. An additional 160 SMA (Simple Moving Average) with slope-angle detection, was added as a bull / bear filter to reduce the sting of drawdowns, by filtering-out long trades in a prolonged bear market.
USER NOTES:
- This script will buy $10,000 USD worth of crypto-currency per trade.
- It will only open one trade at a time.
- It has been backtested on all the high market cap coins such as Bitcoin, Ethereum, Binance Coin, Polkadot, Cardano.
- It should be run on the Hourly (H1) chart.
- In general, this moving average strategy *should be* profitable for 80% to 90% of the coins out there
- The 160 SMA filter with slope angle detection is designed to stop you from going long in a bear market.
- It is recommended you copy this script and modify it to suit your preferred coin during backtesting, before running live.
- Trading is inherently risky (exciting), and I shall not be liable for any losses you incur, even if these losses are due to sampling bias.

RSI Trend CryptoDear community,
Today I want to present you one of my favorite and simple trading bots: The RSI Trend.
This bot is based on the RSI, which normally is used as a trend reversal indicator. However, here it’s used as a trend finding indicator, often with great success. This bot making long-only trades, which is quite successful in bull-markets like the one we’re currently in.
In case you want to use an emergency exit for your trade, toggle the Emergency Exit parameter. During bull-markets it’s better in the long term to keep this option off.
Currently the bot only makes one trade at a time (pyramiding = 1), for higher risk and higher rewards you can increase this parameter. More than 5 is not advised.
I’ve optimized this bot on 15min time frame. It has some decent results for most cryptos on this TF, feel free to test this out.
In case you want to hook this bot up to your exchange, feel free to edit the ALERT messages in the code.
Default Trading Rules:
Long: RSI crosses over 35
Close Long: RSI crosses under 75
Emergency Exit: RSI crosses under 10

ELIA MULTI INDICATORS STRATEGYExperimental multi indicators strategy, to catch right entry and avoid noise.
Each indicator included in the strategy, assume a value based on its status and because is a trend-follow strategy, some indicator value are higher then the other
Backtested on ETHUSDTPERP
BINANCE:ETHUSDTPERP

Scalping Dips On Trend (by Coinrule)Coinrule's Community is an excellent source of inspiration for our trading strategies.
In these months of Bull Market, our traders opted mostly on buy-the-dips strategies, which resulted in great returns recently. But there has been an element that turned out to be the cause for deep division among the Community.
Is it advisable or not to use a stop-loss during a Bull Market?
This strategy comes with a large stop-loss to offer a safer alternative for those that are not used to trade with a downside protection.
Entry
The strategy buys only when the price is above the Moving Average 50 , making it less risky to buy the dip, which is set to 2%.
The preferred time frame is 1-hour.
The stop-loss is set to be quite loose to increase the chances of closing the trade in profit, yet protecting from unexpected larger drawdowns that could undermine the allocation's liquidity.
Exit
Stop loss: 10%
Take Profit: 3%
In times of Bull Market, such a trading system has a very high percentage of trades closed in profit (ranging between 70% to 80%), which makes it still overall profitable to have a stop-loss three times larger than the take profit.
Pro tip: use a larger stop-loss only when you expect to close in profit most of the trades!
The strategy assumes each order to trade 30% of the available capital and opens a trade at a time. A trading fee of 0.1% is taken into account.

Momentum Strategy (BTC/USDT; 1h) - MACD (with source code)Good morning traders.
It's been a while from my last publication of a strategy and today I want to share with you this small piece of script that showed quite interesting result across bitcoin and other altcoins.
The macd indicator is an indicator built on the difference between a fast moving average and a slow moving average: this difference is generally plottted with a blue line while the orange line is simply a moving average computed on this difference.
Usually this indicator is used in technical analysis for getting signals of buy and sell respectively when the macd crosses above or under its moving average: it means that the distance of the fast moving average (the most responsive one) from the slower one is getting lower than what it-used-to-be in the period considered: this could anticipate a cross of the two moving averages and you want to anticipate this potential trend reversal by opening a long position
Of course the workflow is specularly the same for opening short positions (or closing long positions)
What this strategy does is simply considering the moving average computed on macd and applying a linear regression on it: in this way, even though the signal can be sligthly delayed, you reduce noise plotting a smooth curve.
Then, it simply checks the maximums and the minimums of this curve detecting whenever the changes of the values start to be negative or positive, so it opens a short position (closes long) on the maximum on this curve and it opens a long position (closes short) on the minimum.
Of course, I set an option for using this strategy in a conventional way working on the crosses between macd and its moving average. Alternatively you can use this workflow if you prefer.
In conclusion, you can use a tons of moving averages: I made a function in pine in order to allw you to use any moving average you want for the two moving averages on which the macd is based or for the moving average computed on the macd
PLEASE, BE AWARE THAT THIS TRADING STRATEGY DOES NOT GUARANTEE ANY KIND OF SUCCESS IN ADVANCE. YOU ARE THE ONE AND ONLY RESPONSIBLE OF YOUR OWN DECISIONS, I DON'T TAKE ANY RESPONSIBILITY ASSOCIATED WITH THEM. IF YOU RUN THIS STRATEGY YOU ACCEPT THE POSSIBILITY OF LOOSING MONEY, ALL OF MY PUBBLICATIONS ARE SUPPOSED TO BE JUST FOR EDUCATIONAL PURPOSES.
IT IS AT YOUR OWN RISK WHETHER TO USE IT OR NOT
But if you make money out of this, please consider to buy me a beer 😜
Happy Trading!

Multi Moving Average Crossing (by Coinrule)Moving Averages are among the most common trading indicators. They are straightforward to interpret and effective to use.
One of the limitations of using moving averages is they can provide buy and sell signals with a relatively high lag , making it very difficult to spot the lows and tops of the trend.
Moving averages calculated with a low number of periods like the MA9 (the average of the previous nine price periods) react very fast to price moves providing prompt signals. On the other side, more signals may end up with more false-signals and more trades in a loss.
On the contrary, moving averages calculated with a higher number of periods like the MA100 (which considers the previous one hundred price periods) give more reliable signals, but with a delay.
A system catching the crossing of the MA50 over the MA100 is a good compromise for successful long-term strategies. It provides, on average, reliable buy signals.
The Multi Moving Average Crossing Strategy tries to optimize the exit without waiting for the same opposite crossing (MA50 below MA100). It uses the MA9 crossing below the MA50, instead, to spot a better time for selling.
The setup is as follows.
BUY when the Moving Average 50 crosses above the Moving Average 100
SELL when the Moving Average 9 crosses below the Moving Average 50
The higher is the time frame to calculate the Moving Averages, the better is the overall performance of the strategy. The 4-hour (or 6-hour) time frame seems to be the best, even if it results in fewer trades. If you want to trade more still with good results, the 1-hour time is a good compromise.
Advantages of the strategy
This strategy seeks to catch those that are more likely relevant uptrends and close the trade relatively quickly. More trades mean more opportunities. This is especially effective if you run the strategy on all the available coins on the market, as you could do with Coinrule.
Generally, a Multi Moving Averages approach beats the classic crossing strategy involving only two Moving Averages. We backtested a sample of twenty trading pairs to assess the benefits empirically.
The results show that the Multi Moving Average Strategy
outperforms 13 out of 20 times
has 95% higher average return
has 67% higher median return
The strategy assumes each order to trade 30% of the available capital and opens a trade at a time. A trading fee of 0.1% is taken into account.

KAMA Strategy - Kaufman's Adaptive Moving AverageThis strategy combines Kaufman's Adaptive Moving Average for entry with optional KAMA, PSAR, and Trailing ATR stops for exits.
Kaufman's Adaptive Moving Average is, in my opinion, a gem among the plethora of indicators. It is underrated considering it offers a solution that intuitively makes a lot of sense. When I first read about it, it was a real 'aha!' moment. Look at the top, pink line. Notice how during trending times it follows the trend quickly and closely, but during choppy, non-trending periods, the KAMA stays absolutely flat? Interesting! To trade with it, we simply follow the direction the KAMA is pointing. Is it up? Go long. Is it down? Go short. Is it flat? Hold on.
How does it manage to quickly follow real trends like a fast EMA but ignore choppy conditions that would whipsaw a fast EMA back and forth? It analyses whether recent price moves are significant relative to recent noise and then adapts the length of the EMA window accordingly. If price movement is big compared to the recent noise, the EMA window gets smaller. If price movement is relatively small or average compared to the recent noise, the EMA window gets bigger. In practice it means:
The KAMA would be flat if a 20 point upwards move occurred during a period that has had, on average, regular 20 point moves BUT
the KAMA would point up if a 20 point move occurred during a period that has, on average, had moves of only around 5 points.
In other words, it's a slow EMA during choppy flat / quiet flat periods, and a fast EMA as soon as significant volatility occurs. Perfect!
-----
The Strategy
The strategy is more than just a KAMA indicator. It contains:
KAMA exit (optional)
ATR trailing stop loss exit (optional)
PSAR stop loss exit (optional)
KAMA filter for entry and exits
All features are adjustable in the strategy settings
The Technical Details:
Check out the strategy's 'Inputs' panel. The buy and sell signals are based on the 'KAMA 1' there.
KAMA 1: Length -- 14 is the default. This is the length of the window the KAMA looks back over. In this instance, it c
KAMA 1: Fast KAMA Length -- 2 is the default. This is the tightest the EMA length is allowed to get. It will tend towards this length when volatility is high.
KAMA 1: Slow KAMA Length -- 20 is the default. This is the biggest the EMA length is allowed to get. It will tend towards this length when volatility is low.
KAMA Filter
The strategy buys when the KAMA begins to point up and sells when the KAMA points down. Generally, the KAMA is very good at filtering out the noise itself - it will go flat during noisy/choppy periods. But to add another layer of safety, its author, Perry Kaufman, proposed a KAMA filter. It works by taking the standard deviation of returns over the length of the the 'KAMA 1: Length' I mentioned above and multiplying it by an 'Entry Filter' (1 by default) and 'Exit Filter' (0.5 by default). The entry condition to go long is that the KAMA is pointing up and and it moved up more than 1 x St. Dev. of Returns. The exit condition is when the KAMA is pointing down and it moved down by more than 0.5 x St. Dev. of Returns.
Thanks
Thanks to ChuckBanger, cheatcountry, millerrh, and racer8 for parts of the code. I was able to build upon their good work.
-----
I hope this strategy is helpful to you.
Do you have any thoughts, ideas, or questions? Let me know in the comments or send me a message! I'd be glad to help you out.
If you need an indicator or strategy to be built or customised for you, let me know! I'll be glad to help and it'll probably be cheaper than you think!

BTC and ETH Long strategy - version 2I wrote my first article in May 2020. See below
BTC and ETH Long strategy - version1
After 6 months, it is now time to check the result of my script for the last 6 months.
XBTUSD (4H): 14/05/2020 --> 22/11/2020 = +78% in 4 trades
ETHXBT (4H): 14/05/2020 --> 22/11/2020 = +21% in 9 trades
ETHUSD (4H): 14/05/2020 --> 22/11/2020 = +90% in 6 trades
Using the signals from this strategy to trade manually has shown that this was a bit frustrating because of the low rate of winning trades.
If you have to enter 100 trades and see 75% of them failing and 25% winning, this is frustrating. For sure the strategy makes good money but it is difficult to hold this mentality.
So, I have reviewed and modified it to get a higher winning rate.
After few days of work, tests and validation, I managed to get a wining rate close to 60%.
The key element was also to decrease the number of trades by using a higher time frame. (4H candles instead of 2H candles).
- Entry in position is based on
MACD, EMA (20), SMA (100), SMA (200) moving up
AND EMA (20) > SMA (100)
AND SMA (100) > SMA (200)
- Exit the position if: Stoploss is reached OR EMA (20) crossUnder SMA (100)
The goal of this new script is to be able to follow the signals manually and only make few trades per years.
I have also validated it against some other altcoins where some are giving very good results.
Here are some results for 2020 (from 01/01/2020 until now (22/11/2020). Those results are the one I get when using 4H candles.
ETH/USD: +144% in 8 trades.
BTC/USD: +120% in 7 trades.
ETH/BTC: +33% in 9 trades.
ICX/USD: +123% in 10 trades.
LINK/USD: +155% in 11 trades.
MLN/USD: +388% in 8 trades.
ADA/USD: +180% in 7 trades.
LINK/BTC: +97% in 10 trades.
The best is that above results are without considering compound effect. If you re-invest all gains done in each new trade, this will give you the below results :)
ETH/USD: +189% in 8 trades.
BTC/USD: +260% in 7 trades.
ETH/BTC: +29% in 9 trades.
ICX/USD: +112% in 10 trades.
LINK/USD: +222% in 11 trades.
MLN/USD: +793% in 8 trades.
ADA/USD: +319% in 7 trades.
LINK/BTC: +103% in 10 trades.
As you can see, the results are good and the number of trades for 11 months is not big, which allows the trader to place orders manually.
But still, I'm lazy :), so, I have also coded this strategy in HaasScript language which allows you to automate this strategy using the HaasOnline software specialized in automated crypto trading.
I hope that this strategy will give you ideas or will be the starting point for your own strategy.
Let me know if you need more details.

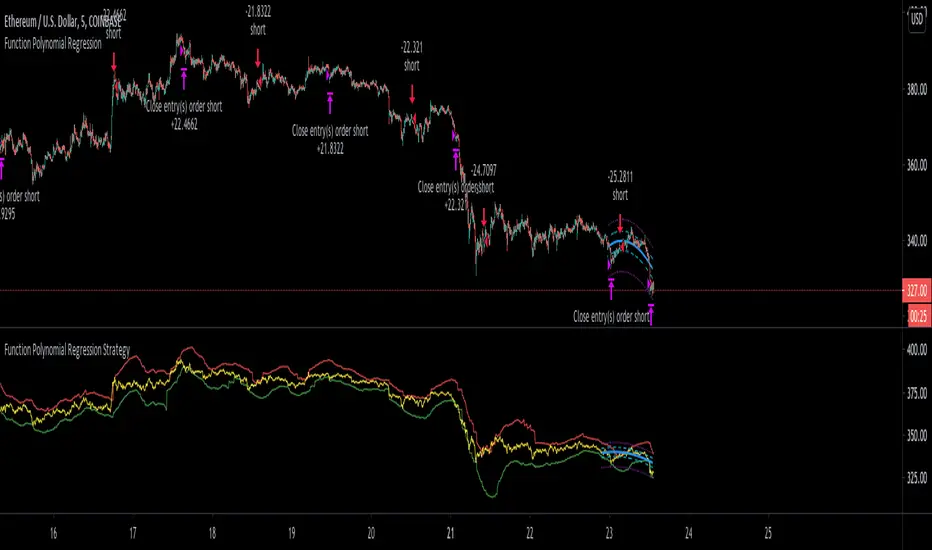
Function Polynomial Regression StrategyTo be clear I'm using the code from Richard Santos for the functional polynomial regression. I really loved his script idea (given that I'm into linear regression myself). I took his code and made a strategy which applies to bitcoin on the 5 minute chart (but you could adjust this for any asset), and you could make this work on anytime frame by adjusting the 'length' property of the regression until you get good results.
This strategy is very simple.
I drew lines to represent the bottom most part of the regression (green line), and top most part (red line). If the close crosses under the red line then you short. The reverse if it crosses above the green line then you go long.
Very simple but effective. To understand this script be sure to add Richard santos function polynomial regression so you can see what is going on and what I'm trying to do.
For example, on BTC with a length of 61 if you bought and held you would have only had 5% gain, instead with this strategy you are looking at very close to 60% gains! Now this could be a weird fluke of over-optimizing but I'm not sure this is the case because you can adjust the length from there +/- about 10 and still have good results. It's just certain lengths are the correct trading rhythms for different assets.
I'm excited to see how you guys use this and if you have any success. Be sure to thank Richard Santos for his great work!