Welford Bollinger Bands (WBB)The Welford method is an algorithm for calculating the running average and variance of a series of numbers in a single pass, without the need to store all the previous values. It works by maintaining an ongoing running average and variance, updating them with each new value in the series. The running average is updated using a simple formula that adds the new value to the previous average, weighed by the number of values that have been processed so far. The variance is updated using a similar formula that takes into account the deviation of the new value from the running average.
The Welford method has several advantages that make it a good fit for use in calculating Bollinger Bands. First, it is more numerically stable than other methods, as it avoids accumulating round-off errors and can handle large numbers of data points without overflow or underflow. This is important when working with financial data, which can contain large price movements and wide ranges of values.
Second, the Welford method is well-suited for use in real-time or streaming data scenarios where all the data may not be available upfront. This is useful in the context of Bollinger Bands, which are often used to identify trend changes and trading opportunities in real-time, as the bands are updated with each new data point.
Finally, the Welford method is simple and efficient, making it easy to implement and fast to compute. This is important when creating technical indicators and trading strategies, as performance is often a critical factor.
Overall, the Welford method is a reliable and efficient way to calculate the running average and variance of a series of numbers, making it a good fit for use in calculating Bollinger Bands and other technical indicators.
Cari dalam skrip untuk "bollingerband"

Channel Based Zigzag [HeWhoMustNotBeNamed]🎲 Concept
Zigzag is built based on the price and number of offset bars. But, in this experiment, we build zigzag based on different bands such as Bollinger Band, Keltner Channel and Donchian Channel. The process is simple:
🎯 Derive bands based on input parameters
🎯 High of a bar is considered as pivot high only if the high price is above or equal to upper band.
🎯 Similarly low of a bar is considered as pivot low only if low price is below or equal to lower band.
🎯 Adding the pivot high/low follows same logic as that of regular zigzag where pivot high is always followed by pivot low and vice versa.
🎯 If the new pivot added is of same direction as that of last pivot, then both pivots are compared with each other and only the extreme one is kept. (Highest in case of pivot high and lowest in case of pivot low)
🎯 If a bar has both pivot high and pivot low - pivot with same direction as previous pivot is added to the list first before adding the pivot with opposite direction.
🎲 Use Cases
Can be used for pattern recognition algorithms instead of standard zigzag. This will help derive patterns which are relative to bands and channels.
Example: John Bollinger explains how to manually scan double tap using Bollinger Bands in this video: www.youtube.com This modified zigzag base can be used to achieve the same using algorithmic means.
🎲 Settings
Few simple configurations which will let you select the band properties. Notice that there is no zigzag length here. All the calculations depend on the bands.
With bands display, indicator looks something like this
Note that pivots do not always represent highest/lowest prices. They represent highest/lowest price relative to bands.
As mentioned many times, application of zigzag is not for buying at lower price and selling at higher price. It is mainly used for pattern recognition either manually or via algorithms. Lets build new Harmonic, Chart patterns, Trend Lines using the new zigzag?

Bollinger Bands Filled - Didi's Needles setupFill Bollinger Bands - Based on Didi's Needles Setup
Fill Bands: True Fill Bollinger Bands
BB Open Upper: Open Bollinger Bands and MA Base rising
BB Open Lower: Open Bollinger bands and Base MA falling
BB Parallel Upper: Parallel and rising bollinger bands
BB Parallel Lower: Parallel and falling bollinger bands
BB Close: Closed Bollinger Bands
---------
Bandas de Bollinger com preenchimento - Baseada no Setup Agulhadas do Didi
Fill Bands: Verdadeiiro preenche as bandas de bollinger
BB Open Upper: Bandas de Bollinger abertas e MA Base subinte
BB Open Lower: Bandas de Bollinger abertas e MA Base cainte
BB Parallel Upper: Bandas de Bollinger paralelas e subinte
BB Parallel Lower: Bandas de Bollinger paralelas e cainte
BB Close: Bandas de Bollinger Fechada


Student's T-Distribution Bollinger BandsThis study shows the prediction interval as Bollinger Bands using Student's T-distribution. This means that the bands will be wider when the data features higher variation, as well as when the sample size (in the form of length) is smaller. The bands will also be wider when the confidence level is lower. The opposite is also true. Assuming we set a confidence level of 0.99 and a source set to the close price, we could reasonably expect that 99% of the time the close price would fall between the upper and lower bounds. Because this is a general statistical method which requires a lot of math, the script has a tendency to be relatively slow, but should be eligible to be used in a wide variety of situations.
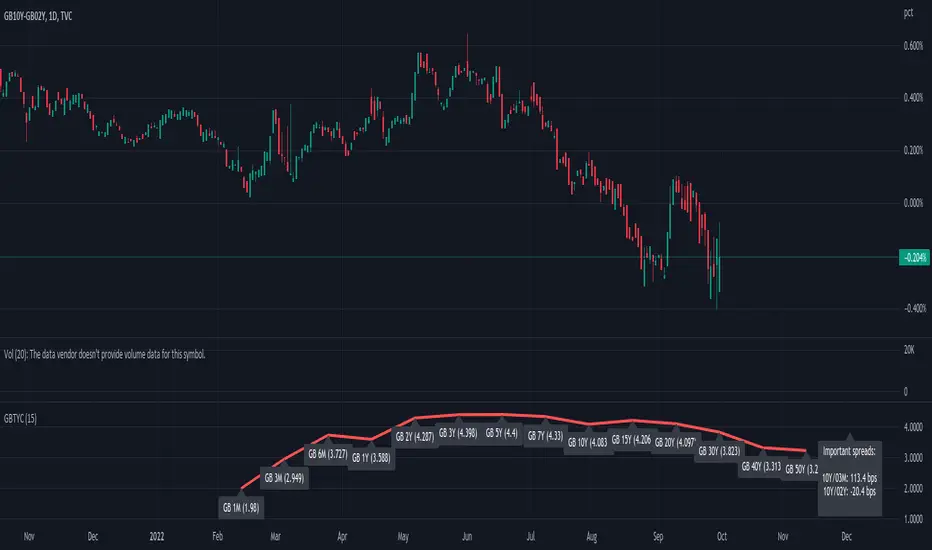
GB Gilt Yield CurveWith thanks to @longfiat whose US Treasury Yield Curve served as the basis for this indicator
This is created very quickly to provide a sense of the GB Gilt Yield curve in light of government induced market dysfunction as a result of an ill-conceived mini-budget.
Note that I omitted GB04Y, GB06Y, GB08Y, GB09Y and GB12Y to avoid overcrowding the chart with excess information and thereby render the indicator more readily usable.
Indicateur C17V2 Not long ago I discovered the TDI(kiss Soxman),
but I needed to know where my market was framed so I started tampering with the open source indicators on TV to make one my way, I'm not not a developer, just a trader homeless.

Currency Strength by Bollinger BandsOVERVIEW
This indicator is a currency strength by bollinger band.
CONCEPTS
- The currency strength of the passage is determined by each deviation of the Bollinger Bands.
- Wins if price is above MA, ±1σ, ±2σ. Mark is "○".
- Lose if price is below MA, ±1σ, ±2σ. Mark is "●".
- Display up to 9 currency combinations
- Support for bar indexes other than the latest

Bollinger Bands Scalper + VWAPGet more consistent scalps by trading in-between Bollinger Band Deviations.
FEATURES:
1) 3 Bollinger Bands with default settings to 1, 2, and 3 deviations for more consistent scalps
2) Trendicator: a dynamic color changing moving average that helps you see trend quickly
3) Robust VWAP tool with up to 3 different deviations as well as different anchor points to help you see strong support and resistances
4) Calming "purple cloud" color palette helps you focus on price action
5) Discover new trading strategies with a wide range of customizability

[SS]Multicolor BB with Squeez Moving Average & Colored BarsHello Followers,
Hope u guyz doing well in the market.
Came with a standalone Trading System which helps u with the trend & choppiness zone.
This system is combination of multiple stretagies which makes it better than single published indicators.
=========================================================================================================
We have used Variety-Filtered, Squeeze Moving Averages which is a chop zone indicator that identifies when price is below a specific volatility threshold calculated as the difference between a fast and slow moving average and filtered using ATR- or Pips-based threshold. This indicator can be use as both an entry and exit indicator. It identifies both chop zones and breakouts/breakdowns
Uses:-
When the candles turn white and the threshold bands appear on the chart, this is indicative of low volatility
When price exits the threshold bands, price will usually explode up or down giving a long or short signal. This acts as a sort of squeeze momentum.
Included:
Bar coloring
Signals
Alerts, 4 types of alerts: Squeeze started, Squeeze ended, long, and short
<<------------------------------------->>
Multicolour Bollinger Bands indicator that indicates market phases.
It plots on the price chart, thanks to different color zones between the bands, a breakdown of the different phases that the price operates during a trend.
The different zones are identified as follows:
- red color zone: trend is bearish , price is below the 200 periods moving average
--> orange color zone: price operate a technical rebound below the 200 periods moving average
- yellow color zone: (phase 1 which indicate a new bearish cycle)
- light green zone: (phase 2 which indicate a new bullish cycle)
--> dark green zone: trend is bullish , price is above the 200 periods moving average
- grey color zone: calm phase of price/low volatility
- dark blue color zone: price is consolidating in either bullish or bearish trend
- light blue zones: price will revert to a new opposite trend (either long or short new trend)
By identifying clearly the different market phases with the multicolor Bollinger bands , the market entries by either a the beginning of a new trend or just after a rebound or a consolidating phase is easier to spot on.
<<==========================>>
The credit of above indicator souce goes to loxx & Deveatt. I just backtested and modified it to increase accuracy of trade and clear visual representation for trades.
Modified the trend based SMA and BB period and entry criteria.
<<===========================>>
<>
1) Look for BB COLOR and SMA for trend either up or down.
2) Look Bar coloring, enter when price above sma and green for long else short.

Crypto Breakout IndicatorHey Guys,
The idea of the script is that accumalation and small pumps do happen before the big ones, therefore, i tried to create a breakout indicator that can tell that:
the script components are:
1- Price to consolidate within 15% range between the highest of 6 candles and lowest of 6 candles
2- Price needs to breakout with minimum of 1% and maximum of 20%
3- Price needs to have sufficient volume, hence volume of current bar needs to be higher than previous one with 10% at least
4- RSI needs to be between 50 and 75
5- Bollinger Bands Percentage needs to be equal or lower than 1
6- Price is closing above EMA200
I tried to make all these numbers to be available for you guys through settings so you can tell me about any better settings!

Dynamic Zone of Bollinger Band Stops Line [Loxx]Dynamic Zone of Bollinger Band Stops Line is a Bollinger Band indicator with Dynamic Zones. This indicator serves as both a trend indicator and a dynamic stop-loss indicator.
What are Bollinger Bands?
A Bollinger Band is a technical analysis tool defined by a set of trendlines plotted two standard deviations (positively and negatively) away from a simple moving average (SMA) of a security's price, but which can be adjusted to user preferences.
Bollinger Bands were developed and copyrighted by famous technical trader John Bollinger, designed to discover opportunities that give investors a higher probability of properly identifying when an asset is oversold or overbought.
What are Dynamic Zones?
As explained in "Stocks & Commodities V15:7 (306-310): Dynamic Zones by Leo Zamansky, Ph .D., and David Stendahl"
Most indicators use a fixed zone for buy and sell signals. Here’ s a concept based on zones that are responsive to past levels of the indicator.
One approach to active investing employs the use of oscillators to exploit tradable market trends. This investing style follows a very simple form of logic: Enter the market only when an oscillator has moved far above or below traditional trading lev- els. However, these oscillator- driven systems lack the ability to evolve with the market because they use fixed buy and sell zones. Traders typically use one set of buy and sell zones for a bull market and substantially different zones for a bear market. And therein lies the problem.
Once traders begin introducing their market opinions into trading equations, by changing the zones, they negate the system’s mechanical nature. The objective is to have a system automatically define its own buy and sell zones and thereby profitably trade in any market — bull or bear. Dynamic zones offer a solution to the problem of fixed buy and sell zones for any oscillator-driven system.
An indicator’s extreme levels can be quantified using statistical methods. These extreme levels are calculated for a certain period and serve as the buy and sell zones for a trading system. The repetition of this statistical process for every value of the indicator creates values that become the dynamic zones. The zones are calculated in such a way that the probability of the indicator value rising above, or falling below, the dynamic zones is equal to a given probability input set by the trader.
To better understand dynamic zones, let's first describe them mathematically and then explain their use. The dynamic zones definition:
Find V such that:
For dynamic zone buy: P{X <= V}=P1
For dynamic zone sell: P{X >= V}=P2
where P1 and P2 are the probabilities set by the trader, X is the value of the indicator for the selected period and V represents the value of the dynamic zone.
The probability input P1 and P2 can be adjusted by the trader to encompass as much or as little data as the trader would like. The smaller the probability, the fewer data values above and below the dynamic zones. This translates into a wider range between the buy and sell zones. If a 10% probability is used for P1 and P2, only those data values that make up the top 10% and bottom 10% for an indicator are used in the construction of the zones. Of the values, 80% will fall between the two extreme levels. Because dynamic zone levels are penetrated so infrequently, when this happens, traders know that the market has truly moved into overbought or oversold territory.
Calculating the Dynamic Zones
The algorithm for the dynamic zones is a series of steps. First, decide the value of the lookback period t. Next, decide the value of the probability Pbuy for buy zone and value of the probability Psell for the sell zone.
For i=1, to the last lookback period, build the distribution f(x) of the price during the lookback period i. Then find the value Vi1 such that the probability of the price less than or equal to Vi1 during the lookback period i is equal to Pbuy. Find the value Vi2 such that the probability of the price greater or equal to Vi2 during the lookback period i is equal to Psell. The sequence of Vi1 for all periods gives the buy zone. The sequence of Vi2 for all periods gives the sell zone.
In the algorithm description, we have: Build the distribution f(x) of the price during the lookback period i. The distribution here is empirical namely, how many times a given value of x appeared during the lookback period. The problem is to find such x that the probability of a price being greater or equal to x will be equal to a probability selected by the user. Probability is the area under the distribution curve. The task is to find such value of x that the area under the distribution curve to the right of x will be equal to the probability selected by the user. That x is the dynamic zone.
Included
Bar coloring
Signals
Alerts
3 types of signal smoothing

Trendlines Boll Ichi S1 by GammaprodI. How to use this indicator :
------------------------------
I.1. Set your teadingview theme to dark theme.
I.2. Gammaprod indicator is valid for forex, stock and but more valid for crypto.
I.3. Use three timeframe for more validation (choose between those, that fit to your trading style) :
- Timeframe 1m, 5m, and 15m for Scalping
- Timeframe 30m, 1h and 4h for Intraday
- Timeframe 4h, 1D and 1W for Swing Trading
I.4 Always use THREE INDICATORS FROM GAMMAPROD, those three indicators is back to back each other, by the way, I only made those three indicators only (for now) :
- Trendlines Boll Ichi S1 by Gammaprod
- MACD Volume S2 by Gammaprod
- Stoch RSI Divs Zone S2 by Gammaprod
============================================================================
II. How to setting :
--------------------
II.1. Trendlines Boll Ichi Crypto by Gammaprod
II.1.A. Support and Resistance
- Well if you familiar with this indicator you can add it, but recommended for Timeframe 30m or more
II.1.B. Trendlines Primary or Trendlines Secondary
- Timeframe 1m you DON'T NEED Trendlines Primary or Trendlines Secondary
- Timeframe 5m you DON'T NEED Trendlines Secondary, but you CAN ADD Trendlines Primary if you fell it helpful (for me, it is helpful to find where the candles start or the end trend or a consolidation or where the candles will surpass a resistance or a support).
- Timeframe 15m you DON'T NEED Trendlines Secondary, DEFENITELY add Trendlines Primary it will help to find where the candles stop or a consolidation or where the candles will surpass a resistance or a support).
- Timeframe 30m or more, DEFENITELY NEED BOTH Trendlines Primary and Secondary Trendlines, it will help to find where the candle stop or consolidation or where the candle will surpass a resistance or support).
II.1.C. Bollinger, Ichimoku Cloud and Lagging Span
- Please DON'T CHANGE IT at all, it's really helpful to know when and where to make an entry decesion or a trend or a consolidation, if you don't understand how to read it, you better to learn it first (on "how to read" section and "How to OPEN position" the section below)
II.2. Stoch RSI Divs Zone Crypto by Gammaprod (DON'T CHANGE IT)
II.3. MACD Volume Crypto by Gammaprod (DON'T CHANGE IT)
============================================================================
III. How to read :
------------------
III.1. Sell or Buy Priority :
III.1.A. Sell Priority
- Color background on macd and stoch rsi is pink or purple sell is the priority, (if you're not sure to buy, just wait until the best moment to sell)
III.1.B. Buy Priority
- Color background on macd and stoch rsi Teal or light green buy is the priority, (if you're not sure to sell, just wait until the best moment to buy)
III.1.C. Indecision / Golden Moment
- Color background on stoch rsi yellow is indecision / golden moment of reversal pattern (wait until it formed background only on Stoch RSI), please be careful at this moment.
III.2. Trend / Consolidation :
III.2.A. BULLISH trend
- When Stoch RSI and MACD have teal or light green background that's means BULLISH trend, better to confirm by the candle is above green cloud and lagging span (red line) is also above the candle.
III.2.B. BEARISH trend
- When Stoch RSI and MACD have the Pink or purple background that's means BEARISH trend, better to confirm by the candle is above purple cloud and lagging span (red line) is also below the candle.
III.2.C. CONSOLIDATION
- When Stoch RSI have the mix background that's means CONSOLIDATION, better to confirm by the candle is in or near to green / purple cloud and lagging span (red line) is also on the candle.
III.3. Special Mark
III.3.A. Ideal Bullish :
- Near line 20 and green / teal background = When Stoch RSI have the char R / H on lime color label, that's means divergence or hidden divergence for buy position, if you not see this label that's means just a standard confirmation for buy
III.3.B. Not an Ideal Bullish :
- Near line 80 and green / teal background = if this happens make sure you know what happen, it could be a false signal or bullish continual pattern
III.3.C. Ideal Bearish :
- Near line 80 and pink / purple background = When Stoch RSI have the char R / H on lime color label, that's means divergence or hidden divergence for buy position, if you not see this label that's means just a standard confirmation for sell position.
III.3.D. Not an Ideal Bearish:
- Near line 20 and pink / purple background = if this happens make sure you know what happen, it could be a false signal or bearish continual pattern
III.3.E. The Beginning of Reversal (from BEARISH to BULLISH) :
- When Stoch RSI line shaping GREEN position is near 20.
- MACD lines still PINK, position lines is UNDER the HISTOGRAM, but the HISTOGRAM start to SHAPE FALL PINK (light pink) and the BACKGROUND still PINK / PURPLE.
- Position CANDLES NEAR BLUE line, NEAR PURPLE CLOUD, and lagging span (red line) STILL ON the area candle. (it used to be confirmed with the golden moment).
III.3.F. The Beginning of Reversal (from BULLISH to BEARISH) :
- When Stoch RSI line shaping PINK position is near 80.
- MACD lines still GREEN, position lines is ABOVE the HISTOGRAM, but the HISTOGRAM start to SHAPE FALL GREEN (light green) and the BACKGROUND still TEAL / GREEN.
- Position CANDLES NEAR WHITE line, NEAR TEAL CLOUD, and lagging span (red line) STILL ON the area candle. (it used to be confirmed with the golden moment).
III.3.G. False Signals, or It could be a Golden Moment (better to see it on TF 15 or bigger):
- Near line 20 or 80 and yellow background = When Stoch RSI have the char R / H on color label, that's means divergence or hidden divergence for buy / sell position, if you not see this label that's means just a standard confirmation for buy / sell depends on where the Stoch RSI line if near 20 that's means buy, near 80 means sell
============================================================================
IV. How to OPEN position:
-------------------------
IV.1. Bullish
IV.1.A. Trendlines Boll Ichi S1 by Gammaprod
- The candles above the green cloud.
- Lagging span (red line) above the candles.
- then open buy near yellow line (the first option) / blue line (the second option) (always confirm the position with two other indicators below).
IV.1.B. MACD Volume S2 by Gammaprod
- Teal or Green background.
- The lines is shaped or shaping green.
- Better if at the green histogram.
IV.1.C. Stoch RSI Divs Zone S3 by Gammaprod
- Teal or Green background.
- The lines is shaping green.
- Better if on the bottom (at a range 20).
IV.2. Bearish
IV.2.A. Trendlines Boll Ichi S1 by Gammaprod
- The candles below the purple cloud.
- Lagging span (red line) below the candles.
- then open buy near yellow line (the first option) / white line (the second option) (always confirm the position with two other indicators below).
IV.2.B. MACD Volume S2 by Gammaprod
- Pink or purple background.
- The lines are shaped or shaping green.
- Better if at the pink histogram.
IV.2.C. Stoch RSI Divs Zone S3 by Gammaprod
- Pink or purple background.
- The lines are shaping pink.
- Better if the line on the top (at a range 80).
IV.3. Consolidation
IV.3.A. Trendlines Boll Ichi S1 by Gammaprod
- The candles on the cloud (green or purple).
- Lagging span (red line) on the candles.
- then open buy near the white or blue line (always confirm the position with two other indicators below).
IV.3.B. MACD Volume S2 by Gammaprod
- Changing the background.
- The line is near the middle line.
- Have small Histogram.
IV.3.C. Stoch RSI Divs Zone S3 by Gammaprod
- Mix background specially on a timeframe 15m or more.
- The line move fast up and down.
- Better if on the bottom or the top of the lines (at a range 20 or 80).
============================================================================
>> The secret ingredient is comparing the timeframe :
The example scalping (Timeframe 1m, 5m and 15m)
- TF 1m is for making an open position.
- TF 5m is for making a judgement of the trend market.
- TF 15m is to confirm that judgement from TF 5m, be careful if it not similar then it used to be a consolidation or the beginning of the reversal.
There's a lot a way to open the position than above information that i gave it to you, but consider there are a limit chars on this column, I hope it will help your trading and make a more profit on it.

Is the Bollinger Bands assumption wrong?Bollinger Bands are the result of the assumption that closing prices will follow a normal distribution.
However, when I actually calculated the probability, the closing price does not follow a normal distribution.
According to the normal distribution, the probability that Z > 2 should be 2.2%, but on the chart, the probability is 6~9%.
Can we get a useful value for Bollinger Bands that we can use in our strategy?
We can measure volatility, but can we judge volatility based on a fixed value?
To the right of each Bollinger band value, the probability that the price is above the band is displayed.
The script is simply annotated with how each probability is calculated.

3EMA + Boullinger + PIVOTTRES EMAS + BANDAS DE BOLLINGER + PIVOTE
INDICADOR 1: TRES EMAS (MEDIA MOVIL EXPONENCIAL)
Con este indicador puede visualizar el promedio de precios con mayor peso a los datos mas recientes.
Se calculan y dibujan tres medias móviles exponenciales: 8, 20 y 200 últimas velas.
-Rápida EMA1 = 8
-Media EMA2 = 20
-Lenta EMA 3 = 200
INDICADOR 2: BANDAS DE BOLLINGER
Con este indicador podrá ver la fuerza y la tendencia del mercado, es decir la mide la volatilidad del precio del activo.
Si el precio sobrepasa la banda superior, el activo está sobrecomprado.
Si el precio sobrepasa la banda inferior, el activo está sobrevendido.
Longitud tendencia - BASE = 20, paso = 1
Desviación Estándar - Multiplicador = 2, paso = 0.2
INDICADOR 3: PIVOTE
Este indicador etiqueta los puntos donde el precio es mínimo y máximo, en un rango de velas determinado en el parámetro "Distancia para el Pivote".
Estos 3 indicadores sirven para todo tipo de activos: FOREX, CRIPTO, CFD´s, ETC.
------------------------------------------------------------------------------------------------------------------
THREE EMAS + BOLLINGER BANDS + PIVOT
INDICATOR 1: THREE EMAS ( EXPONENTIAL MOVING AVERAGE )
With this indicator you can visualize the average of prices with greater weight to the most recent data.
Three exponential moving averages are calculated and drawn: 4, 20 and 200 last candles.
-Fast EMA1 = 8
-Average EMA2 = 20
-Slow EMA 3 = 200
INDICATOR 2: BOLLINGER BANDS
With this indicator you can see the strength and trend of the market, that is, it is measured by the volatility of the asset price.
If the price goes above the upper band, the asset is overbought.
If the price goes above the lower band, the asset is oversold.
Trend length - BASE = 20, step = 1
Standard Deviation - Multiplier = 2, step = 0.2
INDICATOR 3: PIVOT
This indicator labels the points where the price is minimum and maximum, in a range of candles determined in the parameter "Distance to Pivot".
These 3 indicators are used for all types of assets: FOREX, CRYPT, CFD's, ETC.

Double Basics - Identify Overbought & Oversold - MultitimeframeI believe that everyone should monitor the basic indicators; EMA/SMA cross, BB and RSI on at least TWO timeframes before making any trading decisions. And because that is only possible on paid subscriptions, I created this indicator for people just getting started.
It allows you to plot all of the mentioned AND 2 weeklies of your choice on 1 chart INCLUDING a higher timeframe, using only 1 indicator.
The EMA's are plotted as ORANGE and the SMA's as BLACK, you can distinguish them by the line size, thin is current chart, thick is higher timeframe.
Same for the Bollinger Bands, Upper lines are red (overbought = sell signal) and bottom lines are green (oversold = buy signal)
The RSI, normally plotted in its own window, are plotted on the scale of the BB of the 2nd timeframe, where the bottom line = 0, upper line = 100 and middle (think black) line = 50. The thin purple line is the RSI of the chart resolution, the thicker purple line is the RSI of the 2nd timeframe.
Finally, the two weeklies are plotted as thick black lines.
Enjoy, and let me know your feedback!

Volume + VolatilityBefore I begin I want to mention:
1. This is a variation of the 'CCI & BB' made by matsu_bitmex (Link: ) and SigmaDraconis's 'On Balance Volume Oscillator + Bollinger Bands' (Link: )
2. While using this sometimes you may not notice the crossover so I've added the Line 'x' outside 'x' BB to only see if Line 3 and 4 crossed over
The indicator:
1. When the background is green and the 2 lines are going up it means uptrend
2. When the background is red and the 2 lines are going down it means downtrend
3. When there is a crossover and the background outside BB turns yellow, it means there is a lot of volatility or volume
How to use (Or how I use this):
1. All trades based on the yellow color MUST be during a trend
2. When the color changes to yellow for the 1st time in the direction of a trend it is advisable to enter
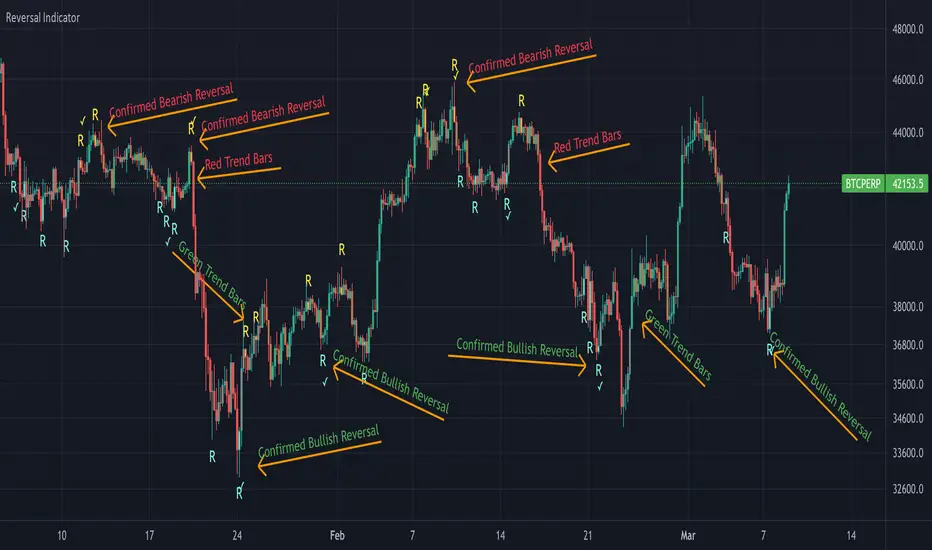
Reversal Indicator
█ OVERVIEW
This indicator shows bullish and bearish reversal signal candles. It finds the candles with extreme volatility and marks the candles with high probability for a reversal of the trend.
█ CONCEPT
This indicator uses the Bollinger Bands to mark the candles with high selling/buying pressure. Bollinger Bands consist of three bands total: an upper band, middle band, and lower band. These separate bands are each used to highlight extreme prices in a specific security. The upper band is associated with overbought, whereas the lower band points to oversold, and the middle band acts as a moving average.
It is common after a lower band has been broken by heavy selling for the price of the asset to revert back above the point of the lower band and move closer to the middle band. The indicator marks this occurrence as a bullish reversal candle. Same applies vice versa. If the upper band is broken by heavy buying, it is natural for the price to revert back and move closer to the middle level. This indicator marks this as a bearish reversal candle.
█ HOW TO USE IT
Reversal Candles - Sky blue colored "R" indicates bullish reversal candle and yellow colored "R" indicates bearish reversal candle.
Checkmarks - Checkmarks provide a confirmation that the reversal has already begun with the candle next to the signal candle. Always wait for confirmation before considering it as a reversal of the trend.
RSI confluence - Enabling this check box in settings will show the reversal signal only when the RSI is overbought/oversold
█ LIMITATION
As like in any indicator, this indicator needs to be used with the assistance of other indicators to make conceptual and strategic trading decisions.
Volume Adaptive Bollinger Bands (MZ VABB)This indicator is a functional enhancement to John Bollinger's Bollinger Bands. I've used Volume to adapt dynamic length which is used in basis (middle line) of Bollinger Bands and Simple Moving Average is replaced with Adaptive Ehlers Deviation Scaled Moving Average ( AEDSMA ).
BOLLINGER BANDS BASIC USAGE AND LIMITATIONS
Bollinger bands are popular among traders because of their simple way to detect volatility in market and redefine support and resistance accordingly. These are some basic usages of original Bollinger Bands:
Most commonly Bollinger Band works on 20 period Simple Moving Average as Basis / Middle Line and standard deviation of 2 for volatility detection.
Upper and lower bands can act as support and resistance which accordingly update with standard deviation of same period as of Simple Moving Average.
As upper and lower bands act as volatility measure which benefits in Squeeze detection and breakout trading.
Among all the usages there are some limitations as follows:
Original Bollinger Bands use 20 period Simple Moving Average as Basis which itself restricted to some number of data pints and if market moves in one direction or simply goes sideways for long time; candles can stay on either bands for long time. This gives benefit for staying in directional trade but will completely nullify the use of both bands as support and resistance.
Above point simply be explained as markets can stay overbought / oversold for long time and one way to make Bollinger Bands more useful is to simply use higher periods in SMA but as we know with higher periods SMA becomes more laggy and less adaptive.
Most traders use BBs alongside some other Volume Oscillator for example "On Balance Volume" but that does solve BBs limitations issue that it should be more adaptive to detect volatility in market.
VOLUME ADAPTIVE BOLLINGER BAND WORKING PRINCIPLE
Best way to make original Bollinger band more adaptive was to just use dynamic length instead on constant 20 period. This dynamic length had to be based on some other powerful parameter which can't be volatility as BB itself is a volatility indicator and adapting its length based volatility would have been superimposing volatility on Bollinger bands giving unrealistic results.
For adaptive length, I tried using Volume and for this purpose I used my Relative Volume Strength Index " RVSI " indicator. RVSI is the best way to detect if Volume is going for a breakout or not and based on that indication length of Bollinger Band Basis Moving Average changes.
RVSI breaking above provided value would indicate Volume breakout and hence dynamic length would accordingly make Bollinger band basis moving average more over fitted and similarly standard deviation of achieved dynamic length would give better bands for support and resistance. Similar case would happen if Volume goes down and dynamic length becomes more underfit.
According to my back testing studies I found that Simple Moving Average wasn't the best choice for dynamic length usage in Bollinger Band Basis. So, I used Adaptive Ehlers Deviation Scaled Moving Average ( AEDSMA ) which is more adaptive and already modified to adapt with RVSI.
SLOPE USAGE FOR TREND STRENGTH DETCTION
Volume Adaptive Bollinger Bands are more reactive to market trends so, I used slope for trend strength detection.
If slope of Volume Adaptive Bollinger Band Basis (i.e. AEDSMA ), Upper and Lower Bands is supporting a trend at same time then script will provide signal in that direction. That signal can also use Volume as confirmation if Bollinger Bands trend direction is supported by Volume or not.
DYNAMIC COLORS AND TREND CORRELATION
I’ve used dynamic coloring in Basis ( AEDSMA ) to identify trends with more detail which are as follows:
Lime Color: Slope supported Strong Uptrend also supported by Volume and Volatility or whatever you’ve chosen from both of them.
Fuchsia Color: Weak uptrend only supported by Slope or whatever you’ve selected.
Red Color: Slope supported Strong Downtrend also supported by Volume and Volatility or whatever you’ve chosen from both of them.
Grey Color: Weak Downtrend only supported by Slope or whatever you’ve selected.
Yellow Color: Possible reversal indication by Slope if enabled. Market is either sideways, consolidating or showing choppiness during that period.
SIGNALS
Green Circle: Market good for long with support of Volume and Volatility or whatever you’ve chosen from both of them.
Red Circle: Market good to short with support from Volume and Volatility or whatever you’ve chosen from both of them.
Flag: Market either touched upper or lower band and can act as good TP and warning for reversal.
FIBONACCI BANDS
I’ve included Fibonacci multiple bands which would act as good support/resistance zones. For example, 0.618 Fib level act as good local support and resistance in both upper and lower zones. Fibonacci values can be modified but should be lower than 1.
DEFAULT SETTINGS
I’ve set default Minimum length to 50 and Maximum length to 100 which I’ve found works best for almost all timeframes but you can change this delta to adapt your timeframe accordingly with more precision.
Dynamic length adoption is enabled based on Volume only but volatility can be selected which is already explained above.
Trend signals are enabled based on Slope and Volume but Volatility can be enabled for more precise confirmations.
In “ RVSI ” settings "Klinger Volume Oscillator" is set to default but others work good too especially Volume Zone Oscillator. For more details about Volume Breakout you can check “MZ RVSI Indicator".
ATR breakout is set to be positive if period 14 exceeds period 46 but can be changed if more adaption with volatility is required.
EDSMA super smoother filter length is set to 20 which can be increased to 50 or more for better smoothing but this will also change slope results accordingly.
EDSMA super smoother filter poles are set to 2 because found better results with 2 instead of 3.
FURTHER ENHANCEMENTS
So far, I've achieved better results with "Klinger Volume Oscillator" in RVSI but TFS Volume Oscillator and On Balance Volume can be used which would change dynamic length differently. It doesn't mean that results would be wrong with some oscillator and precise with others but every oscillator works in its specific way for and RVSI just detect strength of Volume based on provided oscillator.

[kai]Keltner&BolingerIt is an indicator that simultaneously displays the Bollinger Bands (BB) and Keltner Channel (KC) calculated for the log scale.
* If you need the normal scale version, please turn off the log mode in the settings.
I think the usage is the same as normal BB and KC.
From here, it ’s an original way of thinking.
I thought about countermeasures for the phenomenon that the BB contracts (squeezes) and breaks, but for some reason it suddenly reverses and breaks greatly in the opposite direction or ends in misfire.
The main part of this Inge is KC, and I think that the range within KC is the range.
Considering that the bar broke above and below the range of KC and broke, the trend market started.
BB fits in KC and judges that the trend is game over
If it is within KC, it is contrarian at the upper and lower limits of KC.
If it breaks, Trend following
Profit if BB fits in KC
I'm thinking about how to use it
ログスケール用にログ計算したボリンジャーバンド(BB)とケルトナーチャンネル(KC)を同時に表示するインジケーターです
※通常スケール版が必要な時は設定のlog modeをOFFにしてください
使い方は普通のBBとKCとおなじで使用方法で良いと思います
ここからはオリジナルな使い方の考え方です
BBが収縮(スクイーズ)してブレイクしたのに何故か突然反転して反対の方に大きくブレイクしたり、不発に終わったりする現象の対策を考えました
このインジのメインはKCでKCの範囲内はレンジと考えます
KCの範囲外にバーが上抜け、下抜けして、ブレイクしたと考え、トレンド相場スタートとします
BBがKCの中に納まってトレンド終了と判定します
KC内の場合はKCの上限、下限で逆張り
ブレイクした場合は順張り
BBがKCの中に納まったら利確
という感じの使い方を考えています

Daily EMA50 100 200 + BBStandard Bollinger Bands (timeframe dependent), period and standard deviation are configurable.
And standard daily triple EMA (timeframe independent). Short, Medium and Long periods are configurable (50/100/200 by default)
CRC.i Bollinger Bands ®This script is yet another variant of the famous Bollinger Bands® TA tool used to track price volatility as it deviates from the mean of a security using standard deviations (positive &negative). Built for my own personal preferences. But perhaps you might like it, too.
Includes
+ Chart Lines: price, upper and lower bands
+ User Options: SMA length, stdev value
+ Heads up Display (HUD) with TARGET's and other related stats
Bugs? Comments? Requests? Ping me @calmrat

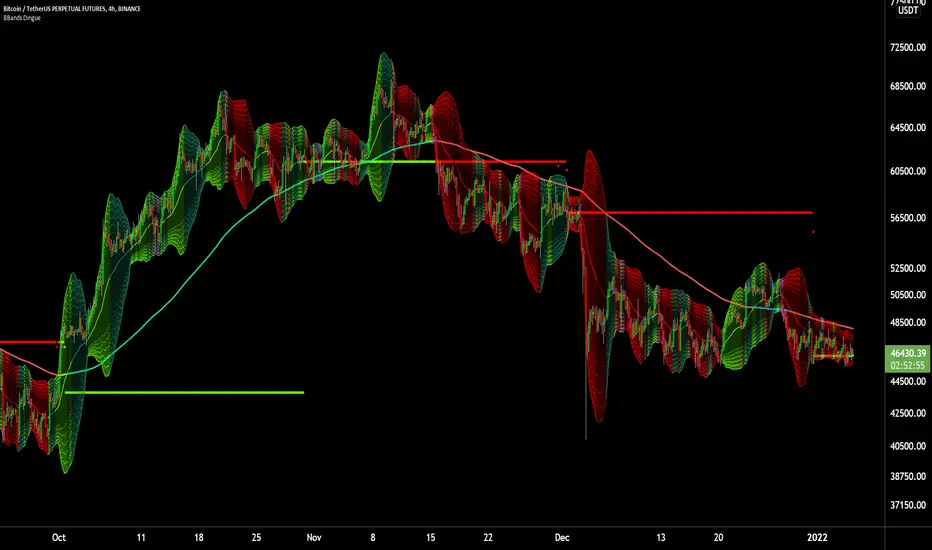
6X Bollinger Bands + MA + VWAP Dingue V56X Bollinger Bands Dingue V5 - This is the updated version for Pine Script 5
This indicator lets you quickly see all the intricacies of the Bollinger Bands; it simplifies its usage and maximizes the results.
Color-coded if the price is above or under the middle and based on direction.
Color-coded for expansion and contraction of the bands.
Option to plot ‘Squeezed bands’. It will show above the bands when they become smaller than the setting chosen. This helps identify build-up that might explode one way or another.
- 6x independent Bands can be adjusted as you want. It gives you possibilities in how you see variance, trends, support and resistance.
You can also select the MA type: SMA EMA WMA VWAM FRAMA … to explore new ways to see the Bollinger bands.
New in this version, you can now add a separate ‘Long MA’ that you can select independently from the Bands. Ex. Plot 200 SMA This helps in building a strategy with the trend and the bands.
Like the MA above, you can also plot 2 different VWAP independently from the Bands. This also helps knowing where the price stands compared to the bigger time frame VWAP’s price.
'Tool tips' explain other settings, if you have any questions, feel free to ask in the comments below.
Thank you for the feedback and check all my ‘Dingue’ indicators.