Liquidity Zones (JTS)Title: Liquidity Zones (JTS)
Description:
This script marks out key liquidity zones using pivot highs and lows. It includes:
Buy-Side Liquidity (Highs): Shown in red lines
Sell-Side Liquidity (Lows): Shown in green lines
Sweep Protection: Zones will only be removed after a defined number of bars AND a true sweep beyond the level
Toggle Controls: Enable/disable highs or lows individually
Adjustable Settings: Pivot length, sweep delay, max lines, and colors
Perfect for traders looking to track untapped or recently swept liquidity.
Created by JTS
For educational and strategic use
Cari dalam skrip untuk "liquidity"

Liquidity FinderFinds Liquidity inside FVG's, and utilizes an ema to decide if it should look for bullish or bearish liquidity.

Liquidity Heatmap [Eˣ]💧 Liquidity Heatmap - Free Indicator
Overview
The Liquidity Heatmap reveals where stop losses are clustered in the market - the hidden liquidity zones that smart money targets. This indicator automatically identifies Buy-Side Liquidity (BSL) above price and Sell-Side Liquidity (SSL) below price, showing you exactly where institutional traders are likely to hunt for stops before major moves.
━━━━━━━━━━━━━━━━━━━━━━━━━━━━
🎯 What This Indicator Does
Identifies Liquidity Zones:
• Buy-Side Liquidity (BSL) - Stop losses from SHORT positions clustered above price
• Sell-Side Liquidity (SSL) - Stop losses from LONG positions clustered below price
• Automatically clusters nearby levels into high-probability zones
• Shows liquidity strength (1-5+) - higher numbers = more stops = bigger target
• Removes swept liquidity in real-time as price takes out stops
Visual Display:
• 🔴 Red Zones Above Price = Buy-Side Liquidity (shorts' stops)
• 🟢 Green Zones Below Price = Sell-Side Liquidity (longs' stops)
• Thicker/Darker Zones = Higher liquidity concentration
• BSL/SSL Labels = Show exact strength count
• Triangle Markers = Liquidity sweep alerts (when price takes stops)
Smart Features:
• Auto-removes old liquidity (customizable lookback period)
• Clusters nearby levels to reduce noise
• Tracks liquidity strength and age
• Updates in real-time as new swing points form
• Alerts when major liquidity zones are swept
━━━━━━━━━━━━━━━━━━━━━━━━━━━━
📊 How To Use This Indicator
Understanding Liquidity Concepts
What is Liquidity?
Liquidity refers to clusters of stop loss orders sitting in the market. These stops represent:
• Long traders' stop losses (below support) = Sell-Side Liquidity
• Short traders' stop losses (above resistance) = Buy-Side Liquidity
Why Does This Matter?
• Institutions NEED liquidity to fill large orders
• Price often "sweeps" liquidity zones before reversing
• Major liquidity = major target for smart money
• Understanding liquidity = understanding market maker behavior
The Liquidity Cycle:
1. Retail traders place stops at obvious levels (swing highs/lows)
2. Smart money identifies these clusters
3. Price is pushed to sweep the stops (liquidity grab)
4. Institutions fill their orders with this liquidity
5. Price reverses in the opposite direction
━━━━━━━━━━━━━━━━━━━━━━━━━━━━
💡 Trading Strategies
Strategy 1: Liquidity Sweep Reversals
Best For: Swing trading, catching reversals
Timeframes: 15min, 1H, 4H, Daily
Entry Setup:
1. Identify strong Sell-Side Liquidity (SSL) zone below price
2. Wait for price to sweep down into the SSL zone
3. Look for rejection/reversal candle pattern (pin bar, engulfing)
4. Enter LONG after sweep and reversal confirmation
5. Stop loss: Below the swept liquidity zone
6. Target: Opposite liquidity zone or key resistance
Why It Works: Smart money sweeps stops to fill buy orders, then pushes price higher
Example:
• SSL zone at $45,000 with strength 3
• Price drops to $44,950, sweeps the SSL
• Strong bullish reversal candle forms
• Enter long at $45,100
• Target: BSL zone at $47,000
Strategy 2: Liquidity-to-Liquidity Runs
Best For: Day trading, scalping
Timeframes: 5min, 15min, 1H
Entry Setup:
1. Price sweeps Sell-Side Liquidity below and reverses up
2. Identify Buy-Side Liquidity zone above
3. Enter LONG targeting the BSL zone above
4. Exit near/at the BSL zone (don't wait for sweep)
5. Stop loss: Below recent swing low
Why It Works: Price moves from liquidity pool to liquidity pool
Variation - Reverse for Shorts:
• BSL sweep above → Look for SSL zone below
• Enter short targeting lower liquidity
Strategy 3: Liquidity Avoidance (Stop Placement)
Best For: Improving win rate on existing strategies
Timeframes: All
Rules:
1. NEVER place stops exactly at obvious liquidity zones
2. Place stops beyond the liquidity zone with buffer
3. Or place stops before the liquidity zone (tighter, riskier)
4. Monitor liquidity strength - avoid zones with strength 3+
Why It Works: Market makers hunt obvious stop clusters
Example:
• Trading long, swing low at $100 (SSL zone, strength 4)
• Bad: Stop at $99.50 (will get swept)
• Better: Stop at $98.50 (beyond the liquidity)
• Alternative: Stop at $100.50 (tighter, before sweep zone)
Strategy 4: Confluence Trading
Best For: High probability setups
Timeframes: 1H, 4H, Daily
Entry Setup:
1. Find liquidity zone that aligns with:
• Major support/resistance level
• Fibonacci retracement (0.618, 0.786)
• Trendline
• Round psychological number ($50,000, $2,000, etc)
2. Wait for sweep of this high-confluence zone
3. Enter on reversal with multiple confirmations
4. Larger position size justified by confluence
Why It Works: Multiple factors = institutional interest = higher probability
━━━━━━━━━━━━━━━━━━━━━━━━━━━━
⚙️ Settings Explained
Core Settings
Swing Detection Length (Default: 10)
• Number of bars left/right to identify swing highs and lows
• Lower values (5-8): More sensitive, more liquidity zones, more noise
• Higher values (12-20): Less sensitive, only major swings, cleaner chart
• Recommended: 8-10 for intraday, 10-15 for swing trading
Liquidity Lookback Bars (Default: 100)
• How many historical bars to track liquidity zones
• Lower values (50-75): Shows only recent liquidity
• Higher values (100-200): Shows longer-term liquidity clusters
• Zones older than this are automatically removed
• Recommended: 100-150 for most timeframes
Zone Proximity % (Default: 0.5)
• Percentage threshold to group nearby levels into single zone
• Lower values (0.2-0.4): Keeps levels separate, more zones
• Higher values (0.6-1.0): Aggressive clustering, fewer zones
• Recommended: 0.4-0.6 for crypto, 0.3-0.5 for forex, 0.5-0.8 for stocks
Visualization Settings
Show Buy-Side Liquidity
• Toggle ON/OFF red zones above price
• Turn OFF if only interested in downside liquidity
Show Sell-Side Liquidity
• Toggle ON/OFF green zones below price
• Turn OFF if only interested in upside liquidity
Show Liquidity Labels
• Toggle BSL/SSL labels with strength numbers
• Turn OFF for cleaner chart appearance
• Keep ON to see exact liquidity strength
Display Style
• Boxes: Filled rectangular zones (best for visualizing strength)
• Lines: Horizontal dashed lines (minimal, clean look)
• Both: Boxes + Lines (maximum visibility)
Color Intensity
• Low: 85% transparency (subtle, less distracting)
• Medium: 75% transparency (balanced visibility)
• High: 65% transparency (bold, maximum visibility)
━━━━━━━━━━━━━━━━━━━━━━━━━━━━
📱 Info Panel Guide
Located in the top-right corner, the info panel provides real-time liquidity statistics:
Buy-Side Zones
• Count of active BSL zones above current price
• Higher number = More upside targets for price
Sell-Side Zones
• Count of active SSL zones below current price
• Higher number = More downside targets for price
Total Zones
• Combined count of all active liquidity
• Useful for gauging overall market structure
Nearest BSL
• Distance in % to closest Buy-Side Liquidity above
• Example: +2.5% means BSL is 2.5% above current price
• Quick reference for next upside target
Nearest SSL
• Distance in % to closest Sell-Side Liquidity below
• Example: -1.8% means SSL is 1.8% below current price
• Quick reference for next downside target
Liquidity Bias
• ⬆️ Bullish : More BSL than SSL (upside targets dominate)
• ⬇️ Bearish : More SSL than BSL (downside targets dominate)
• ↔️ Balanced: Equal liquidity on both sides (range-bound)
━━━━━━━━━━━━━━━━━━━━━━━━━━━━
🎓 Understanding Liquidity Strength
What Do The Numbers Mean?
Strength 1 : Single swing point
• Light liquidity, minor target
• Can be ignored in trending markets
• Useful in ranging/choppy conditions
Strength 2-3 : Moderate liquidity cluster
• Multiple nearby swing points merged
• Decent target for intraday moves
• Watch for potential sweeps
Strength 4-5 : Strong liquidity cluster
• Major cluster of stops
• High-probability target for institutions
• Expect reactions when swept
Strength 6+ : Extreme liquidity pool
• Massive stop cluster (rare)
• Critical zone - high probability of sweep
• Often marks major support/resistance
• Ideal for confluence setups
━━━━━━━━━━━━━━━━━━━━━━━━━━━━
📱 Alert Setup
This indicator includes 2 powerful alert types:
1. Buy-Side Liquidity Sweep
• Triggers when price sweeps BSL zone above
• Shows potential bullish reversal opportunity
• Often precedes upward continuation after sweep
2. Sell-Side Liquidity Sweep
• Triggers when price sweeps SSL zone below
• Shows potential bearish reversal opportunity
• Often precedes downward continuation after sweep
To Set Up Alerts:
1. Click the "Alert" button (clock icon) in TradingView
2. Condition: Select "Liquidity Heatmap"
3. Choose alert type: BSL Sweep or SSL Sweep
4. Configure notification method (push, email, webhook)
5. Click "Create"
Pro Tip: Set alerts for both BSL and SSL sweeps to catch opportunities in both directions
━━━━━━━━━━━━━━━━━━━━━━━━━━━━
💎 Pro Tips & Best Practices
✅ DO:
• Wait for confirmation - Don't enter immediately on sweep, wait for reversal pattern
• Combine with trend - SSL sweeps in uptrends = higher probability longs
• Check multiple timeframes - 1H liquidity + 4H liquidity = strongest zones
• Monitor strength - Focus on zones with strength 3+
• Use proper risk management - Liquidity sweeps can go further than expected
• Watch for re-sweeps - Sometimes liquidity zones get swept multiple times
• Consider volume - High volume sweeps = stronger reversal potential
⚠️ DON'T:
• Don't fade strong trends - In strong trends, sweeps often continue rather than reverse
• Don't overtrade - Not every sweep is a tradeable setup
• Don't ignore context - Check broader market conditions and news
• Don't use alone - Combine with price action, support/resistance, and other analysis
• Don't place stops at liquidity - Your stops will be hunted
• Don't expect perfection - Some sweeps fail, some zones never get hit
🎯 Best Timeframes:
• Scalping: 5min, 15min (fast moves, frequent sweeps)
• Day Trading: 15min, 1H (balanced view)
• Swing Trading: 1H, 4H, Daily (major liquidity zones)
• Position Trading: 4H, Daily, Weekly (institutional liquidity)
🔥 Best Markets:
• Crypto (high volatility, frequent liquidity grabs)
• Forex (EUR/USD, GBP/USD - liquid pairs)
• Futures (ES, NQ, CL - high liquidity contracts)
• Stocks (large caps with high volume)
⏰ Best Times:
• Market opens (high volatility = liquidity hunting)
• Before/after major news events
• Session overlaps (London/NY for forex)
• First hour and last hour of trading
━━━━━━━━━━━━━━━━━━━━━━━━━━━━
🚀 What Makes This Different?
Unlike basic pivot indicators, the Liquidity Heatmap:
• Institutional Perspective - Shows where smart money hunts stops
• Dynamic Clustering - Automatically groups nearby levels for clarity
• Strength Tracking - Not just where, but HOW MUCH liquidity exists
• Auto-Cleanup - Removes swept and old liquidity automatically
• Visual Clarity - Instant understanding of market structure
• Actionable - Clear targets and reversal zones for trading
• Real-Time Updates - Adapts as market structure evolves
Based On Professional Concepts:
• Order flow analysis
• Market maker behavior
• Institutional trading techniques
• Liquidity engineering principles
━━━━━━━━━━━━━━━━━━━━━━━━━━━━
📈 Common Liquidity Patterns
Pattern 1: The Double Sweep
• Price sweeps SSL below, reverses up
• Price sweeps BSL above, reverses down
• Back to original range
• Trading: Fade the second sweep for mean reversion
Pattern 2: The Cascade
• Multiple SSL zones stacked below
• Price sweeps first zone, continues to next
• Chain reaction of stop losses triggering
• Trading: Ride the momentum to lowest zone
Pattern 3: The Fake-Out
• Price approaches liquidity but doesn't quite sweep
• Reverses before hitting the zone
• "Scared money" didn't wait for full sweep
• Trading: Wait for actual sweep, don't anticipate
Pattern 4: The Absorption
• Price sweeps major liquidity zone (strength 5+)
• No reversal, just consolidation
• Institutions absorbed all liquidity
• Trading: Wait for breakout direction, likely continuation
━━━━━━━━━━━━━━━━━━━━━━━━━━━━
📈 Upgrade Your Trading Arsenal
This free indicator gives you institutional-level liquidity analysis. Want more?
🔥 Check out my premium scripts for:
• Automated entry signals with liquidity confirmation
• Multi-timeframe liquidity analysis
• Advanced stop loss management that avoids liquidity zones
• Backtested strategies with performance tracking
• Custom alerts for high-probability setups
• And much more...
👉 Visit my profile to see all available tools!
━━━━━━━━━━━━━━━━━━━━━━━━━━━━
📝 Important Notes
• Liquidity analysis is one piece of the puzzle - use with other analysis methods
• Not all liquidity zones get swept - some remain untouched
• Market conditions change - adapt your strategy accordingly
• Always use proper position sizing and risk management
• Liquidity sweeps can be violent - use appropriate stop losses
• Practice on demo accounts before trading with real capital
• Past liquidity patterns don't guarantee future price action
Disclaimer: This indicator is for educational purposes. Trading involves risk. Always do your own research and never risk more than you can afford to lose.
━━━━━━━━━━━━━━━━━━━━━━━━━━━━
🙏 Support This Work
If you find this indicator valuable:
• ⭐ Give it a thumbs up
• 💬 Share your best liquidity sweep trades in the comments
• 🔔 Follow for more free professional-grade tools
• 🚀 Share with traders who need to understand liquidity
Got questions? Drop a comment and I'll help you master liquidity trading!
━━━━━━━━━━━━━━━━━━━━━━━━━━━━
Developed with ❤️ for traders who want to think like institutions
━━━━━━━━━━━━━━━━━━━━━━━━━━━━
Version History
• v1.0 - Initial release with dynamic liquidity detection and clustering

Liquidity Radar by DGTLiquidity Radar is an advanced indicator designed to uncover and visualize critical liquidity zones on the price chart. These zones mark areas where stop orders and limit orders are densely concentrated—price levels where large-scale liquidation events are more likely to occur. Such areas are often targeted by institutional players to spark volatility or to optimize trade execution.
The indicator dynamically draws horizontal levels that reflect real-time liquidity buildup based on volume and price activity. When multiple liquidation levels cluster near the same price, overlapping lines highlight zones of elevated liquidity—helping traders identify potential hotspots for price reactions, reversals, or volatility spikes.
KEY FEATURES
⯌ Magnet Zones
Clusters of liquidation levels may act as magnets for price, pulling market movement toward them. Traders often use these zones to forecast directional bias and identify high-probability setups.
⯌ Support/Resistance Zones
Densely packed liquidity often behaves as dynamic support or resistance. These zones can provide major players with optimal entry or exit points, potentially leading to sharp reactions or market reversals.
⯌ Rapid Move Zones
Areas with sparse liquidity levels often experience faster price movement, as fewer resting orders are available to absorb aggressive taker orders. These zones can lead to quick price sweeps and momentum surges.
INSIGHTS
What Happens After Price Reaches a High Liquidity Zone?
Liquidity is "Grabbed"
These zones are typically filled with stop-losses or resting orders. When price reaches them, large volumes are executed — often suddenly. This is known as a liquidity grab or stop hunt .
Increased Volatility
The execution of clustered orders often triggers bursts of volatility. This can result in large wicks, rapid price movements, or deceptive “fakeouts” around the zone.
Price Reaction Scenarios
Stall or Consolidation : After liquidity is grabbed, price may pause or range, especially if market participants are indecisive.
Reversal : If the liquidity grab flushes out weak hands, price may reverse sharply — often where institutional players are already positioned in the opposite direction.
Continuation : Sometimes, the zone acts as a launchpad — price consumes the liquidity and continues strongly in the same direction.
What Happens When Price Is Between Liquidity Zones?
Faster Price Moves
In areas with fewer clustered liquidity levels, price often moves quicker due to fewer resting orders absorbing aggressive taker orders, enabling market orders to push price rapidly through these zones.
Higher Probability of Market (Taker) Orders
Sparse liquidity encourages taker orders, which “take” liquidity instantly, causing sharp and sometimes unpredictable price swings.
Reduced Support or Resistance
The lack of dense liquidity means fewer natural price barriers, allowing price to sweep through these zones with less friction until it nears the next liquidity cluster.
Increased Volatility and Potential Whipsaws
Rapid movement in low liquidity zones can trigger stop losses or cause fakeouts, resulting in sudden volatility and quick reversals.
Opportunity for Breakouts or Trend Acceleration
Price breaking from a liquidity zone into a sparse area may gain momentum quickly, leading to strong directional moves or trend continuation.
Liquidity zones aren’t just price targets — they’re high-stakes decision points. Once tapped, they often serve as temporary barriers where price may reverse, stall, or continue, depending on the prevailing order flow and participant intent. In leveraged markets, liquidations play a crucial role in shaping price behavior and positioning. The Liquidity Levels indicator helps traders spot where these impactful moments are most likely to occur — enhancing both strategic edge and decision-making confidence.
LIMITATIONS
Due to a technical limitation in Pine Script, a maximum of 500 horizontal levels can be drawn. As a result, some historical liquidity levels from earlier bars may not appear on the chart.
DISCLAIMER
This script is intended for informational and educational purposes only. It does not constitute financial, investment, or trading advice. All trading decisions made based on its output are solely the responsibility of the user.
Skrip berbayar

Liquidity Analysis🙏🏻 Liquidity Analysis is 1 of 2 structural layer / orderflow layer analysis scripts. Both are independent so can’t be released together as a single script, but should be used together. The second one which is called (Signed) Volume Analysis is incoming.
The same math used in this script can be applied on other types of profile-like data: orderbooks, trading volumes of all options for each strike.
Important: market or volume profile, just as orderbooks and options traded volume by strikes, are all liquidity ‘estimates’, showing where liquidity is more likely or less likely to be. These estimates however, especially combined with other info, are really useful and reliable.
This script works with inferred volumes vs the provided one. It's the better choice for equities, bonds; neutral choice for currencies; and suboptimal choice for natural & artificial commodities.
Contents:
Output description;
How to analyze & use the outputs;
How to use it together with upcoming (Signed) Volume Analysis script;
How did I use both scripts to finish The Leap profitably and skipped many losses.
1. Output description
Color of the profile reflects the liquidity imbalance state: red is negative, purple is neutral, blue is positive.
Bar coloring represents history values of liquidity imbalance for backtesting purposes. It can be turned on/off in the script's Style settings.
Two purple vertical lines represent calculated borders of excessive liquidity (HVN), scarce liquidity (LVN), and sufficient liquidity (NVN) zones.
Vertical dash line marks the moving window end, this way you can be certain over what exact data you see the profile was built.
2. How to analyze & use the outputs
Setup up the script:
Moving window length: set it to ~ ¼ of your data analysis window. E.g if you see on your charts and use ~ 256 bars, set the length to 64.
Native tick size multiplier: leave it at 0 to calculate optimal number of rows automatically, or set it manually to match native tick size multiples you desire.
Use 2 timeframes: main one and a far lower one 3 steps down, just like on the screenshot.
Native lot size multiplier allows to round profile rows themselves to nearest multiples of native lot size. I added this just in case any1 needs it.
Find out current liquidity imbalance state:
As mentioned before, based on profile color, it can be negative, neutral or positive. This is the state variable that changes slowly and denies/confirms the signals that would be explained in the minute.
I use my own statistically grounded imbalance metric (no hardcoded/learned thresholds), that unlike mainstream imbalance metrics (e.g orderbook imbalance as sum of bids vs sum of asks) provides a natural neutral zone, when liquidity imbalance is ofc there but not strong enough to be considered.
…
Profile-based signals: look at profile shape vs 2 vertical purple lines.
where profile rows exceed the left purple line, these prices are considered HVN. Too much potential liquidity is there.
where profile rows don’t exceed the right purple line, these prices are considered LVN. Potential thin/lack of liquidity is expected there.
where profile rows are in between these 2 purple lines, these are NVN, or neutral liquidity zones.
Trading ruleset itself is based on couple of simple rules:
Only! Use limit orders hence provide liquidity in LVNs and Only! use stop-market orders hence consume liquidity in HVNs;
These orders should be put in advance ‘only’. This is how you discover the direction or orders: you can only put sell limit orders above you and buy limit orders below you, and you can only put buy stop orders above you, and sell stop orders below you.
This is really it. It may look weird, but once you just try to follow these 2 rules letter by letter for 1 hour, you’ll see how liquidity trading works.
Now once you know that, just don’t open new trades against the liquidity imbalance state. So don’t open shorts when the profile is blue, and don’t open longs when it’s red.
The last part is multi-timeframe logic. Prefer to act when a lower timeframe is Not against the main timeframe. That’s all, no multiple higher timeframes are needed.
3. How to use it together with upcoming (Signed) Volume Analysis script.
That upcoming script would also have a mean to generate its own signals, and another state variable called volume imbalance.
So now you’re not only looking at liquidity imbalance but also at volume imbalance that would deny/confirm a profile based signal. You need at least one of these to favor your long or short.
This is the same logic widely used in HFT, where MM bots cancel/shift/resize orders when book is too onesided And ordeflow is one sided as well.
4. How did I use both scripts to finish The Leap profitably and skipped many losses.
Even tho you can use structural information as your main strategic layer, as many so-called orderflow traders do, I traded in objective style: my fade signals were volatility based in essence, and I used ordeflow for better entries and stops, but most importantly to skip losses.
When ‘both‘ liquidity imbalance and volume imbalance (in their main timeframes) were against my trades, I skipped them all, saving many ~$500 stop losses (that was my basis risk unit for the Leap). Unless I had a very strong objective signal, i.e confluence of several signals, or just one higher timeframe signal, I did all these skips.
I traded ~ intraweek timeframe, so I was analyzing either the last 230 30min bars or 1380 5min bars. Both Liquidity Analysis and (signed) Volume Analysis scripts were set to moving window length 46 or 276 for either granulary.
I finished the leap with 9% profit and max DD ~ 5%, a bit short of my goal of 12.5%. If not these 2 scripts I would’ve finished a bit above breakeven I think.
∞

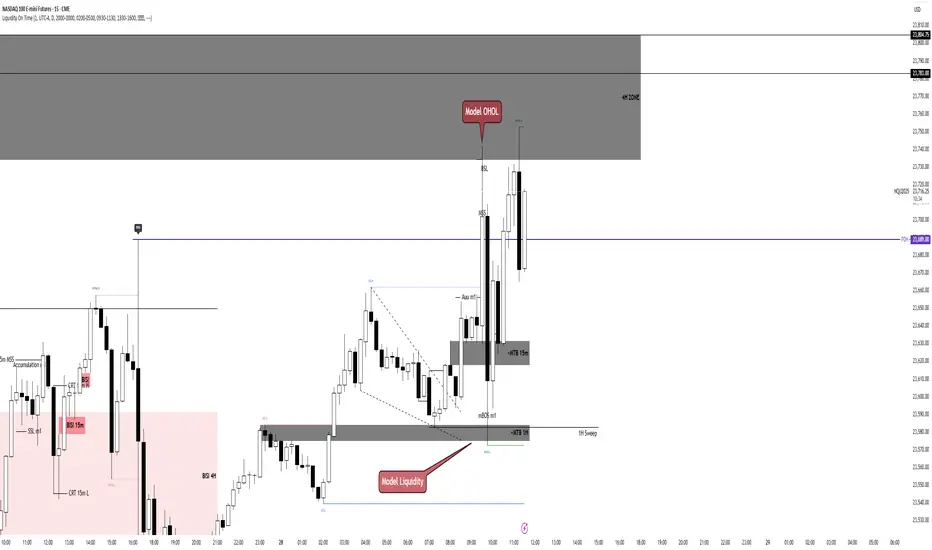
Liquidity On TimeIn ICT, liquidity means pools of orders resting in the market.
These are usually stop-losses or pending orders from retail traders.
Liquidity on time combines liquidity with the time-of-day element.
ICT teaches that markets deliver liquidity at specific trading sessions.
Main sessions: London Open (2–5 AM EST) and New York Open (7–10 AM EST).
These times concentrate order flow, creating high-probability moves.
Smart Money hunts liquidity at those hours, not randomly.
Example: During London Open, stops above Asian range = liquidity target.
New York session often sweeps London highs/lows before real move.
Thus, timing tells us when liquidity will likely be attacked.
"Liquidity on time" = confluence of where liquidity sits and when it’s taken.
It explains why moves often happen at precise clock times, not anytime.
Traders use it to avoid chasing price outside killzones.
ICT emphasizes “time & price” must agree for valid setups.
Price alone is incomplete; time confirms when Smart Money acts.
This prevents overtrading in quiet hours.
Example setup: Liquidity sweep at 9:30 AM NYSE open → entry trigger.
Liquidity on time also explains engineered stops runs before news.
The concept ties into Killzones, FVGs, and SMT divergence.
In short, Liquidity on Time = knowing WHEN liquidity will be raided.
Liquidity and S&R Zones╔══════════════════════════════════════════════════════════════════════╗
║ Description ║
╚══════════════════════════════════════════════════════════════════════╝
This indicator identifies liquidity zones and support/resistance (S&R) levels
using pivot points and volume analysis. Liquidity zones highlight areas of high
trading activity, while S&R levels mark key price levels where price may reverse
or break. Breakouts are confirmed with a volume oscillator and visualized with
shapes. Alerts are provided for significant S&R breakouts.
╔══════════════════════════════════════════════════════════════════════╗
║ User Guide ║
╚══════════════════════════════════════════════════════════════════════╝
#### Overview
This indicator detects liquidity zones and support/resistance (S&R) levels
using pivot points and volume analysis. Liquidity zones highlight areas of
high trading activity, often targeted by institutional traders. S&R levels
indicate key price levels where price may reverse or break, with breakouts
confirmed by a volume oscillator. The indicator is designed for traders
seeking to trade breakouts or reversals at critical levels.
#### Features
- **Liquidity Zones**: Identifies pivot highs/lows with high-volume confirmation.
- **Support/Resistance Levels**: Plots dynamic S&R lines based on pivot points.
- **Breakout Signals**: Displays shapes for price crossing S&R levels with volume confirmation.
- **Volume Oscillator**: Uses short/long EMA difference to confirm breakouts.
- **Alerts**: Notifies users of support/resistance breakouts.
#### Input Parameters
- **Liquidity Settings**:
- *Liquidity Lookback Period*: Bars for average volume (default: 50).
- *Liquidity Volume Threshold Multiplier*: Volume multiplier for liquidity zones (default: 1.5).
- *Liquidity Pivot Lookback*: Bars for pivot detection (default: 5).
- **S&R Settings**:
- *Show Breaks*: Toggle breakout shapes (default: true).
- *Left/Right Bars*: Bars for S&R pivot detection (default: 15).
- *S&R Volume Threshold*: Minimum oscillator value for breakouts (default: 20).
- **Style Settings**: Predefined colors for liquidity and S&R visualization.
#### Usage
1. Apply the indicator to a chart (e.g., 1H, 4H, or D timeframes recommended).
2. Adjust input parameters to suit the instrument and timeframe:
- Increase `liqLookback` for smoother volume averages on lower timeframes.
- Adjust `leftBars` and `rightBars` for more/less sensitive S&R levels.
- Set `srVolumeThresh` based on typical oscillator values (plot `osc` to calibrate).
3. Monitor liquidity zones (red/green/yellow crosses) and S&R lines (red/green).
4. Watch for breakout signals (shapes) when price crosses S&R levels with volume confirmation.
5. Set up alerts for "Support Broken" or "Resistance Broken" to receive notifications.
#### Recommended Settings
- **Timeframes**: 1H, 4H, or D for reliable signals.
- **Instruments**: Assets with good volume (e.g., crypto, forex, indices).
- **Liquidity**: Increase `liqVolumeThreshold` (e.g., 2.0) for stricter zones.
- **S&R**: Use `leftBars = rightBars = 10` for faster markets.
#### Cautions
- Ensure sufficient chart history for pivot and volume calculations.
- High `liqLookback` or `leftBars` may delay signals on lower timeframes.
- Volume oscillator requires accurate volume data; test on reliable instruments.
- Backtest breakout signals, as false breakouts can occur in choppy markets.
#### Customization Ideas
- Add Fibonacci levels to complement S&R zones.
- Integrate with trend indicators (e.g., EMA) to filter breakouts.
- Visualize volume oscillator as a histogram for calibration.
- Extend liquidity zones with boxes to highlight price ranges.
#### Notes
- Combine with other analysis for a complete trading system.
- Test thoroughly in a demo account before live trading.
- Contact the author for support or feature requests.
Happy trading, and may your trades align with the market’s key levels! 🚀

Liquidity Zones [ActiveQuants]The Liquidity Zones indicator detects price areas where high trading volume coincides with below-average volatility , critical zones where large players often accumulate or distribute positions. Ideal for spotting potential reversal points and strategic liquidity pools.
Core Detection Formula
Liquidity Zone = (Volume > SMA(Volume, Length) × Multiplier) AND (Short-Term Volatility < 0.5 × Average Volatility)
Volume Surge Detection
Compares current volume to its SMA (user-defined length).
Multiplies threshold with " Volume Threshold Multiplier " parameter.
Volatility Contraction Filter
Calculates 5-bar volatility (standard deviation of closes).
Compares to average volatility over " Price Std. Dev. Length " period.
Requires short-term volatility < 50% of average.
█ KEY FEATURES
Merging Consecutive Zones
If the " Merge Consecutive Zones " option is enabled, the indicator will:
Calculate the number of consecutive bars that meet the liquidity zone criteria.
Sum the volume of these consecutive bars.
Display only the most recent label for the merged zone (previous labels in the sequence are removed).
Displays volume in either
Raw units (" Units ").
Dollar-equivalent (" Currency Value ") using closing price.
Alerts
An alert condition is built into the script. Traders can selectively enable alerts via TradingView’s alert system. Whenever a liquidity zone is detected, an alert is triggered with the message: " High-volume and low-volatility zone detected! ".
█ USER INPUTS
- Liquidity Zones Color
Sets the background color for liquidity zones.
Default: Orange (with 70 transparency).
- Volume SMA Length
Determines the number of bars over which the volume simple moving average is calculated.
Default: 20 bars.
- Volume Threshold Multiplier
Multiplies the volume SMA to establish a threshold. A bar’s volume must exceed this product to be considered high volume.
Default: 2.0.
- Price Std. Dev. Length
The period used to calculate the standard deviation of the closing prices. This is the basis for measuring average volatility.
Default: 14 bars.
- Zone Volume
A toggle to display a label with the volume value on liquidity zones.
Allows you to choose how the volume is displayed: Units (shows raw volume) or Currency Value (multiplies volume by the current closing price).
Allows you to choose the font size of the volume label.
- Merge Consecutive Zones
When enabled, volumes from consecutive liquidity zones are summed into a single total, and only the most recent label is displayed (previous labels in the sequence are removed).
Default: Enabled.
- Show Last
Specifies the number of bars back that the indicator will evaluate and plot liquidity zones.
Default: 500 bars.
- Timeframe
Analysis period.
Default: Chart.
█ CONCLUSION
The Liquidity Zones indicator is a powerful tool for traders seeking to identify key areas on the chart where liquidity is concentrated, characterized by high volume and low volatility . With customizable settings for volume analysis and volatility measurement , this indicator can be integrated into a wide range of trading strategies. It not only highlights these zones visually but also provides volume data labels and alerts for timely decision-making.
█ IMPORTANT NOTES
⚠ Volume and Volatility Settings: Adjust the Volume SMA Length , Volume Threshold Multiplier , and Price Std. Dev. Length to suit the typical trading volume and volatility of the asset you are analyzing.
⚠ Confirmed Bars Only: Signals are generated only on confirmed bars. This minimizes false signals due to intra-bar noise and also prevents indicator repainting .
⚠ Risk Management: Liquidity zones may signal areas of potential accumulation or distribution, but they should be used in conjunction with other technical analysis tools (e.g., support/resistance levels, trendlines, or momentum indicators). Trading involves risk, and it is recommended to combine this indicator with proper risk management techniques.
█ RISK DISCLAIMER
Trading involves substantial risk of loss. Liquidity zones indicate potential interest areas but don't guarantee price reactions. Always confirm with additional analysis and proper risk management. Past performance is not indicative of future results.
📈 Happy trading! 🚀

Liquidity Depth [Pro+]Description:
Liquidity Depth Pro+ is a trading tool with a remarkable adaptability and perfectly aligned with the intricate demands of the futures, forex, and bond markets. This indicator is based on a concept taught by the Inner Circle Trader (ICT), who explains that institutions tend to dig deeper into Liquidity Pools above highs and below lows. Specifically, ICT mentions how in Forex these Liquidity Depths are classically manifested as 10-20-30 pips respectively.
This tool allows the Analyst to adapt this concept based on their understanding of price. It delves into the essence of institutional trading, exposing deeper liquidity depth pursued by institutional giants and astute bank traders that lay further than the mere extremities of price.
CME_MINI:NQ1! Example (Tuesday):
Price raids Monday's low
Price raids Friday's low
Price digs deeper into one of Friday's Deep Liquidity Pools
Low of the Day Reversal
Note: the Depths used in this example are 30-60-90 points.
Key Features:
Versatility Across Assets: Liquidity Depth Pro+ is finely tailored for futures, forex, and bond markets, making it an all-encompassing solution suitable for a broad range of financial instruments.
Timeframe Customization: Liquidity Depth Pro+ allows users to decide Timeframe Liquidity empowering the analyst with flexibility.
Historical Pools: Choose up to the last 20 highs and lows to mark liquidity pools from the User Selected Timeframe.
Universal Trading Style: Regardless of your trading approach, be it trend-following or reversal models, this indicator embraces all styles. It offers a holistic perspective to navigating liquidity zones above highs and below lows of the chosen Timeframe.
Visual Precision: This indicator visualizes the liquidity depth with a customizable style, allowing the analyst to frame the position of deeper liquidity pools above highs and below lows.
Liquidity Table: Keep track of liquidity levels and unlock faster decision making by taking advantage of the visual Liquidity Table cues.
Adaptive Table Colors: When price is above your desired liquidity pool high, the table will match the liquidity high color to indicate a current liquidity raid or deeper pool being attacked. Vice versa, when price is below your desired liquidity pool low, the table will match the liquidity low color.
Real-Time Alerts: Save Time with live alerts that provide valuable insights into potential opportunities and liquidity purges at your desired liquidity levels.
Other Features:
Choose the Depth Type ("Auto", "Value", "Ticks", "Pips"). The “Auto” feature will select the best unit of measurement for the depths based on the current market on chart.
Choose to show up to Three Liquidity Depths.
Customize the Liquidity Line Style.
Customize the Liquidity Line Color.
Customize the Liquidity Line Width.
Customize Table Size and Location
Usage Guidance:
Add Liquidity Depth to your Tradingview chart.
Customize your desired Timeframe and Liquidity Depths to align with your personal preference.
Observe where the Liquidity Lines manifest above and below your chosen Timeframe’s highs and lows respectively, once they are raided.
Leverage this invaluable information to frame the narrative, whether you opt to pursue liquidity or capitalize on post-purge reversals.
These tools are available ONLY on the TradingView platform.
Terms and Conditions
Our charting tools are products provided for informational and educational purposes only and do not constitute financial, investment, or trading advice. Our charting tools are not designed to predict market movements or provide specific recommendations. Users should be aware that past performance is not indicative of future results and should not be relied upon for making financial decisions. By using our charting tools, the purchaser agrees that the seller and the creator are not responsible for any decisions made based on the information provided by these charting tools. The purchaser assumes full responsibility and liability for any actions taken and the consequences thereof, including any loss of money or investments that may occur as a result of using these products. Hence, by purchasing these charting tools, the customer accepts and acknowledges that the seller and the creator are not liable nor responsible for any unwanted outcome that arises from the development, the sale, or the use of these products.
Finally, the purchaser indemnifies the seller from any and all liability. If the purchaser was invited through the Friends and Family Program, they acknowledge that the provided discount code only applies to the first initial purchase of the Toodegrees Premium Suite subscription. The purchaser is therefore responsible for cancelling – or requesting to cancel – their subscription in the event that they do not wish to continue using the product at full retail price. If the purchaser no longer wishes to use the products, they must unsubscribe from the membership service, if applicable. We hold no reimbursement, refund, or chargeback policy. Once these Terms and Conditions are accepted by the Customer, before purchase, no reimbursements, refunds or chargebacks will be provided under any circumstances.
By continuing to use these charting tools, the user acknowledges and agrees to the Terms and Conditions outlined in this legal disclaimer.
Skrip berbayar

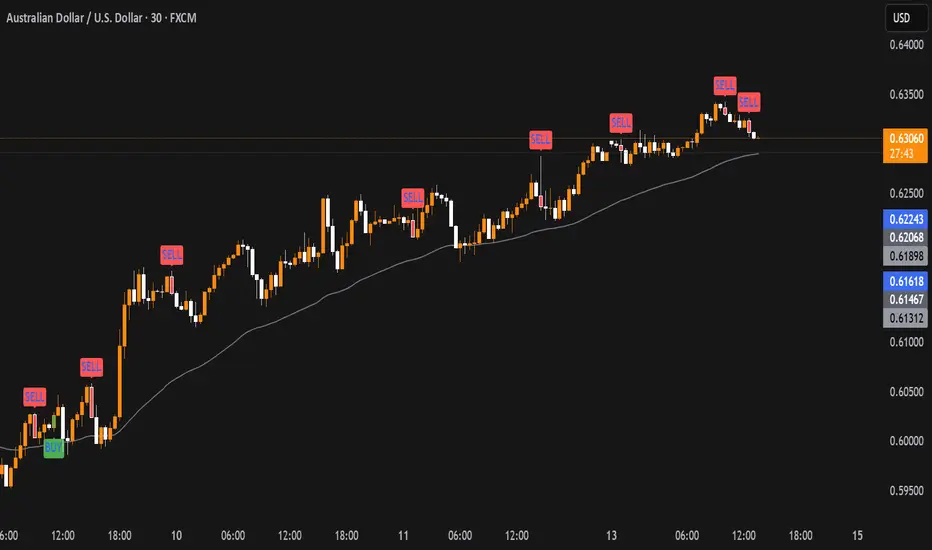
Liquidity Sweep & Reversal — Body Anchored + Risk (v6)Overview
The Liquidity Sweep & Reversal — Locked to Price (v6) indicator identifies liquidity sweeps around major swing highs and lows, confirming reversals when price closes back inside the swept level.
All signals are locked to price (bottom of green candle for BUY, top of red candle for SELL), so they remain perfectly aligned when zooming or scaling.
This indicator is ideal for swing traders and scalpers who trade reversals, liquidity events, and reclaim structures.
How It Works
Detects confirmed swing highs and lows using a pivot-based structure.
Waits for a liquidity sweep — when price wicks beyond a recent swing.
Confirms a reclaim when price closes back inside the previous swing level.
Triggers a BUY or SELL signal anchored to the candle body.
Automatically calculates stop loss and risk using ATR and your inputs.
Input Settings
Swing Detection
Swing Detection Strength: How many bars confirm a swing pivot. Higher = stronger swings.
Bars to Confirm Reclaim: Number of bars after a sweep for price to close back within the swing zone.
Swing Proximity %: How close price must come to a swing to count as a liquidity sweep.
Trend Filter (optional)
Use EMA Trend Filter: When enabled, only BUY in uptrend and SELL in downtrend.
Fast EMA Length / Slow EMA Length: Define EMAs used to detect trend direction.
Risk & Stop Management
ATR Length: Period for ATR calculation (volatility measurement).
Base ATR Stop Buffer (x ATR): Distance of stop loss from entry based on ATR multiplier.
Position Size (quote units): Your total position size in quote currency (e.g., USDT).
Risk % of (Position / 20): Defines how much of your position to risk per trade.
Example: (Position / 20) × Risk % = per-trade risk.
Chart Elements
BUY Arrow (green): Appears after a liquidity sweep and reclaim near a swing low.
SELL Arrow (red): Appears after a sweep and reclaim near a swing high.
Labels: Display entry price, stop loss (SL), and calculated risk dollar value.
EMAs: Optional fast/slow moving averages for directional bias.
Dynamic Stops: Adjust automatically using ATR × risk settings.
Trading Tips
Use BUY signals near liquidity sweeps under swing lows.
Use SELL signals near liquidity sweeps above swing highs.
Adjust swing length for different timeframes:
Lower values for scalping (3–5)
Higher values for swing trading (7–10)
Respect stop loss levels and use risk control settings for consistent sizing.
Combine with volume, OBV, or structure for confirmation.
Alerts
BUY — Locked to Price: "BUY: swing low reclaimed with dynamic stop."
SELL — Locked to Price: "SELL: swing high reclaimed with dynamic stop."
Best Use Cases
Liquidity-based reversals
Swing entry confirmation
Stop hunt reclaims
Structure-based entries
Author
Created by @roccodallas
For traders who value clean structure, risk control, and chart precision.

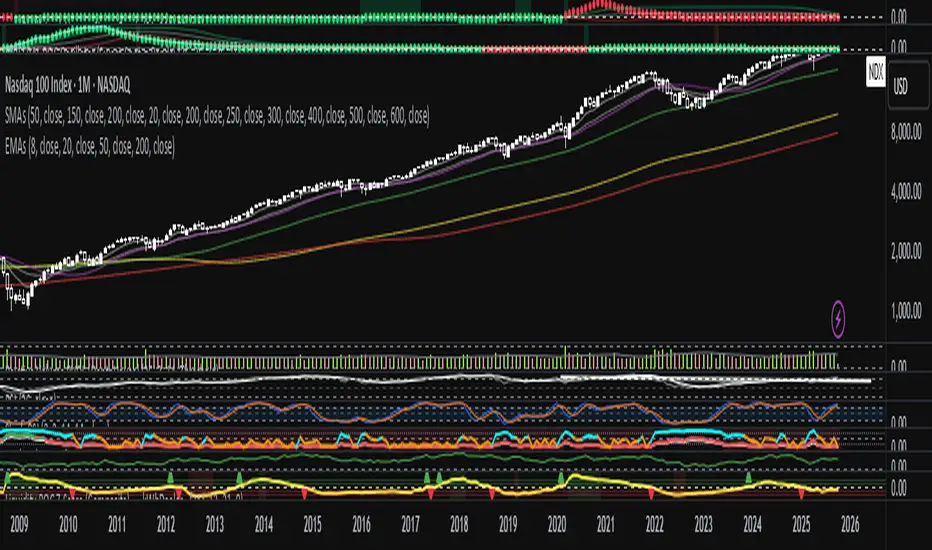
Liquidity ROC Z-Score (Composite) — kWhDealer_Developed by @kWhDealer_, this indicator tracks the rate-of-change and standard-deviation momentum of U.S. system liquidity by combining key Federal Reserve and Treasury data:
Composite Liquidity
=
WALCL
−
WTREGEN
−
RRPONTSYD
+
MTSDS133FMS
Composite Liquidity=WALCL−WTREGEN−RRPONTSYD+MTSDS133FMS
It measures the flow of liquidity available to markets—integrating monetary policy (Fed balance sheet, reverse repo, TGA) with fiscal policy (Treasury deficit spending).
The script converts this composite into a Rate-of-Change (ROC) oscillator and expresses it as a Z-Score, with ±1 σ / ±2 σ bands to highlight over- and under-injection regimes.
Z > +1 σ → expanding liquidity → risk-on bias
Z < –1 σ → contracting liquidity → risk-off bias
Crosses of 0 often precede equity index inflections by ~1–2 months
This oscillator serves as a leading macro gauge for shifts in liquidity-driven risk appetite across equities, credit, and crypto.
Liquidity Sweep ReversalOverview
The Liquidity Sweep Reversal indicator is a sophisticated intraday trading tool designed to identify high-probability reversal opportunities after liquidity sweeps occur at key market levels. Based on Smart Money Concepts (SMC) and Institutional Order Flow analysis, this indicator helps traders catch market reversals when stop-loss clusters are hunted.
Key Features
🎯 Multi-Level Liquidity Analysis
Previous Day High/Low (PDH/PDL) detection
Previous Week High/Low (PWH/PWL) tracking
Session highs/lows for Asian, London, and New York markets
Real-time level validation and usage tracking
⚡ Advanced Signal Generation
CISD (Change In State of Delivery) detection algorithm
Engulfing pattern recognition at key levels
Liquidity sweep confirmation system
Directional bias filtering to avoid false signals
⏰ Kill Zone Integration
Pre-configured optimal trading windows
Asian Kill Zone (20:00-00:00 EST)
London Kill Zone (02:00-05:00 EST)
New York AM/PM Kill Zones (08:30-11:00 & 13:30-16:00 EST)
Optional kill zone-only trading mode
🛠 Customization Options
Multiple timezone support (NY, London, Tokyo, Shanghai, UTC)
Flexible HTF (Higher Time Frame) selection
Adjustable signal sensitivity
Visual customization for all levels and signals
Hide historical signals option for cleaner charts
How It Works
The indicator continuously monitors price action around key liquidity levels
When price sweeps liquidity (stop-loss hunting), it marks potential reversal zones
Confirmation signals are generated through CISD or engulfing patterns
Trade signals appear as arrows with color-coded candles for easy identification
Best Suited For
Intraday traders focusing on 1m to 15m timeframes
Smart Money Concepts (SMC) practitioners
Scalpers looking for high-probability reversal entries
Traders who understand liquidity and market structure
Usage Tips
Works best on liquid forex pairs and major indices
Combine with volume analysis for stronger confirmation
Use proper risk management - not all signals will be winners
Monitor higher timeframe bias for better accuracy
==============================================
日内流动性掠夺反向开单指标
指标简介
这是一款基于Smart Money概念(SMC)开发的高级日内交易指标,专门用于识别市场在关键价格水平扫除流动性后的反转机会。通过分析机构订单流和流动性分布,帮助交易者精准捕捉止损扫单后的市场反转点。
核心功能
多维度流动性分析
前日高低点(PDH/PDL)自动标记
前周高低点(PWH/PWL)动态跟踪
亚洲、伦敦、纽约三大交易时段高低点识别
关键位使用状态实时监控,避免重复信号
智能信号系统
CISD(Change In State of Delivery)算法检测
关键位吞没形态识别
流动性扫除确认机制
方向过滤系统,大幅降低虚假信号
黄金交易时段
内置Kill Zone时间窗口
支持亚洲、伦敦、纽约AM/PM四个黄金时段
可选择仅在Kill Zone内交易
时区智能切换,全球交易者适用
个性化设置
支持多时区切换(纽约/伦敦/东京/上海/UTC)
HTF周期自动适配或手动选择
信号灵敏度可调
所有图表元素均可自定义样式
历史信号隐藏功能,保持图表整洁
适用人群
日内短线交易者(1分钟-15分钟)
SMC交易体系践行者
追求高胜率反转入场的投机者
理解流动性和市场结构的专业交易者
使用建议
推荐用于主流加密货币、外汇对和股指期货
配合成交量分析效果更佳
严格止损,理性对待每个信号
关注更高时间框架的趋势方向
风险提示: 任何技术指标都不能保证100%准确,请结合自己的交易系统和风险管理使用。

Liquidity LinesLiquidity Lines Indicator
This advanced TradingView indicator identifies key liquidity zones on your price chart by detecting bullish and bearish engulfing candles, which often signify areas where liquidity accumulates. It helps traders visually spot potential support and resistance levels created by market participants’ stop-loss orders or pending orders.
Key Features :
-Aggregated Bars Option : Smooth out price data by grouping bars together, enabling clearer liquidity zone identification on higher timeframes or noisy charts.
-Upper Liquidity Lines : Displays dashed lines at recent highs where bearish engulfing patterns indicate potential resistance or supply zones.
-Lower Liquidity Lines : Displays dashed lines at recent lows where bullish engulfing patterns suggest potential support or demand zones.
-Customizable Colors : Choose your preferred colors for bullish (default black) and bearish (default white) liquidity lines for better visual distinction.
-Automatic Line Cleanup : Maintains chart clarity by automatically removing old liquidity lines after a configurable limit.
-Dynamic Alerts : Trigger alerts when price breaches upper or lower liquidity lines, signaling potential breakout or reversal opportunities.
Use Cases :

Liquidity Fair Value Bands | QuantumResearch 🔹 Liquidity Fair Value Bands | QuantumResearch
A Dynamic Liquidity-Based Fair Value Model Using Volume-Weighted Linear Regression and Deviation Bands
📘 Overview
The Liquidity Fair Value Bands is a specialized volatility and valuation indicator designed to help traders identify dynamic fair value zones based on liquidity-adjusted price behavior. Unlike standard deviation bands or traditional moving averages, this tool integrates volume-weighted linear regression to estimate a fair value baseline — a more accurate representation of price equilibrium under active market participation.
This script is not a simple mashup of existing indicators. It introduces a novel concept by fusing the following elements:
📊 Volume-Weighted Linear Regression (VWLR) to determine the fair value baseline
📈 Standard Deviation Bands layered around this baseline to visualize statistically significant deviations
🔄 Trend Signals derived from slope direction and baseline crossover
🎨 Gradient-Based Visual Modes for enhanced readability
🚨 Built-in Alerts for overbought/oversold and trend breakout conditions
🧠 Concept & Calculation
🟩 1. Fair Value Baseline (Core Innovation)
The baseline is calculated using a volume weighted linear regression.
This formula ensures that higher-volume periods influence the regression line more heavily, offering a liquidity-aware estimate of what the asset is “really worth” based on market consensus.
A positive slope indicates a growing fair value — bullish environment
A negative slope signals declining fair value — bearish environment
📏 2. Deviation Bands
Three layers of symmetric deviation bands are plotted above and below the baseline, each representing a multiple of standard deviation (1σ, 2σ, 3σ) over the same lookback period:
Upper Bands highlight statistically significant overvaluation
Lower Bands indicate undervaluation and potential reversion zones
These zones are visualized using translucent color fills to help traders instantly interpret risk/reward conditions.
🔄 3. Trend Detection
Optionally, the indicator displays up/down arrows when the price crosses the fair value baseline and a new trend is forming:
✅ Uptrend: Price crosses above baseline and baseline slope increases
🔻 Downtrend: Price drops below baseline and slope declines
These dynamic signals allow you to react to trend reversals early, rather than waiting for lagging confirmation.
🎯 How to Use
This tool excels in trend-trading, mean reversion, and liquidity-based fair value analysis.
✅ Buy Zones: Price enters lower bands (e.g. -1σ to -3σ) during lower fair value zone
❌ Sell Zones: Price enters upper bands (e.g. +1σ to +3σ) during higher fair value
🕵️♂️ Fair Value Confirmation: Flat baseline in consolidating markets helps avoid chop
📈 Trend Entry: Use baseline crossovers and band inflections to time entries
⚙️ Customization Features
🔧 Adjustable regression length and offset
🎨 Eight visual modes for light/dark themes
🔔 Optional alerts for significant band breaches (1σ, 2σ, 3σ)
🟡 Toggle individual band visibility (1st, 2nd, 3rd) for cleaner UI
⚡ Optional trend signal arrows
🧪 Interpretation Example
If the current price trades 2+ standard deviations above the liquidity-based fair value line, it likely indicates:
A short-term overbought market
Potential for mean reversion
Or signal that a strong trend breakout is underway (confirm with slope direction)
✅ Why It’s Unique
This is not just a Bollinger Bands variant — it is a liquidity-aware fair value model with enhanced statistical depth. The baseline adapts to both price and volume, unlike simple moving averages that assume equal importance across all candles.
It combines three important market principles:
🎯 Price Action
🏦 Liquidity Weighting
📊 Volatility Analysis
All in one clean and visually intuitive script.
📢 Disclaimer
This indicator is for educational purposes only and is not financial advice. Always use additional confluence and proper risk management in your trading.

Liquidity Sweep with EMAThis Pine Script indicator helps traders identify potential market reversals based on liquidity sweeps, where the price moves through the previous candle's low or high and then closes above or below the previous candle's wick. These are often seen as significant market moves or liquidity grabs before a potential reversal or continuation.
The indicator is also equipped with an EMA (Exponential Moving Average) as an optional visual aid to give traders a sense of the prevailing trend, though it is not used as part of the signal generation logic.
Key Features:
Liquidity Sweep Detection:
Bullish Sweep: Triggered when the current candle sweeps below the low of the previous candle and then closes above the high of the previous candle. This indicates a potential market reversal to the upside after the liquidity sweep.
Bearish Sweep: Triggered when the current candle sweeps above the high of the previous candle and then closes below the low of the previous candle. This indicates a potential market reversal to the downside after the liquidity sweep.
EMA:
The EMA (50) is plotted on the chart for visual trend guidance. While it is not used to confirm the signals, it can help traders see if the market is in a general uptrend or downtrend.
Signal Presentation:
Buy Signal: The indicator will plot a green upward arrow below the candle when a bullish liquidity sweep is detected.
Sell Signal: The indicator will plot a red downward arrow above the candle when a bearish liquidity sweep is detected.
Timeframe Filter:
The indicator only generates signals on the following timeframes: 30-minute, 1-hour, 4-hour, and Daily. This helps to ensure the sweeps are significant and likely to result in meaningful price moves.
Alerts:
Alerts can be set up for both bullish and bearish sweep signals, so traders can be notified when these events occur.
Customizable:
EMA Length: The length of the Exponential Moving Average (EMA) can be adjusted. By default, it is set to 50, but you can modify this to fit your trading strategy.
Show EMA Option: You can toggle whether or not to display the EMA line on the chart.
How It Works:
The indicator looks for price action patterns where the current candle sweeps through the high or low of the previous candle and closes beyond the previous wick.
These patterns are often seen as potential traps, where the price initially moves in one direction (sweeping the liquidity) and then quickly reverses, making them important for traders who want to catch reversals or breakouts after a liquidity sweep.
The EMA (50) gives a general trend direction but doesn't directly affect the trade signals. It serves as a visual reference for trend analysis.
Potential Use Cases:
Reversal Trading: Traders can use this indicator to catch reversals after a liquidity sweep. The green upward arrows may indicate a bullish reversal, while the red downward arrows may indicate a bearish reversal.
Trend Trading: The EMA can help traders gauge the overall market trend. If the price is above the EMA, the market may be in an uptrend, and traders may focus on bullish sweeps. Conversely, if the price is below the EMA, the market may be in a downtrend, and traders may focus on bearish sweeps.
Confirmation with Other Indicators: Although the EMA is not used to confirm signals in this script, it can be combined with other indicators (like RSI, Volume, or MACD) to enhance the accuracy of your trades.
Final Thoughts:
This script is designed to identify liquidity sweeps and price reversals based on price action alone, without relying on complex indicators. The optional EMA serves as a helpful tool for understanding the overall market trend. It’s ideal for traders looking to spot potential reversal points after significant price sweeps and is suitable for multiple timeframes (30m, 1h, 4h, Daily).
You can use this description to help potential users understand the functionality of your indicator when publishing it on TradingView or selling it as an invite-only script. Let me know if you need any adjustments or further details!
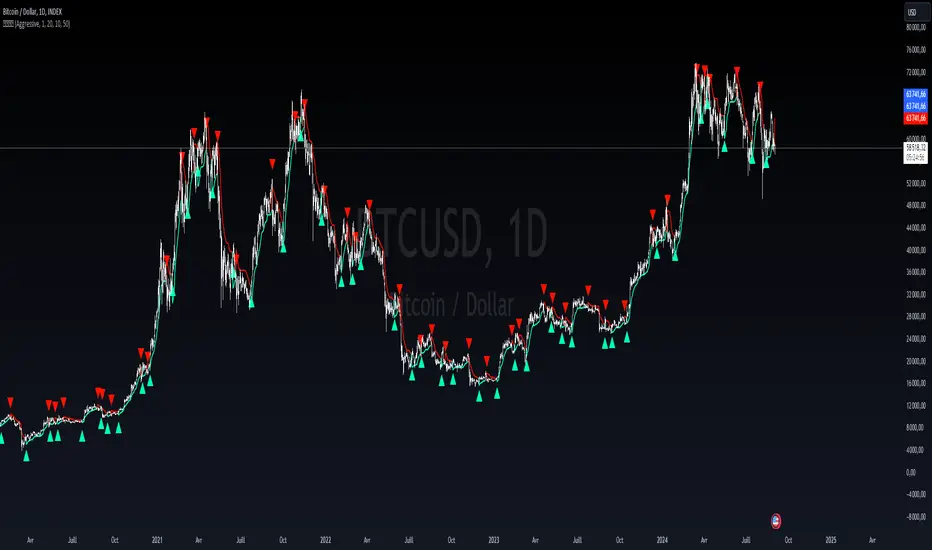
Liquidity weighted SupertrendOverview
The Liquidity Weighted Supertrend Indicator (LWST) is an advanced iteration of the traditional Supertrend indicator, meticulously crafted to improve trend detection by incorporating liquidity into its calculations. By weighting price movements according to trading volume, the LWST becomes more responsive to significant market activities, offering traders a more accurate depiction of market trends.
Indicator Description
The Liquidity Weighted Supertrend Indicator is a versatile and adaptive tool designed to assist traders in recognizing trends and potential reversal points within the market. This indicator features two operational modes: Aggressive and Smoothed, allowing traders to tailor trend detection to their specific trading style and market conditions.
Key Features
Two Supertrend Modes:
Aggressive Mode: This mode offers more responsive signals, ideal for short-term trading. It utilizes an Exponential Moving Average (EMA) to smooth the price data, resulting in quicker reactions to market changes.
Smoothed Mode: This mode provides more stable signals, suitable for longer-term trading, by employing a Simple Moving Average (SMA). Note that when "Smoothed" mode is selected, the "Fast MA length" input is not utilized, focusing instead on producing smoother trend lines.
LWMA Calculation:
The Liquidity Weighted Moving Average (LWMA) is a distinctive feature of the LWST, blending volume and price action to filter out market noise and pinpoint significant price movements. This calculation begins with the liquidity factor, determined by multiplying volume with the price change, which is then smoothed using an EMA for accuracy.
Customizable Parameters:
Factor: Adjusts the Supertrend line's sensitivity to price movements.
Supertrend Length: Defines the lookback period for the Average True Range (ATR) calculation, which affects the width of the Supertrend channel.
Fast and Slow MA Lengths: Allows customization of the fast and slow moving averages used in the LWMA calculation, offering further control over the indicator's responsiveness.
How the Indicator Works
LWMA Smoothing:
The LWST calculates liquidity by multiplying volume with the absolute difference between the close and open prices. This liquidity value is smoothed using an EMA and compared to its standard deviation, identifying significant price movements. Depending on the selected mode, the price data (hl2) is smoothed either with an EMA (in Aggressive Mode) or an SMA (in Smoothed Mode). It’s important to note that when Smoothed mode is active, the "Fast MA length" input does not affect the output.
Visual Signals:
The Supertrend line is visually represented on the chart, with different colors indicating bullish (lime) and bearish (red) trends.
Buy and sell signals are clearly marked with arrows: green triangles indicate potential buying opportunities (when the price crosses above the Supertrend line), and red triangles suggest selling opportunities (when the price crosses below the Supertrend line).
Additional arrows may appear, signaling potential trend reversals, providing further confirmation for traders.
How to Use the Indicator
Configuring the Indicator:
Supertrend Type: Choose between Aggressive and Smoothed modes depending on your trading strategy and the current market conditions. Aggressive mode is better suited for shorter timeframes, while Smoothed mode provides more consistent signals for longer-term analysis.
Factor and Length Settings: Customize the Factor, Supertrend Length, and Moving Average lengths to fine-tune the sensitivity and responsiveness of the Supertrend line, adapting the indicator to various market environments.
Interpreting the Signals:
Trend Identification: The Supertrend line offers a clear visualization of the current market trend. A green line indicates a bullish trend, suggesting upward price movement, while a red line indicates a bearish trend, signaling potential downward price movement.
Entry and Exit Points: The arrows plotted by the LWST provide straightforward entry and exit signals. Green arrows signal potential buy opportunities, indicating that the price may continue to rise, while red arrows signal potential sell opportunities, suggesting that the price may decline. These visual cues help traders make informed decisions based on the current market trend.
Liquidity composition / quantifytools- Overview
Liquidity composition divides each candle into sections that are used to display transaction activity at price. In simple terms, an X-ray through candle is formed, revealing the orderflow that built the candle in greater detail. Liquidity composition consists of two main components, lots and columns. Lots and columns can be used to visualize user specified volume types, currently supporting net volume and volume delta. Lots and columns can be used to visualize same or different volume types, allowing a combination of volume footprint, volume delta footprint and volume profile in one single view. Liquidity composition principally works on any chart, whether that is equities, currencies, cryptocurrencies or commodities, even charts with no volume data (in which case volatility is used to approximate transaction activity). The script also works on any timeframe, from minute charts to monthly charts. Orderflow can be observed in real-time as it develops and none of the indications are repainted.
Example: Displaying same volume types on lots and columns
Example: Displaying different volume types on lots and columns
Liquidity composition supports user specified derivative data, such as point of control(s) and net activity coloring. Derivative data can be calculated based on either net volume or volume delta, resulting in different highlights.
With net volume, volume delta and derivative data in one view, key orderflow events such as delta imbalances, high volume nodes, low volume nodes and point of controls can be used to quickly identify accumulation/distribution, imbalances, unfinished/finished auctions and trapped traders.
Accessing script 🔑
See "Author's instructions" section, found at bottom of the script page.
Key takeaways
- Liquidity composition breaks down transaction activity at price, measured in net volume or volume delta
- Developing activity can be observed real-time, none of the indications are repainted
- Transaction activity is calculated using volumes accrued in lower timeframe price movements
- Lots and columns can be used to display same or different volume types (e.g. volume delta lots and net volume columns) in single view
- Users can specify derivative data such as volume delta POCs, net volume POC and net activity coloring
- For practical guide with practical examples, see last section
Disclaimer
Orderflow data is estimated using lower timeframe price movement. While accurate and useful, it's important to note the calculations are estimations and are not based on orderbook data. Estimates are calculated by allotting volume developing on lower timeframe chart to its respective section based on closing price. Volume delta (difference between buyers/sellers) is calculated by subtracting down move volumes (sell volume) from up move volumes (buy volume). Accuracy of the orderflow estimations largely depends on quality of lower timeframe chart used for calculations, which is why this tool cannot be expected to work accurately on illiquid charts with broken data.
Liquidity composition does not provide a standalone trading strategy or financial advice. It also does not substitute knowing how to trade. Example charts and ideas shown for use cases are textbook examples under ideal conditions, not guaranteed to repeat as they are presented. Liquidity composition should be viewed as one tool providing one kind of evidence, to be used in conjunction with other means of analysis.
- Example charts
Chart #1: BTCUSDT
Chart #2: EURUSD
Chart #3: ES futures
- Calculations
By default, size of sections and lower timeframe accuracy are automatically determined for all charts and timeframes. Number of lower timeframe price moves used for calculating orderflow is kept at fixed value, by default set to 350. Accuracy value dictates how many lower timeframe candles are included in the calculation of volume at price. At 350, the script will always use 350 lower timeframe price movements in calculations (when possible). When calculated dynamic timeframe is less than 1 minute, the script switches to available seconds based timeframes. Minimum dynamic timeframe can be capped to 1 minute (as seconds based timeframes are not available for all plans) or dynamic timeframe can be overridden using an user specified timeframe.
Example: Calculating dynamic lower timeframe
Main chart: 4H / 240 minutes
Accuracy value: 100
Formula: 240 minutes / 100 = 2.4 minutes
Timeframe used for calculations = 2 minutes
Section size is automatically determined based on typical historical candle range, the bigger it is, the bigger the section size as well. Like dynamic timeframe, automatic section size can be manually overridden by user specified size expressed in ticks (minimum price unit). Users can also adjust sensitivity of automatic sizing by setting it higher (smaller sections, more detail and more noise) or lower (less sections, less detail and less noise). Section size and dynamic timeframe can be monitored via metric table.
Volume at price is calculated by allotting volume associated with a lower timeframe price movement to its respective section based on closing price (volume is stored to the section that covers closing price). When used on a chart with no volume data, volatility is used instead to determine likely magnitude of participation. Volume delta (difference between buyers/sellers) is calculated by subtracting down move volumes (sell volume) from up move volumes (buy volume). Volumes accrued in sections are monitored over a longer period of time to determine a "normal" amount of activity, which is then used to normalize accrued volumes by benchmarking them against historical values.
Volume values displayed on the left side represent how close or far volume traded at given section is to an extreme, represented by value of 10 . The more value exceeds 10, the more extreme transaction activity is historically. The lesser the value, the less extreme (and therefore more typical) transaction activity is. Users can adjust sensitivity of volume extreme threshold, either by increasing it (more transaction activity is needed to constitute an extreme) or decreasing it (less transaction activity is needed to constitute an extreme).
Example: Interpreting volume scale
0 = Very little to no transaction activity compared to historical values
5 = Transaction activity equal to average historical values
10 = Transaction activity equal to an extreme in historical values
10+ = The more transaction activity exceeds value of 10, the more extreme it is historically
Accuracy of orderflow data largely depends on quality of lower timeframe data used in calculations. Sometimes quality of underlying lower timeframe data is insufficient due to suboptimal accuracy or broken lower timeframe data, usually caused by illiquid charts with gaps and inconsistent values. Therefore, one should always ensure the usage of most liquid chart available with no gaps in lower timeframe data. To combat poor orderflow data, a simple data quality check is conducted by calculating percentage of sections with volume data out of all available sections. Idea behind the test is to capture instances where unusual amount of sections are completely empty, most likely due to data gaps in LTF chart. E.g. 90% of sections hold some volume data, 10% are completely empty = 90% data quality score.
Data quality score should be viewed as a metric alerting when detail of underlying data is insufficient to consider accurate. When data quality score is slightly below threshold, lower timeframe chart used for calculations is likely fine, but accuracy value is too low. In this case, one should increase accuracy value or manually override used timeframe with a smaller one. When data quality score is well below threshold, lower timeframe chart used for calculations is likely broken and cannot be fixed. In this case, one should look for alternative charts with more reliable data (e.g. ES1! -> SPY, BITSTAMP:BTCUSD -> BINANCE:BTCUSDT).
Example : When insufficient data quality scores can/cannot be fixed
- Derivative data
Point of control
Point of control, referring to point in price where transaction activity is highest, can be calculated based on the volume type of lots or columns (based on net volume or volume delta). Depending on the calculation basis, displayed point of controls will vary. POC calculated based on net volume is no different from traditional POC, it is simply the section with highest amount of transaction activity, marked with an X. When calculating POC based on volume delta, the script will highlight two point of controls, named leading and losing point of control . Leading POC refers to lot with highest amount of volume delta, marked with an X. If leading POC was net buy volume, losing POC is marked on section with highest net sell volume, marked with S respectfully. Same logic applies in vice versa, if leading POC is net sell volume, losing POC is marked on highest buy volume section, using the letter B.
Net activity
Similarly to point of control calculation, net activity can be calculated based on either volume types, lots or columns. When calculating net activity based on net volume, candles will be colorized according to magnitude of total volume traded. When calculating net activity based on volume delta, candles will be colorized according to side with most volume traded (buyers or sellers). Net activity color can be applied on borders or body of a candle.
- Visuals
Lots, columns, candles and POCs can be colorized using a fixed color or a volume based dynamic color, with separate color options for buy side volume, sell side volume and net volume.
Metric table can be offsetted horizontally or vertically from any four corners of the chart, allowing space for tables from other scripts.
Table sizes, label sizes and offsets for visuals are fully customizable using settings menu.
- Practical guide
OHLC data (candles) is a simple condensed visualization of an auction market process. Candles show where price was in the beginning of an auction period (timeframe), the highest/lowest point and where price was at the end of an auction. The core utility of Liquidity composition is being able to view the same auction market process in much greater detail, revealing likely intention, effort and magnitude driving the process. All basic orderflow concepts, such as ones presented by auction market theory can be applied to Liquidity composition as well.
The most obvious and easy to spot use case for orderflow tools is identifying trapped traders/absorption, seen in high transaction activity at the very highs/lows of a candle or even better, at wicks. High participation at wicks can be used to identify forced orders absorbed into limit orders, idea behind being that when high transaction activity is placed at a wick, price went one direction with a lot of participation (high effort) and came right back up (low impact) within the same time period.
Absorption can show itself in many ways:
- Extreme buy volume sections at wick highs or buy side POC at wick highs
- Multiple, clustered high buy volume sections (but not extreme) at wick highs
- Positive net volume delta into a reversal down
- Extreme sell volume sections at wick lows or sell side POC at wick lows
- Multiple, clustered high sell volume sections (but not extreme) at wick lows
- Negative net volume delta into a reversal up
- Extreme net volume sections at or net volume POC at wick highs/lows
- Extreme net volume into a reversal up/down
For accurate analysis, orderflow based events should be viewed in the context of price action. To identify absorption, it's best to look for opportunities where an opposing trend is clearly in place, e.g. absorption into highs on an uptrend, absorption into lows on a downtrend. When price is ranging without a clear trend or there's no opposing trend, extreme activity at an extreme end of a candle might be aggressive participants attempting to initiate a new trend, rather than getting absorbed in the same sense. With enough effort put into pushing price to the opposite direction at overextended price, a shift in trend direction might be near.
Price action based levels are a great way to get context around orderflow events. Simple range highs/lows as a single data point serve as a high probability regimes for reversals, making them a great point of confluence for identifying trapped traders.
Low to zero volume sections can be used to identify points in price with little to no trading, leaving a volume null/void behind. Typically sections like these represent gaps on a lower timeframe chart, which can be used as reference levels for targets and support/resistance.
Net volume can be used for same purposes as above, but for determining general intention of market participants it's a much more suitable tool than volume delta. According to auction market theory, low/no participation is considered to reject prices and high participation is considered to accept prices. With this concept in mind, unfinished auctions occur when participation is high at highs or high at lows, idea behind being that participants are showing willingness and interest to trade at higher or lower prices. Auction is considered finished when the opposite is true, i.e. when participants are not showing willingness to trade at higher/lower prices. In general, direction of unfinished auctions can be expected to continue shortly and direction of unfinished auctions can be expected to hold.
While shape of volume delta and net volume are usually similar, they're not the same thing and do not represent the same event under the hood. Volume delta at 0 does not necessarily mean participation is 0, but can also mean high participation with equal amount of buying and selling. With this distinction in mind, using volume delta and net volume in tandem has the benefit of being able to identify points in price with a lot of up and down price movement packed into a small area, i.e. consolidation. Points in price where price hangs around for an extended period of time can be used to identify levels of interest for re-tests and breakout opportunities.

Liquidity Engulfing & Displacement [MsF]Japanese below / 日本語説明は英文の後にあります。
-------------------------
*This indicator is based on upslidedown's "Liquidity Engulfing Candles ". It's a very cool indicator. thank you.
It has 2 functions: show the Liquidity Engulfing on HTF and candle color change when displacement occurs.
=== Function description ===
1. Liquidity Engulfing on HTF
This indicator gives Liquidity Engulfing signals not only for the current candle, but also for H4 and H1 on HTF.
You can use that a bullish engulfing on H1 is a BOS on m5 and on H4 is a BOS on m15. It uses the theory of stop hunt from ICT.
Also, It's possible to fire alert.
2. Displacement
Change the color display of the candlesticks when a bullish candleStick or bearish candleStick is attached. Furthermore, by enabling the "Require FVG" option, you can easily discover the FVG (Fair Value Gap). It is a very useful function for ICT trading.
When H1 candle takes liquidity from one side and moves with an explosive move to the other side of the previous candle (displacement), it creates break of market structure on M5. Entry on discount FVG or OTE with stop loss at or below the stop hunt wick.
=== Parameter description ===
- Liquidity engulfing candles(LEC) SETTING
- Show H1 LEC … Whether to show LEC for H1
- Show H4 LEC … Whether to show LEC for H4
- Show Current LEC … Whether to show LEC for current timeframe
- Apply Stop Hunt Wick Filter … Require candle wick into prior candle retracement zone
- Apply Close Filter … Require LL/HH on candle in order to print a valid engulfing signal
- DISPLACEMENT SETTING
- Require FVG … Draw only when FVG occurs
- Displacement Type … Displacement from open to close? or from high to low?
- Displacement Length … Period over which to calculate the standard deviation
- Displacement Strength … The larger the number, the stronger the displacement detected
-------------------------
2つの機能があります: 上位足のLiquidity engulfing(流動性獲得)を表示することと、大きな変位が発生したときにローソク足の色を変更することです。
=== 機能説明 ===
1. 上位足のLiquidity engulfing
このインジケーターは、現在のローソク足だけでなく、上位足の H4 および H1 に対してもLiquidity engulfingシグナルを提供します。
H1はm5、H4はm15での使用を推奨します。これはICTのストップハント理論を活用しています。また、アラートを発することも可能です。
2. 変位(DISPLACEMENT)
大きな陽線、陰線を付けた場合に、そのローソク足をカラー表示を変更します。
さらに"Require FVG"オプションを有効にすることで、FVG(Fair Value Gap)を容易に発見することができます。ICTトレードにを行うにあたり大変有用な機能となっています。
=== パラメータの説明 ===
- Liquidity engulfing candles(LEC) SETTING
- Show H1 LEC … H1のLECを表示するかどうか
- Show H4 LEC … H4のLECを表示するかどうか
- Show Current LEC … 現在の期間の LEC を表示するかどうか
- Apply Stop Hunt Wick Filter … ハラミ足、もしくは包み足になっている場合のみに検知させる
- Apply Close Filter … 1つ前のローソクよりも終値で超えていた場合のみに検知させる
- DISPLACEMENT SETTING
- Require FVG … FVG発生時のみ描画する
- Displacement Type … openからcloseまでの変位か?highからlowまでの変位か?
- Displacement Length … 標準偏差を計算する期間
- Displacement Strength … 変位の強さ(数字が大きいほど強い変位を検出)

Liquidity Sweep + FVG Entry Model//@version=5
indicator("Liquidity Sweep + FVG Entry Model", overlay = true, max_labels_count = 500, max_lines_count = 500)
// Just to confirm indicator is loaded, always plot close:
plot(close, color = color.new(color.white, 0))
// ─────────────────────────────────────────────
// PARAMETERS
// ─────────────────────────────────────────────
len = input.int(5, "Liquidity Lookback")
tpMultiplier = input.float(2.0, "TP Distance Multiplier")
// ─────────────────────────────────────────────
// LIQUIDITY SWEEP DETECTION
// ─────────────────────────────────────────────
lowestPrev = ta.lowest(low, len)
highestPrev = ta.highest(high, len)
sweepLow = low < lowestPrev and close > lowestPrev
sweepHigh = high > highestPrev and close < highestPrev
// Plot liquidity levels
plot(lowestPrev, "Liquidity Low", color = color.new(color.blue, 40), style = plot.style_line)
plot(highestPrev, "Liquidity High", color = color.new(color.red, 40), style = plot.style_line)
// ─────────────────────────────────────────────
// DISPLACEMENT DETECTION
// ─────────────────────────────────────────────
bullDisp = sweepLow and close > open and close > close
bearDisp = sweepHigh and close < open and close < close
// ─────────────────────────────────────────────
// FAIR VALUE GAP (FVG)
// ─────────────────────────────────────────────
bullFVG = low > high
bearFVG = high < low
// we’ll store the last FVG lines
var line fvgTop = na
var line fvgBottom = na
// clear old FVG lines when new one appears
if bullFVG or bearFVG
if not na(fvgTop)
line.delete(fvgTop)
if not na(fvgBottom)
line.delete(fvgBottom)
// Bullish FVG box
if bullFVG
fvgTop := line.new(bar_index , high , bar_index, high , extend = extend.right, color = color.new(color.green, 60))
fvgBottom := line.new(bar_index , low, bar_index, low, extend = extend.right, color = color.new(color.green, 60))
// Bearish FVG box
if bearFVG
fvgTop := line.new(bar_index , low , bar_index, low , extend = extend.right, color = color.new(color.red, 60))
fvgBottom := line.new(bar_index , high, bar_index, high, extend = extend.right, color = color.new(color.red, 60))
// ─────────────────────────────────────────────
// ENTRY, SL, TP CONDITIONS
// ─────────────────────────────────────────────
var line slLine = na
var line tp1Line = na
var line tp2Line = na
f_deleteLineIfExists(line_id) =>
if not na(line_id)
line.delete(line_id)
if bullDisp and bullFVG
sl = low
tp1 = close + (close - sl) * tpMultiplier
tp2 = close + (close - sl) * (tpMultiplier * 1.5)
f_deleteLineIfExists(slLine)
f_deleteLineIfExists(tp1Line)
f_deleteLineIfExists(tp2Line)
slLine := line.new(bar_index, sl, bar_index + 1, sl, extend = extend.right, color = color.red)
tp1Line := line.new(bar_index, tp1, bar_index + 1, tp1, extend = extend.right, color = color.green)
tp2Line := line.new(bar_index, tp2, bar_index + 1, tp2, extend = extend.right, color = color.green)
label.new(bar_index, close, "BUY Entry\nFVG Retest\nSL Below Sweep",
style = label.style_label_up, color = color.new(color.green, 0), textcolor = color.white)
if bearDisp and bearFVG
sl = high
tp1 = close - (sl - close) * tpMultiplier
tp2 = close - (sl - close) * (tpMultiplier * 1.5)
f_deleteLineIfExists(slLine)
f_deleteLineIfExists(tp1Line)
f_deleteLineIfExists(tp2Line)
slLine := line.new(bar_index, sl, bar_index + 1, sl, extend = extend.right, color = color.red)
tp1Line := line.new(bar_index, tp1, bar_index + 1, tp1, extend = extend.right, color = color.green)
tp2Line := line.new(bar_index, tp2, bar_index + 1, tp2, extend = extend.right, color = color.green)
label.new(bar_index, close, "SELL Entry\nFVG Retest\nSL Above Sweep",
style = label.style_label_down, color = color.new(color.red, 0), textcolor = color.white)

Liquidity Sniper V3 (ANTI-FAKEOUT)An advanced institutional trading indicator combining liquidity pool targeting, smart money concepts, and momentum-based entries with comprehensive risk management.
🎯 CORE FEATURES:
- Liquidity Sniper Module: Identifies and targets major liquidity pools (PDH/PDL, PWH/PWL, Equal Highs/Lows, HVN/LVN edges)
- Anti-Fakeout Stack: 10-layer confirmation system including VWAP reclaim, micro BOS, displacement, relative volume, and mitigation entries
- Momentum Engulf Add-On: Catches high-velocity impulsive moves with engulfing candles, volume spikes, and volatility breakouts
- GARCH Volatility Filter: Dynamic volatility analysis to avoid choppy conditions
- Multi-Timeframe Confirmation: Ensures alignment across timeframes before entries
📊 SIGNAL CLASSIFICATION:
- BEST (Green): Highest probability setups with all confirmations aligned - 6.0+ score
- BETTER (Medium Green): Strong setups with most confirmations - 4.5-6.0 score
- GOOD (Light Green): Valid setups with basic confirmations - 3.0-4.5 score
🔍 TRADE SCENARIOS:
S1: Liquidity Reversal - Sweeps + reversals at key levels with displacement
S2: Continuation - Trend following with VWAP mean reversion
S3: Mean Reversion - Extreme deviations (2σ+) with Fibonacci exhaustion
S4: Deep Sweep - 3σ sweeps at major liquidity with high confluence
⚡ MOMENTUM TRIGGERS:
- MET (Momentum Engulf): Bullish/bearish engulfing with 1.5x+ volume spike and ATR impulse
- VBT (Volatility Breakout): Range breakouts with sigma bursts and participation
🛡️ RISK MANAGEMENT:
- Dynamic TP/SL based on ATR, VWAP bands, and liquidity pools
- 3-tier targets (T1: VWAP, T2: Nearest pool, T3: 5R extension)
- Early invalidation tracking (0.5R movement monitoring)
- Minimum 2:1 RR requirement with cooldown periods
- RTH session filters and anti-spam protection
📈 TECHNICAL EDGE:
- SMT Divergence detection vs ES correlation
- CVD (Cumulative Volume Delta) divergence confirmation
- FVG (Fair Value Gap) and Order Block mitigation entries
- Equal highs/lows clustering analysis
- Volume profile HVN/LVN identification
⚙️ FULLY CUSTOMIZABLE:
All parameters adjustable including cooldowns, proximity thresholds, ATR multipliers, RR floors, and scenario weights.
Perfect for: ES/NQ futures, forex majors, and liquid stocks. Works on 1-15 min timeframes. Best results during NY session (9:35-11:00 AM & 1:30-3:30 PM ET).
Created for serious traders seeking institutional-grade edge with quantifiable risk/reward and high-probability setups

Liquidity-Weighted Business Cycle (Satoshi Global Base)🌍 BTC-Affinity Global Liquidity Business Cycle (MACD Model)
This indicator models Bitcoin’s macroeconomic business cycle using a BTC-weighted global liquidity index as its foundation. It adapts a MACD-based framework to visualize expansions and contractions in fiat liquidity across major economies with high Bitcoin affinity.
🔍 What It Does:
🧠 Constructs a Global M2 Liquidity Index from the top 10 most BTC-relevant fiat currencies
(USD, EUR, JPY, GBP, INR, CNY, KRW, BRL, CAD, AUD)
— each weighted by its Bitcoin adoption score and FX-converted into USD.
📊 Applies a MACD (Moving Average Convergence Divergence) signal to the index to detect macro liquidity trends.
🟢 Plots a histogram of business cycle momentum (red = expansion, green = contraction).
🔴 Marks potential cycle peaks, useful for macro trading alignment.
⚖️ BTC Affinity-Weighted Countries:
🇺🇸 United States
🇪🇺 Eurozone
🇯🇵 Japan
🇬🇧 United Kingdom
🇮🇳 India
🇨🇳 China
🇰🇷 South Korea
🇧🇷 Brazil
🇨🇦 Canada
🇦🇺 Australia
Weights are user-adjustable to reflect evolving capital controls, regulation, and real-world BTC adoption trends.
✅ Use Cases:
Confirm macro risk-on vs risk-off regimes for BTC and crypto.
Identify ideal entry and exit zones in macro pair trades (e.g., MSTR vs MSTY).
Monitor how global monetary expansion feeds into BTC valuations.

Liquidity ZonesWhat It Does:
Liquidity Zones identifies key areas where institutional traders target stop orders. The indicator automatically detects significant price swings and maps the upper and lower wick zones where liquidity pools form. These zones represent high-probability areas where price is likely to return to collect stop orders before continuing its next move.
How To Use:
Identify Key Zones:
-Red zones highlight Buy Side Liquidity (resistance areas)
-Green zones highlight Sell Side Liquidity (support areas)
Trading Opportunities:
-Enter trades when price respects these zones
-Watch for zone breaks and re-tests for continuation signals
-Use alerts to notify you when price enters a zone or when new zones form
Optimization Tips:
-Adjust lookback periods based on volatility (higher for calmer markets)
-Enable auto-threshold for adaptive sensitivity to market conditions (default setting)
-Most effective on timeframes 4H and above
The indicator tracks when zones are broken and automatically removes them when price returns, providing a clean, uncluttered view of the most relevant liquidity areas on your chart.

Liquidity + SP y RS + Zones [AlgoRich]This indicator is designed to identify key areas in the market, such as support and resistance levels, liquidity zones, and important price structures.
Additionally, it highlights operational areas based on specific time frames, facilitating technical analysis and decision-making in trading.
How does it work?
1. Identification of Pivot Levels
The indicator identifies local highs and lows on the chart, known as pivot levels, which are zones where the price tends to react, such as:
Support zones: Areas where the price is likely to stop falling.
Resistance zones: Areas where the price might encounter obstacles to keep rising.
These levels are calculated by analyzing a range of bars around the current price and are highlighted with lines, boxes, and labels on the chart.
2. Liquidity Zones
Liquidity zones are defined as areas where there has been an accumulation of orders, either for buying or selling. These zones are significant because they often signal future price movements.
The indicator creates visual boxes around these levels, allowing traders to quickly identify areas where the price might react.
3. Support and Resistance Lines
Horizontal lines are drawn at the identified highs and lows, representing support and resistance levels on the chart.
These lines can be extended forward until the price touches them, showing whether the level has been respected or "broken."
4. Visual Labels
The indicator can also display labels at key levels to provide additional information, such as whether the level corresponds to a high or low.
5. Operational Zones
In addition to support and resistance levels, the indicator allows users to mark specific time periods, referred to as operational sessions.
These zones highlight user-defined periods, such as:
New York session
London session
Daily session
This helps focus analysis on the most active market periods.
6. Customization
The user can customize the following:
Pivot sizes (how many bars to consider to the left and right).
Colors and styles of the lines, boxes, and labels.
Visibility of elements such as boxes, lines, and labels.
Whether to extend the levels forward until the price reaches them.
What is this indicator used for?
Identifying key areas in the market: Support, resistance levels, and liquidity zones are essential for understanding where the price is most likely to react.
Defining entry and exit points: Highlighted zones help determine when to open or close trades.
Highlighting key market moments: With operational sessions, you can focus on the most relevant periods for your strategy.
Simplifying technical analysis: By visualizing levels and zones directly on the chart, it reduces the time needed to identify critical areas.
Benefits for Traders
This indicator is ideal for traders who:
Want to analyze key market levels quickly and efficiently.
Are looking for high-probability zones to trade, based on support, resistance, and liquidity areas.
Need a visual approach to highlight operational levels and important time frames on their charts.
In summary, this indicator serves as a comprehensive tool that combines advanced technical analysis with a user-friendly visual interface, allowing traders to make more informed and precise decisions.
-----------------
TRADUCCIÓN AL ESPAÑOL:
Este indicador está diseñado para identificar zonas clave en el mercado, como niveles de soporte y resistencia, zonas de liquidez, y estructuras importantes de precios. Además, resalta las áreas operativas de acuerdo con horarios específicos, facilitando el análisis técnico y la toma de decisiones en el trading.
¿Cómo funciona?
1. Identificación de Niveles Pivot
El indicador busca máximos y mínimos locales en el gráfico, conocidos como niveles pivote, los cuales son zonas donde el precio suele reaccionar, como en:
Zonas de soporte: Donde el precio tiene probabilidades de detener su caída.
Zonas de resistencia: Donde el precio podría encontrar obstáculos para seguir subiendo.
Estos niveles son calculados analizando un rango de barras alrededor del precio actual, y se destacan con líneas, cajas y etiquetas en el gráfico.
2. Zonas de Liquidez
Las zonas de liquidez se definen como áreas donde ha habido una acumulación de órdenes, ya sea de compra o venta. Estas zonas son importantes porque suelen marcar movimientos futuros significativos en el precio.
El indicador crea cajas visuales alrededor de estos niveles, permitiendo identificar rápidamente las áreas donde el precio puede reaccionar.
3. Líneas de Soporte y Resistencia
Se trazan líneas horizontales en los máximos y mínimos identificados, representando los niveles de soporte y resistencia en el gráfico.
Estas líneas se pueden extender hacia adelante hasta que el precio las toque, mostrando si el nivel ha sido respetado o "roto".
4. Etiquetas Visuales
El indicador también puede mostrar etiquetas en los niveles clave para proporcionar información adicional, como si el nivel corresponde a un máximo o un mínimo.
5. Zonas Operativas
Además de los niveles de soporte y resistencia, el indicador permite marcar zonas de tiempo específicas, llamadas sesiones operativas.
Estas zonas resaltan períodos definidos por el usuario, como:
Sesión de Nueva York.
Sesión de Londres.
Diario.
Esto ayuda a enfocar el análisis en los momentos más activos del mercado.
6. Personalización
El usuario puede personalizar:
Tamaños de pivote (cuántas barras a la izquierda y derecha considerar).
Colores y estilos de las líneas, cajas y etiquetas.
La visibilidad de elementos como cajas, líneas y etiquetas.
Extender o no los niveles hacia adelante hasta que el precio los alcance.
¿Para qué sirve este indicador?
Identificar zonas importantes del mercado: Los niveles de soporte, resistencia y las zonas de liquidez son esenciales para entender dónde es más probable que el precio reaccione.
Definir puntos de entrada y salida: Las zonas destacadas ayudan a determinar cuándo abrir o cerrar operaciones.
Resaltar momentos clave del mercado: Con las sesiones operativas, puedes enfocarte en los períodos más relevantes para tu estrategia.
Simplificar el análisis técnico: Visualizando niveles y zonas directamente en el gráfico, se reduce el tiempo necesario para identificar áreas críticas.
Beneficio para los Traders
Este indicador es ideal para traders que:
Quieren analizar niveles clave del mercado de forma rápida y eficiente.
Buscan zonas de alta probabilidad para operar, basándose en soportes, resistencias y zonas de liquidez.
Necesitan un enfoque visual para destacar niveles operativos y horarios importantes en sus gráficos.
En resumen, este indicador actúa como una herramienta integral para combinar análisis técnico avanzado con una interfaz visual amigable, lo que permite a los traders tomar decisiones más informadas y precisas.
