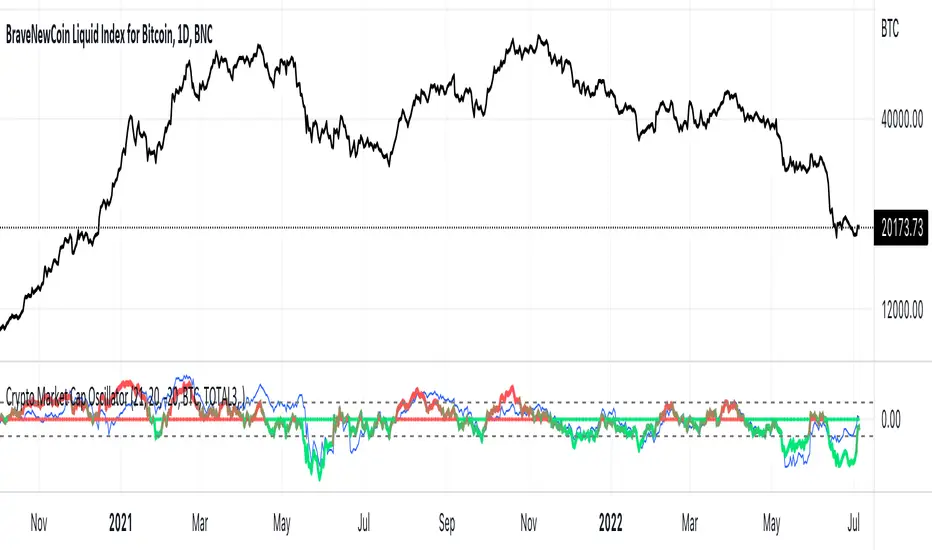
Crypto Market Cap Oscillatorthis oscillator gives helps you to select the right buy or sell moment based on the market cap of the token of your choice
It is based on a base 100 oscillator
Black plot is BTC marketcap
Gray plot is total ALT marketcap
Coloured is based on the coin of your choice
The greener the plot, the best buy opportunity
The more red the plot, the best sell opportunity
Cari dalam skrip untuk "oscillator"
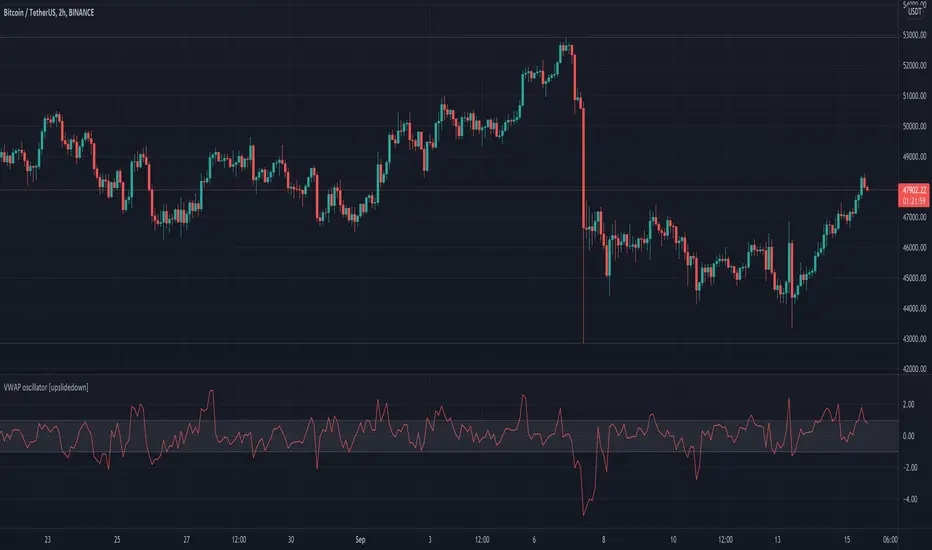
VWAP oscillator [upslidedown]This VWAP oscillator showcases the percent difference between VWAP and current price within an oscillator centered on 0. My thesis for this indicator is that trend following within the threshold zone (defaulted to 1%) would be "choppy" but outside is a significant trend. Another way to think about VWAP is potential for taking profits, as price will always be magnetized back to the center.
I find this sort of visualization very helpful when creating strategies that revolve around a filter such as VWAP and wasn't able to find anything that was close and/or provided this sort of visualization publicly. Enjoy and let me know if you find this useful or can dream up an improvement.
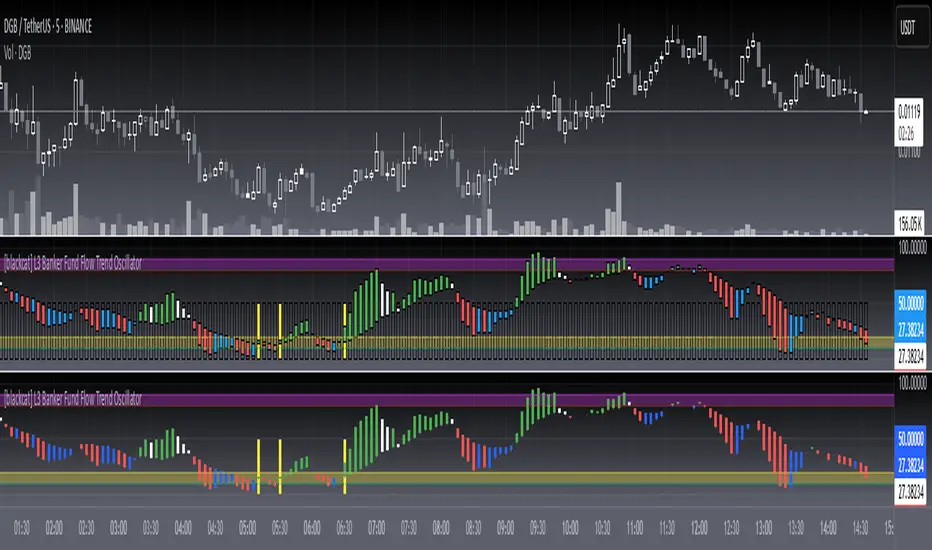
[blackcat] L3 Banker Fund Flow Trend OscillatorLevel: 3
Background
The large funds or banker fund are often referred to as Whale. Whale can have a significant impact on the price movements in various markets, especially in cryptocurrency . Therefore, how to monitor Whale trends is of great significance both in terms of fundamentals and technical aspects.
Function
L3 Banker Fund Flow Trend Oscillator can give you a model of complete banker fund flow operation in cycles. Although the script is not so complicated, it is comprehensive to disclose the price trend. That is the reason why I list this as Level 3. Each cycle of banker fund flow may have 5 steps in max as entry, increase position, decrease position, exit, and weak rebound for exit.
Key Signal
1. banker fund entry with yellow candle
2. banker increase position with green candle
3. banker decrease position with white candle
4. banker fund exit/quit with red candle
5. banker fund weak rebound with blue candle
Pros and Cons
Pros:
1. Model banker fund behavior in complete cycles
2. Overbought and oversold can be directly observed due to oscillator nature
3. the transition points are clear for entry or exit
Cons:
1. Simple modelling, no further complex behaviors can be disclosed
2. trade by trend following the banker fund, it is still under the trend analysis prerequisite
Remarks
I believe you will like this one.
Readme
In real life, I am a prolific inventor. I have successfully applied for more than 60 international and regional patents in the past 12 years. But in the past two years or so, I have tried to transfer my creativity to the development of trading strategies. Tradingview is the ideal platform for me. I am selecting and contributing some of the hundreds of scripts to publish in Tradingview community. Welcome everyone to interact with me to discuss these interesting pine scripts.
The scripts posted are categorized into 5 levels according to my efforts or manhours put into these works.
Level 1 : interesting script snippets or distinctive improvement from classic indicators or strategy. Level 1 scripts can usually appear in more complex indicators as a function module or element.
Level 2 : composite indicator/strategy. By selecting or combining several independent or dependent functions or sub indicators in proper way, the composite script exhibits a resonance phenomenon which can filter out noise or fake trading signal to enhance trading confidence level.
Level 3 : comprehensive indicator/strategy. They are simple trading systems based on my strategies. They are commonly containing several or all of entry signal, close signal, stop loss, take profit, re-entry, risk management, and position sizing techniques. Even some interesting fundamental and mass psychological aspects are incorporated.
Level 4 : script snippets or functions that do not disclose source code. Interesting element that can reveal market laws and work as raw material for indicators and strategies. If you find Level 1~2 scripts are helpful, Level 4 is a private version that took me far more efforts to develop.
Level 5 : indicator/strategy that do not disclose source code. private version of Level 3 script with my accumulated script processing skills or a large number of custom functions. I had a private function library built in past two years. Level 5 scripts use many of them to achieve private trading strategy.
[blackcat] L1 Close Histogram OscillatorLevel: 1
Background
A histogram is a special chart that is applied to statistical data that is divided into numerically ordered groups. For example groups with close relationships in the vicinity like "Close-ref(Close ,1)", "Close-ref(Close,2)" and so on. A histogram provides a snapshot of all the data so that you can quickly get an overview of the historical data, especially its general shape.In a histogram, the bars are linked - in contrast to a bar chart for categorical data, in which the bars represent categories that are in no particular order and are separated. The height of each bar in a histogram indicates either the number of individuals (called the frequency) in each group or the percentage of individuals (the relative frequency) in each group. Each individual in the data set falls into exactly one bar.
Function
L2 Close Histogram Oscillator is a novel overbought and oversold indicator that estimate the trend state by counting a specific bar relationship nearby. Once nearby bars reach consensus, it may spread to global quickly. The reason why I got this inspiration is because I have been engaged in the research of blockchain consensus mechanism. The market is a complex system, and its consensus depends on the common human characteristics: greed and fear. The trend of the market often also conforms to sociological characteristics. Maybe it's a bit complicated for me to say that. However, if you understand the principle of the spread of rumors and viruses, you can understand the situation where some individuals in the market have local consensus and gradually spread to the overall situation. This is the process of trend formation.
Key Signal
fastcounter --> fast close histogram counters
slowcounter --> slow close histogram counters
attention --> bottom price appears, with height of 10 in white
readybuy --> a small position buy opportunity after first bottom detected, with height of 20 in yellow
buylow --> a small position buy at low price, with height of 30 in lime
longentry --> a confirmed long entry signal by close histogram counter, with height of 40 in green
risk --> oscillator top is reached and trend reversal may happen, with height drop from 100 to 80 in red
Pros and Cons
Pros:
1. since this is based on consensus formation principle, i think this is a leading indicator by spreading local consensus to global
2. it is an oscillator, overbought and oversold can be easily observed.
Cons:
1. the model is not complex enough to depict market behavior exactly.
2. sideways and chop market will make this indicator's output hard to read.
Remarks
This is rare! I combined my previous theory of developing cellular automata with the market to produce such a weird indicator. I hope to inspire everyone and study market behavior in a deeper level.
Readme
In real life, I am a prolific inventor. I have successfully applied for more than 60 international and regional patents in the past 12 years. But in the past two years or so, I have tried to transfer my creativity to the development of trading strategies. Tradingview is the ideal platform for me. I am selecting and contributing some of the hundreds of scripts to publish in Tradingview community. Welcome everyone to interact with me to discuss these interesting pine scripts.
The scripts posted are categorized into 5 levels according to my efforts or manhours put into these works.
Level 1 : interesting script snippets or distinctive improvement from classic indicators or strategy. Level 1 scripts can usually appear in more complex indicators as a function module or element.
Level 2 : composite indicator/strategy. By selecting or combining several independent or dependent functions or sub indicators in proper way, the composite script exhibits a resonance phenomenon which can filter out noise or fake trading signal to enhance trading confidence level.
Level 3 : comprehensive indicator/strategy. They are simple trading systems based on my strategies. They are commonly containing several or all of entry signal, close signal, stop loss, take profit, re-entry, risk management, and position sizing techniques. Even some interesting fundamental and mass psychological aspects are incorporated.
Level 4 : script snippets or functions that do not disclose source code. Interesting element that can reveal market laws and work as raw material for indicators and strategies. If you find Level 1~2 scripts are helpful, Level 4 is a private version that took me far more efforts to develop.
Level 5 : indicator/strategy that do not disclose source code. private version of Level 3 script with my accumulated script processing skills or a large number of custom functions. I had a private function library built in past two years. Level 5 scripts use many of them to achieve private trading strategy.

Heikin-Ashi OscillatorHeikin-Ashi Oscillator
--------------------------
By reducing noice it makes trends, price patterns, and reversal points easier to spot.
Here it is implemented as a single function so that it easily can be integrated with other code.
Suggestion: Enter (at your own risk) or Exit a trade based on when the Heikin-Ashi Oscillator switch direction.

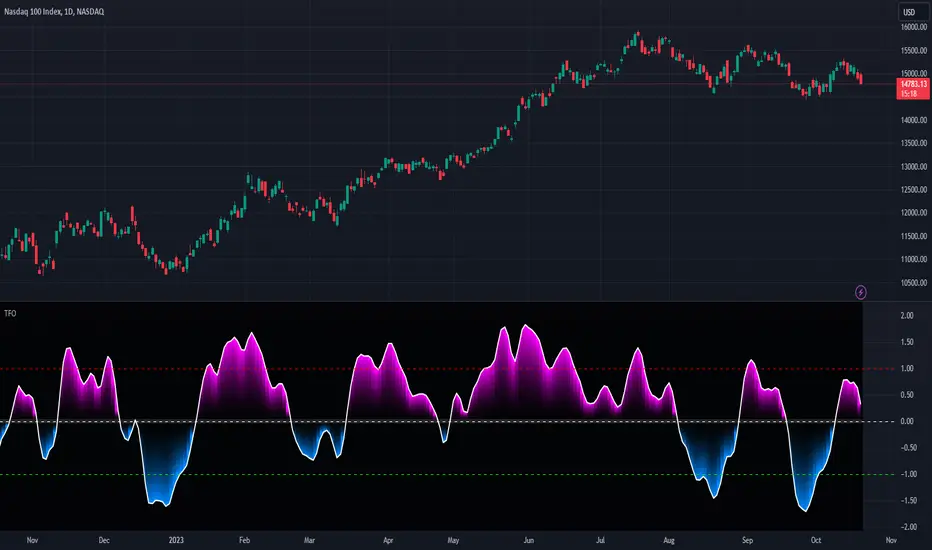
TrendFlex Oscillator - Dr. John EhlersHot off the press, I present this NEW "TrendFlex Oscillator" employing PSv4.0, originally formulated by Dr. John Ehlers for TASC - February 2020 Traders Tips. John Ehlers might describe it's novel characteristics as being a reversal sensitive near zero-lag averaging indicator retaining the TREND component. Also, I would add that irregardless of the sampling interval, this indicator has a bound range between +/-2.0 on "1 second" candles all the way up to "1 month" candle durations. This indicator also has a companion indicator entitled "Reflex Oscillator". I have published it in tandem with this one in my scripts profile.
One notable difference between this and the original formulation is that I have added an independent control for the Super Smoother. This "tweak" is enabled by applying the override and adjusting it's period. There is a "Post Smooth" input() that "tweaks" the internal TrendFlex EMA too. Keep in mind that my intention of adding tweaks is solely for experimentation with the original formulation.
I also added adjustable levels for those of you that may wish to employ alertcondition()s to this indicator somehow. Providing a more utilitarian approach, I created this with an easy to use reusable function named trendflex(). As always, I have included advanced Pine programming techniques that conform to proper "Pine Ettiquette". Being this is one of John Ehlers' first two simultaneously released indicators for 2020, I felt a few more bells and whistles were appropriate as a proper contribution to the Tradingview community.
Features List Includes:
Dark Background - Easily disabled in indicator Settings->Style for "Light" charts or with Pine commenting
AND much, much more... You have the source!
The comments section below is solely just for commenting and other remarks, ideas, compliments, etc... regarding only this indicator, not others. When available time provides itself, I will consider your inquiries, thoughts, and concepts presented below in the comments section, should you have any questions or comments regarding this indicator. When my indicators achieve more prevalent use by TV members, I may implement more ideas when they present themselves as worthy additions. As always, "Like" it if you simply just like it with a proper thumbs up, and also return to my scripts list occasionally for additional postings. Have a profitable future everyone!
CMF Osc - Chaikin Money Flow Oscillator [UTS]The well known Chaikin Money Flow Indicator as oscillator version.
General Usage
The indicator runs both above and below zero, made to denote whether an asset is in a bullish (above zero) or bearish (below zero) trend.
It can be used to confirm trends, as well as spot possible trading signals due to divergences.
A benefit of the oscillator version is that it can produce LONG or SHORT signals on zero line cross.
Moving Averages
4 different Moving Averages are available:
EMA (Exponential Moving Average)
SMA (Simple Moving Average)
VWMA (Volume Weighted Moving Average)
WMA (Weighted Moving Average)

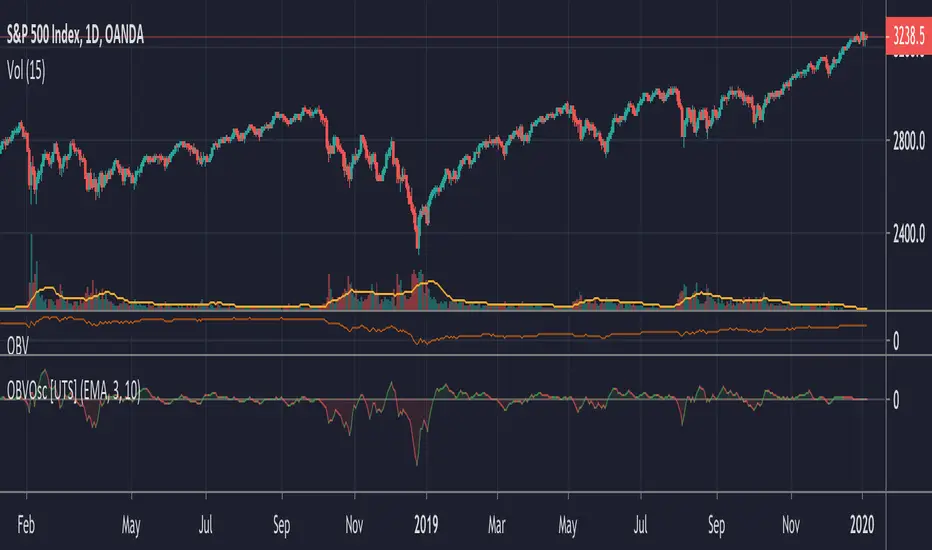
OBV Osc - On Balance Volume Oscillator [UTS]The oscillator version of the well known On Balance Volume Indicator (OBV).
General Usage
Plain old OBV can be used to confirm trends, as well as spot possible trading signals due to divergences.
A benefit of the oscillator version is that it can produce LONG or SHORT signals on zero line cross.
Moving Averages
4 different Moving Averages are available:
EMA (Exponential Moving Average)
SMA (Simple Moving Average)
VWMA (Volume Weighted Moving Average)
WMA (Weighted Moving Average)
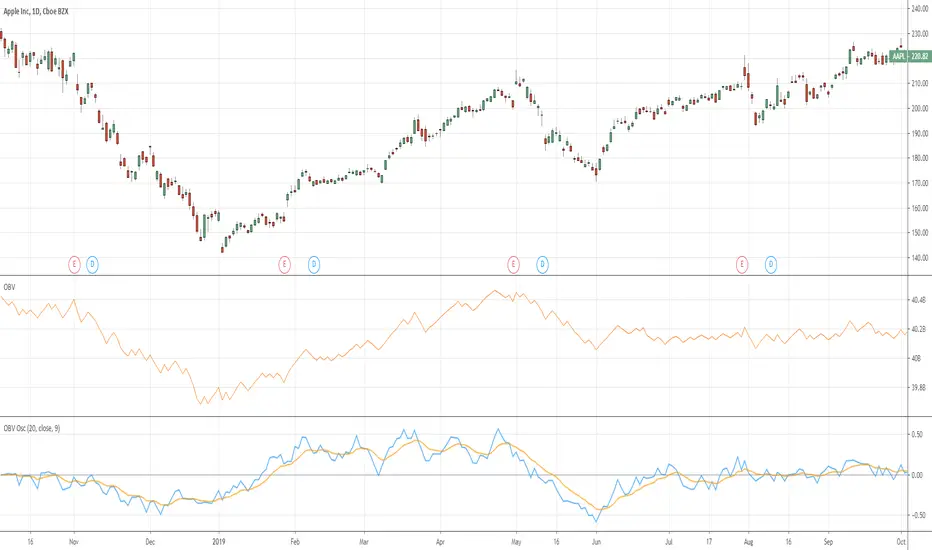
On Balance Volume Oscillator Strategy [QuantNomad]Looking for the way to use OBV Oscillator in a strategy.
Here is my first try. I just enter to position of a cross of 2 emas based on OBV.
Here is my original oscillator indicator:

QuantNomad - On Balance Volume OscillatorCreated an oscillator from OBV - On Balance Volume. This way I think it is more responsive.
I just took OBV over a period and divided it by the total volume for the same period. So now it's an oscillator from -1 to 1.
You can also add EMA to this script.
Any feedback will be appreciated.
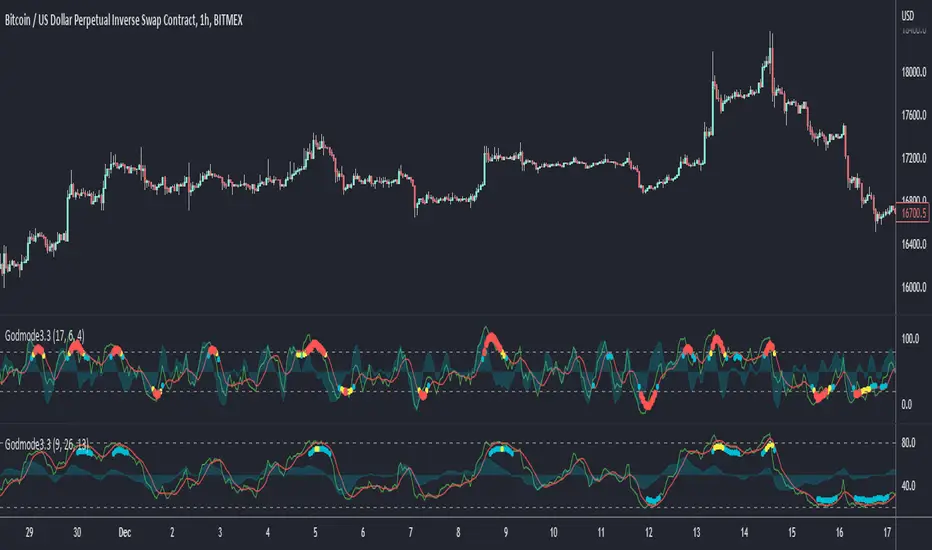
Godmode Oscillator 3.2This is nothing other than an update and slight modification to the original Godmode Oscillator published by xSilas
The update done by sco77m4r7in and myself.
Change Log:
Repaired the multi exchange option for BTC
Added additional 'Caution!' dots with color coding.
white = Early Caution signal
yellow = standard 'Caution!' signal
red = Extreme Caution signal
Be sure to give everyone a big thanks!
Original Godmode Script and Tutorial by xSilas :
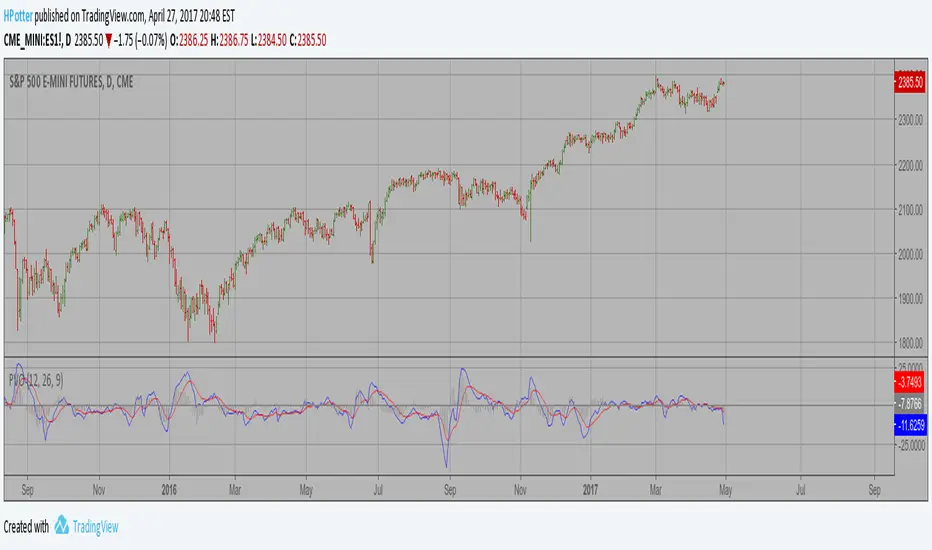
Percentage Volume Oscillator (PVO) Copyright by HPotter v1.0 28/04/2017
The Percentage Volume Oscillator (PVO) is a momentum oscillator for volume.
PVO measures the difference between two volume-based moving averages as a
percentage of the larger moving average. As with MACD and the Percentage Price
Oscillator (PPO), it is shown with a signal line, a histogram and a centerline.
PVO is positive when the shorter volume EMA is above the longer volume EMA and
negative when the shorter volume EMA is below. This indicator can be used to define
the ups and downs for volume, which can then be use to confirm or refute other signals.
Typically, a breakout or support break is validated when PVO is rising or positive.
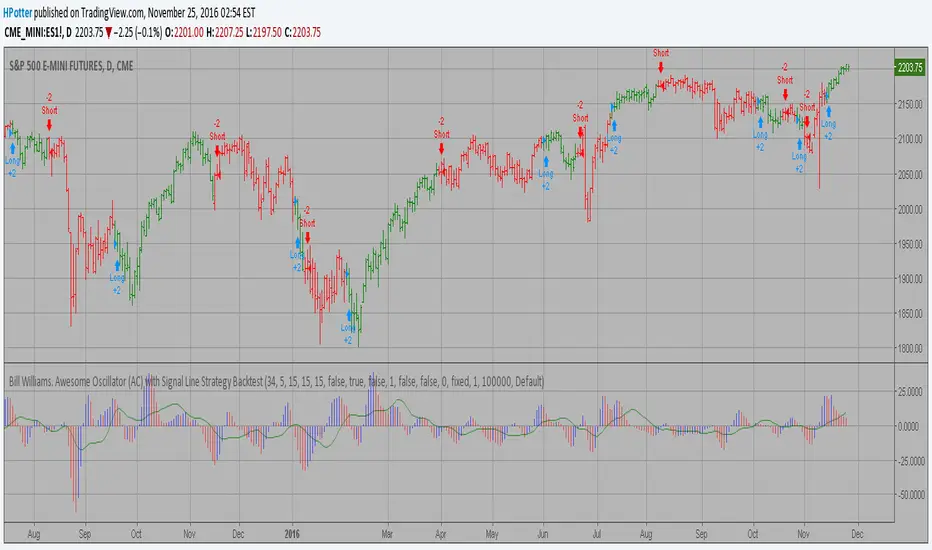
Bill Williams. Awesome Oscillator (AC) Strategy Backtest This indicator plots the oscillator as a histogram where blue denotes
periods suited for buying and red . for selling. If the current value
of AO (Awesome Oscillator) is above previous, the period is considered
suited for buying and the period is marked blue. If the AO value is not
above previous, the period is considered suited for selling and the
indicator marks it as red.
You can make changes in the property for set calculating strategy MA, EMA, WMA
Please, use it only for learning or paper trading. Do not for real trading.
altcoin index oscillatorPurpose
This will give indication as to whether a specific altcoin is overbought or oversold, as determined by it's difference from the "altcoin index".
if the current security is above the index, the oscillator will show above zero.
if the current security is below the index, the oscillator will show below zero.
Use
Add it as an indicator while looking at the chart you would like to assess. Click the settings button (cog) to select which coins you would like included in the index.
You can couple this tool with the "alctoin index overlay" indicator to view the correlation.
Notes
The "altcoin index" is the average BTC price of a selection of altcoins. Therefore this is their relation to bitcoin and not any national currency. Due to this, the indicator will be useless if you try to use it with BTCUSD etc.

Ehlers Center of Gravity Oscillator [LazyBear]As part of my "Ehler's Indicators week", here's one more.
CG Oscillator, by John Ehlers, provides a smoothed, essentially zero lag oscillator for identifying market turning points. The "CG" in the name of the oscillator refers to "Center Of Gravity" of the prices over the window of observation.
Entry/Exit are based on the osc/signal crossovers. Enabling the "Color bars" options helps in easily identifying crossovers.
More info:
- CG osc (pdf): www.mesasoftware.com
- TASC Article: traders.com
- Cybernetic Analysis for Stocks and Futures (Ehlers, 2004)
List of my public indicators: bit.ly
List of my app-store indicators: blog.tradingview.com

UCS_Murrey's Math OscillatorThis is a new indicator release, Using the principle of Murrey Math Line Trading Systems. It will be easier for someone to add alerts on an oscillator rather than a overlay.
Currently, I did add some aesthetics for those who like to view different colors, can be turned off.
Oscillator Color Definition -
Green = Above MidLine
Red = Below Midline
Blue = Below Negative 3rd Quadrant
Orange = Above Positive 3rd Quadrant
/////////
Planned future Improvement is to consider Wicks as well.
Do post your opinions and any improvement.
GL.

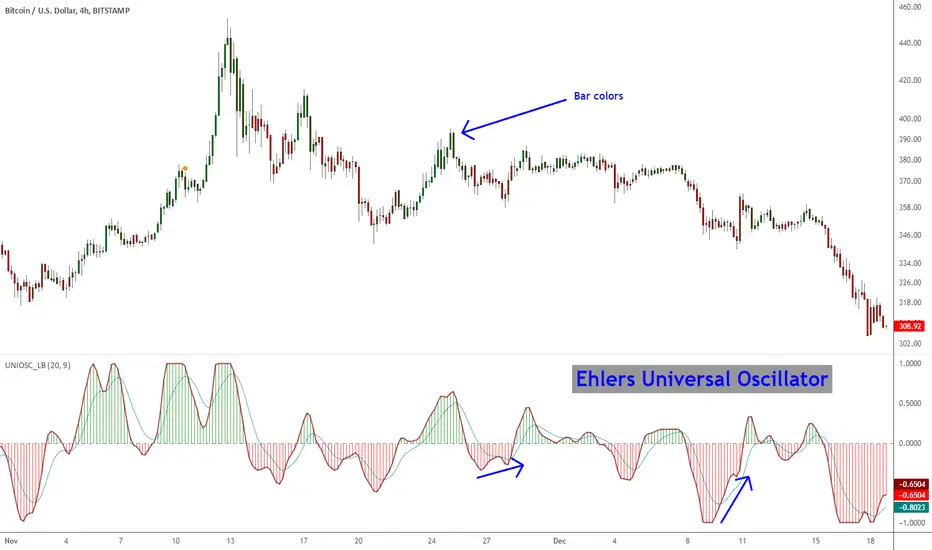
Ehlers Universal Oscillator [LazyBear]Universal Oscillator by Mr. Ehlers is an evolution of his SuperSmoother filter. The new indicator follows the swings in price without introducing extra delay.
It is controlled through one single input – the band edge – which basically is frequency. The smaller it is set, the less lag there is, but you may see lot of whipsaws. Built-in automatic gain control normalizes the output to vary between the range of -1 to +1.
Mr. Ehlers suggests a straightforward system:
- Buy when long-term Universal Oscillator crosses above zero
- Sell when long-term Universal Oscillator crosses below zero
I have added options to draw a signal line, histogram and bar coloring. Bar coloring, if enabled, is done using the histogram color, but you can change it easily to signal_cross by uncommenting a line (check the source).
More info:
Whiter is Brighter - Ehlers
List of my other indicators:
- GDoc: docs.google.com
- Chart:
Vervoort Heiken-Ashi LongTerm Candlestick Oscillator [LazyBear]HACOLT (Heikin Ashi Candles Oscillator Long Term) is a technical indicator designed by Sylvain Vervoort. It is based on Mr.Vervoort's other indicator, HACO (Heikin-Ashi Candles Oscillator - posted here: ).
Optimized for long-term trading, HACOLT shows three levels: -1, 0 and 1. These levels suggest "an open short position", "no open position", and "an open long position", respectively. Passing from a certain level to another is viewed as a trading signal:
- Rising from -1 or 0 to 1 suggests a Long Entry and Short exit;
- Falling from 1 to 0 or -1 suggests a Long Exit;
- Falling from 1 or 0 to -1 indicates a Short Entry.
Fits in nicely with any trading setup as a confirmation indicator
More info:
- tlc.thinkorswim.com
- www.motivewave.com
List of my other indicators:
- GDoc: docs.google.com
- Chart:

Vervoort Heiken Ashi Candlestick OscillatorHeiken-Ashi Candlestick Oscillator (HACO), by Sylvian Vervoort, is a digital oscillator version of the colored candlesticks.
Explanation from Vervoort:
"HACO is not meant to be an automatic trading system, so when there is a buy or sell signal from HACO, make sure it is confirmed by other TA techniques. HACO will certainly aid in signaling buy/sell opportunities and help you hold on to a trade, making it more profitable. The behavior of HACO is closely related to the level and speed of price change. It can be used on charts of any time frame ranging from intraday to monthly."
HACO has 2 configurable length parameters - "UP TEMA length" and "Down TEMA length". Vervoort suggests having them the same value.
I have also added an option to color the bars (overlay mode).
More info:
Trading with the Heiken-Ashi Candlestick Oscillator - Sylvian Vervoort
List of my other indicators:
- GDoc: docs.google.com
- Chart:

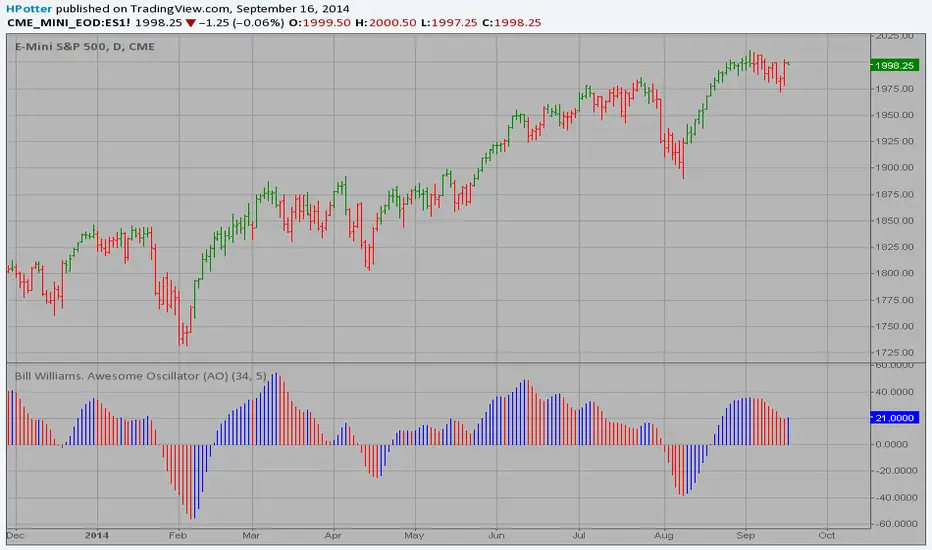
Bill Williams. Awesome Oscillator (AC) Signal Line This indicator plots the oscillator as a histogram where blue denotes
periods suited for buying and red . for selling. If the current value
of AO (Awesome Oscillator) is above previous, the period is considered
suited for buying and the period is marked blue. If the AO value is not
above previous, the period is considered suited for selling and the
indicator marks it as red.
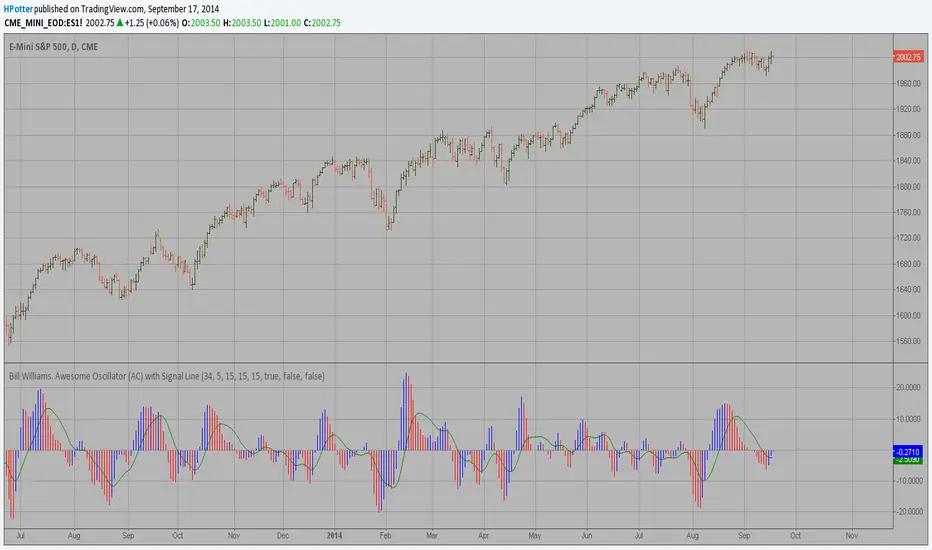
Strategy Bill Williams. Awesome Oscillator (AO) This indicator is based on Bill Williams` recommendations from his book
"New Trading Dimensions". We recommend this book to you as most useful reading.
The wisdom, technical expertise, and skillful teaching style of Williams make
it a truly revolutionary-level source. A must-have new book for stock and
commodity traders.
The 1st 2 chapters are somewhat of ramble where the author describes the
"metaphysics" of trading. Still some good ideas are offered. The book references
chaos theory, and leaves it up to the reader to believe whether "supercomputers"
were used in formulating the various trading methods (the author wants to come across
as an applied mathemetician, but he sure looks like a stock trader). There isn't any
obvious connection with Chaos Theory - despite of the weak link between the title and
content, the trading methodologies do work. Most readers think the author's systems to
be a perfect filter and trigger for a short term trading system. He states a goal of
10%/month, but when these filters & axioms are correctly combined with a good momentum
system, much more is a probable result.
There's better written & more informative books out there for less money, but this author
does have the "Holy Grail" of stock trading. A set of filters, axioms, and methods which are
the "missing link" for any trading system which is based upon conventional indicators.
This indicator plots the oscillator as a histogram where periods fit for buying are marked
as blue, and periods fit for selling as red. If the current value of AC (Awesome Oscillator)
is over the previous, the period is deemed fit for buying and the indicator is marked blue.
If the AC values is not over the previous, the period is deemed fir for selling and the indicator
is marked red.
Bill Williams. Awesome Oscillator (AC) Strategy This indicator plots the oscillator as a histogram where blue denotes
periods suited for buying and red . for selling. If the current value
of AO (Awesome Oscillator) is above previous, the period is considered
suited for buying and the period is marked blue. If the AO value is not
above previous, the period is considered suited for selling and the
indicator marks it as red.

NYSE MCCLELLAN OSCILLATORThe McClellan Oscillator is a breadth indicator derived from Net Advances, the number of advancing issues less the number of declining issues. The McClellan Oscillator is similar to a MACD for the Advance/Decline Line for the NYSE. Signals can be generated with breadth thrusts, centerline crossovers, overall levels and divergences.
