Bijnor Pivot ExtendedOverview: The Bijnor Pivot Extended (BP+) indicator is a powerful visual tool designed to help traders identify key price levels using Fibonacci-based pivots. It dynamically plots Support and Resistance levels based on your chosen timeframe (Daily, Weekly, or Monthly) and displays them only for the current session, reducing chart clutter and improving focus.
🔧 Features:
📆 Pivot Timeframe Selection: Choose between Daily, Weekly, or Monthly pivots.
🎯 Fibonacci Pivot Levels:
Central Pivot (P)
Resistance: R1, R2, R3, R4 (Extended)
Support: S1, S2, S3, S4 (Extended)
🎨 Full Customization:
Toggle labels and prices on/off
Position labels to the left or right
Change line width and individual colors for pivot, support, and resistance lines
🧠 Smart Line Plotting:
Lines are drawn only during the selected session, keeping your chart clean
🕹️ Max Performance: Optimized to stay lightweight with max_lines_count and max_labels_count set to 500
🧭 How to Use It:
Use this indicator to:
Plan entries and exits around key Fibonacci pivot zones
Identify overbought/oversold zones at R3/R4 and S3/S4
Enhance your intraday, swing, or positional trading setups
Combine with price action, candlestick patterns, or volume for maximum edge.
✅ Bonus:
This script is ideal for traders looking for a minimalist yet powerful pivot framework, with extended levels for breakout or reversal scenarios.
Cari dalam skrip untuk "pivot"
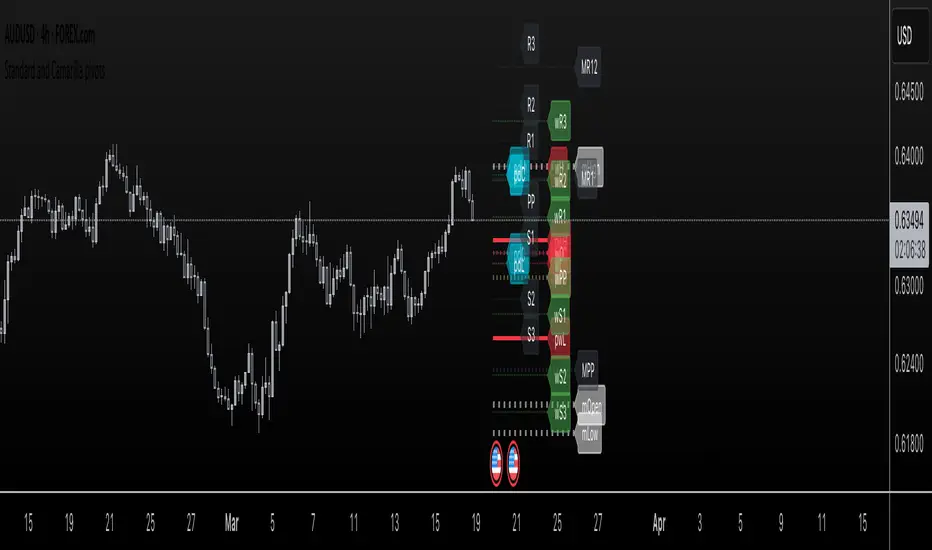
Standard and Camarilla pivotsHi guys, I would like too introduce to all of you my script. As the name already tell you what this script is all about. It's about pivot points.
You may ask, Tradingview already have a script for pivot points, why would I need another script?
here is the answer: This script allow you to add more than one type of pivot, sounds good right?
But there's more: You can see not just one timeframe pivots, you can see many timeframe pivots, nice huh?
let dive into it to know a bit more.
In this script you can see daily pivots include Standard pivots as R1, R2, R3 and Camarilla pivots as cR1, cR2, cR3, and I you different color for different pivots, so you don't confuse between those two.
You can see weekly pivots the same as daily pivots only has letter "w" in front of it, for examples: "wR1, wR2, wcR1, wcR2" ,nice right?
What's about month level: yes, you can see monthly pivots too, and it start with "m".
Along with pivots points above, you also can see daily open, previous day close, previous high,.., for instances: daily open as "O", previous day open as "PDO",
You are able to see previous week level, previous month levels.
have fun.
I dont wanna lock this script because open-source script help me learn how to code pine script, so that's why I keep it open. Thank to all the coders out there that shared everything they have for us to learn.
Central Pivot Point Cross & Retrace Strategy // AlgoFyreThe Central Pivot Point Cross & Retrace Strategy uses pivot points for trend identification and trade entry. It combines accumulation/distribution indicators with pivot point levels to generate signals. The strategy incorporates dynamic position sizing based on a fixed risk amount and allows for both long and short positions with customizable stop-loss levels.
TABLE OF CONTENTS
🔶 ORIGINALITY
🔸Pivot Point-Based Trading
🔸Accumulation/Distribution
🔸Dynamic Position Sizing
🔸Customizable Risk Management
🔶 FUNCTIONALITY
🔸Indicators
🞘 Pivot Points
🞘 Accumulation/Distribution
🔸Conditions
🞘 Long Entry
🞘 Short Entry
🞘 Take Profit
🞘 Stop Loss
🔶 INSTRUCTIONS
🔸Adding the Strategy to the Chart
🔸Configuring the Strategy
🔸Backtesting and Practice
🔸Market Awareness
🔸Visual Customization
🔶 CONCLUSION
▅▅▅▅▅▅▅▅▅▅▅▅▅▅▅▅▅▅▅▅▅▅▅▅▅▅▅▅▅▅▅▅▅▅▅▅▅▅▅▅▅▅▅▅▅
🔶 ORIGINALITY The Central Pivot Point Cross & Retrace Strategy uniquely combines pivot point analysis with accumulation/distribution indicators to identify optimal entry and exit points. It employs dynamic position sizing based on a fixed risk amount, ensuring consistent risk management across trades. This approach allows traders to adapt to varying market conditions by adjusting position sizes according to predefined risk parameters, enhancing both flexibility and control in trading decisions. The strategy's integration of customizable stop-loss levels further refines its risk management capabilities.
🔸Pivot Point-Based Trading This strategy utilizes daily pivot points to identify key support and resistance levels, providing a framework for trend identification and trade entry. The central pivot point serves as the intraday point of balance between buyers and sellers, with the largest amount of trading volume assumed to take place in this area.
🔸Accumulation/Distribution The strategy incorporates the Accumulation/Distribution (A/D) line, an underrated volume-based indicator, to establish the main trend. The A/D line is used in conjunction with a trend based indicator like the 200-period Exponential Moving Average (EMA) to confirm trend direction and strength.
🔸Dynamic Position Sizing Position sizes are calculated dynamically based on a fixed risk amount, allowing traders to maintain consistent risk exposure across trades.
🔸Customizable Risk Management Traders can set flexible risk-reward ratios and adjust stop-loss and take-profit levels, tailoring the strategy to their risk tolerance and market conditions. The strategy recommends taking partial profits at S1 or R1 levels and moving the stop-loss to break-even for remaining positions.
🔶 FUNCTIONALITY The Central Pivot Point Cross & Retrace Strategy leverages pivot points and accumulation/distribution indicators to identify optimal trading opportunities. This strategy is designed to capitalize on price movements around key pivot levels by dynamically adjusting position sizes based on predefined risk parameters. It allows traders to manage risk effectively while taking advantage of both long and short positions.
🔸Indicators 🞘 Pivot Points: Calculates daily pivot points (PP, R1, R2, S1, S2) to identify key support and resistance levels. The central pivot point is crucial for determining market bias and entry points.
🞘 Accumulation/Distribution: Uses the A/D line and with a trend based indicator like the 200 EMA to determine market direction and trend strength. This combination helps eliminate noise and provides more reliable trend signals. We recommend using the Adaptive MAs (Hurst, CVaR, Fractal) // AlgoFyre , but any moving average could be used.
🔸Conditions 🞘 Long Entry: Initiates a long position when the price crosses above the central pivot point (PP), retraces back to it and the A/D line is above its 200 EMA, indicating an uptrend. A limit entry order is set at the PP for entering the long trade.
🞘 Short Entry: Initiates a short position when the price crosses below the central pivot point (PP), retraces back to it and the A/D line is below its 200 EMA, indicating a downtrend. A limit entry order is set at the PP for entering the short trade.
🞘 Take Profit: 50% of the position is closed as profit when R1 for Longs and S1 for Shorts is reached. The position is fully closed when R2 for Longs and S2 for Shorts is reached.
🞘 Stop Loss: Stop loss is set via strategy settings. When the first 50% take profit for both long and shorts is taken, stop loss for both will be moved to break-even/entry.
🔶 INSTRUCTIONS
The Central Pivot Point Cross & Retrace Strategy can be set up by adding it to your TradingView chart and configuring parameters such as the accumulation/distribution source, stop-loss percentage, and risk management settings. This strategy is designed to capitalize on price movements around key pivot levels by dynamically adjusting position sizes based on predefined risk parameters. Enhance the accuracy of signals by combining this strategy with additional indicators like trend-following or momentum-based tools. Adjust settings to better manage risk and optimize entry and exit points.
🔸Adding the Strategy to the Chart Go to your TradingView chart.
Click on the "Pine Editor" button at the bottom of the chart.
Copy and paste the strategy code into the Pine Editor.
Click "Add to Chart" to apply the strategy.
Add the technical indicator "Accumulation/Distribution" to the chart.
Add the trend indicator " Adaptive MAs (Hurst, CVaR, Fractal) // AlgoFyre " or any other MA to the chart and move it to the "Accumulation/Distribution" pane.
Set the source of your trend indicator to "Accumulation/Distribution".
🔸Configuring the Strategy Open the strategy settings by clicking on the gear icon next to its name on the chart.
Accumulation/Distribution Source: Select the source for the accumulation/distribution indicator.
Accumulation/Distribution EMA Source: Select the source for the trend indicator.
Stop Loss Percentage: Set the stop loss distance from the pivot point as a percentage.
Risk Amount: Define the fixed risk amount for position sizing.
Base Order Size: Set the base order size for position calculations.
Number of Positions: Specify the maximum number of positions allowed.
Time Frame: Adjust the time frame based on the currency pair or asset being traded (e.g., 15-minute for EUR/USD, 30-minute for GBP/USD).
🔸Backtesting and Practice Backtest the strategy on historical data to understand how it performs in various market environments.
Practice using the strategy on a demo account before implementing it in live trading.
Test different time frames and asset pairs to find the most suitable combinations.
🔸Market Awareness Keep an eye on market news and events that might cause extreme price movements. The strategy reacts to price data and might not account for news-driven events that can cause large deviations.
Remember that this strategy is not recommended for stocks due to the A/D line's inability to account for gaps in its calculation.
🔸Visual Customization Visualization Settings: Customize the display of entry price, take profit, and stop loss levels.
Color Settings: Switch to the AlgoFyre theme or set custom colors for bullish, bearish, and neutral states.
Table Settings: Enable or disable the information table and adjust its position.
🔶 CONCLUSION
The Central Pivot Point Cross & Retrace Strategy provides a robust framework for capitalizing on price movements around key pivot levels by combining pivot point analysis with accumulation/distribution indicators. This strategy leverages pivot point crossovers to identify entry points and utilizes the A/D line crossover with its 200 EMA for trend confirmation, ensuring trades align with prevailing market conditions. By incorporating dynamic position sizing based on a fixed risk amount, traders can effectively manage risk and adapt to varying market conditions. The strategy's focus on trading around the central pivot point and its customizable stop-loss and take-profit levels further enhance its risk management capabilities, making it a versatile tool for both trending and ranging markets. With its strategic blend of technical indicators and risk management, the Central Pivot Point Cross & Retrace Strategy offers traders a comprehensive approach to optimizing trade execution and maximizing potential returns across various currency pairs and commodities.

Pivot Points Level [TradingFinder] 4 Methods + Reversal lines🔵 Introduction
"Pivot Points" are places on the price chart where buyers and sellers are most active. Pivot points are calculated based on the previous day's price data and serve as reference points for traders to make decisions.
Types of Pivot Points :
Floor
Woodie
Camarilla
Fibonacci
🟣 Floor Pivot Points
Floor pivot points are widely used in technical analysis. The central pivot point (PP) serves as the main level of support or resistance, indicating the potential direction of the trend.
The first to third levels of resistance (R1, R2, R3) and support (S1, S2, S3) provide additional signals for potential trend reversals or continuations.
Floor Pivot Points Formula :
Pivot Point (PP): (H + L + C) / 3
First Resistance (R1): (2 * P) - L
Second Resistance (R2): P + H - L
Third Resistance (R3): H + 2 * (P - L)
First Support (S1): (2 * P) - H
Second Support (S2): P - H + L
Third Support (S3): L - 2 * (H - P)
🟣 Camarilla Pivot Points
Camarilla pivot points include eight levels that closely align with support and resistance. These points are particularly useful for setting stop-loss and profit targets.
Camarilla Pivot Points Formula :
Fourth Resistance (R4): (H - L) * 1.1 / 2 + C
Third Resistance (R3): (H - L) * 1.1 / 4 + C
Second Resistance (R2): (H - L) * 1.1 / 6 + C
First Resistance (R1): (H - L) * 1.1 / 12 + C
First Support (S1): C - (H - L) * 1.1 / 12
Second Support (S2): C - (H - L) * 1.1 / 6
Third Support (S3): C - (H - L) * 1.1 / 4
Fourth Support (S4): C - (H - L) * 1.1 / 2
🟣 Woodie Pivot Points
Woodie pivot points are similar to floor pivot points but place more emphasis on the closing price. This method often results in different pivot levels than the floor method.
Woodie Pivot Points Formula :
Pivot Point (PP): (H + L + 2 * C) / 4
First Resistance (R1): (2 * P) - L
Second Resistance (R2): P + H - L
First Support (S1): (2 * P) - H
Second Support (S2): P - H + L
🟣 Fibonacci Pivot Points
Fibonacci pivot points use the standard floor pivot points and then apply Fibonacci retracement levels to the range of the previous trading period. The common retracement levels used are 38.2%, 61.8%, and 100%.
Fibonacci Pivot Points Formula :
Pivot Point (PP): (H + L + C) / 3
Third Resistance (R3): PP + ((H - L) * 1.000)
Second Resistance (R2): PP + ((H - L) * 0.618)
First Resistance (R1): PP + ((H - L) * 0.382)
First Support (S1): PP - ((H - L) * 0.382)
Second Support (S2): PP - ((H - L) * 0.618)
Third Support (S3): PP - ((H - L) * 1.000)
These pivot point calculations help traders identify potential support and resistance levels, enabling more informed decision-making in their trading strategies.
🔵 How to Use
🟣 Two Methods for Trading Pivot Points
There are two primary methods for trading pivot points: trading with "pivot point breakouts" and trading with "price reversals."
🟣 Pivot Point Breakout
A breakout through pivot lines provides a significant signal to the trader, indicating a change in market sentiment. When an upward breakout occurs and the price crosses these lines, a trader can enter a long position and place their stop-loss below the pivot point (P).
Similarly, if a downward breakout happens, a short order can be placed below the pivot point.
When trading with pivot point breakouts, if the upward trend breaks, the first and second support levels can be the trader's profit targets. In a downward trend, the first and second resistance levels will serve this role.
🟣 Price Reversal
Another method for trading pivot points is waiting for the price to reverse from the support and resistance levels. To execute this strategy, one should trade in the opposite direction of the trend as the price reverses from the pivot point.
It's worth noting that although traders use this tool in higher time frames, it yields better results in shorter time frames such as one-hour, 30-minute, and 15-minute intervals.

Daily Pivots with Fakeout Protection█ OVERVIEW
The "Daily Pivots with Fakeout Protection" indicator is a powerful tool designed to help traders identify potential price breakouts and pivot levels on daily charts. This indicator calculates and displays daily pivot points along with breakout lines that are adjusted to provide a certain level of protection against fakeouts, which are false price movements that can mislead traders.
█ FEATURES
• Pivot Timeframe Selection: You can choose the timeframe for the pivot calculations. The default is set to daily (D), but you have the flexibility to select other timeframes as well.
• Fakeout Protection: A percentage-based parameter allows you to define the amount of protection you want against fakeouts. This helps filter out potentially unreliable breakouts.
• Bullish and Bearish Signals: The indicator distinguishes between bullish and bearish conditions by comparing the closing price to the daily high and low.
• Breakout Signals: Triangular symbols (upward and downward) appear below and above bars to signal potential breakout points. These are based on the closing price crossing the adjusted breakout lines.
• Visual Representation: Pivot points, daily high, and daily low are plotted on the chart, with distinctive line styles and colors for easy identification.
• Background Highlighting: The background color of the chart changes when a new period begins, helping you quickly recognize the start of a new trading day.
• Color-Coded Zones: The indicator colors the background around the closing price differently based on whether the market is bullish (green) or bearish (red).
█ HOW TO USE
1 — Apply the "Daily Pivots with Fakeout Protection" indicator to your TradingView chart.
2 — Customize the parameters like pivot timeframe and fakeout protection percentage according to your trading preferences.
3 — Watch for the triangular breakout symbols that appear above and below bars, indicating potential breakout points.
4 — Keep an eye on the pivot points, daily high, and daily low lines to understand price levels relevant to the current trading day.
5 — Use the background color changes to quickly identify the beginning of a new trading day and any potential shifts in market sentiment.
Note:
• This indicator is designed for daily charts but can be adjusted to work with other timeframes as well.
• Be cautious of relying solely on breakout signals; consider using additional technical and fundamental analysis for confirmation.
Start integrating the "Daily Pivots with Fakeout Protection" indicator into your trading strategy to enhance your ability to identify breakouts and pivot levels more effectively.

Price Pivots for NASDQ 100 StocksPrice Pivots for NASDQ 100 Stocks
What is this Indicator?
• This indicator calculates the price range a Stock can move in a Day.
Advantages of this Indicator
• This is a Leading indicator, not Dynamic or Repaint.
• Helps to identify the tight range of price movement.
• Can easily identify the Options strike price.
• Develops a discipline in placing Targets.
Disadvantages of this Indicator
• The indicator is specifically made for NASDQ 100 stocks. The levels won't work for other stocks.
• The indicator shows nothing for other indexes and stocks other than above mentioned.
• The data need to be entered manually.
Who to use?
Highly beneficial for Day Traders, it can be used for Swing and Positions as well.
What timeframe to use?
• Any timeframe.
• The highlighted levels in Red and Green will not show correct levels in 1 minute timeframe.
• 5min is recommended for Day Traders.
When to use?
• Wait for proper swing to form.
• Recommended to avoid 1st 1 hour or market open, that is 9.15am to 10.15 or 10.30am.
• Within this time a proper swing will be formed.
What are the Lines?
• The concept is the price will move from one pivot to another.
• Entry and Exit can be these levels as Reversal or Retracement.
Gray Lines:
• Every lines with price labels are the Strike Prices in the Option Chain.
• Price moves from 1 Strike Price level to another.
• The dashed lines are average levels of 2 Strike Prices.
Red & Green Lines:
• The Red and Green Lines will appear only after the first 1 hour.
• The levels are calculated based on the 1st 1 hour.
• Red Lines are important Resistance levels, these are strong Bearish reversal points. It is also a breakout level, this need to be figured out from the past levels, trend, percentage change and consolidation.
• Green Lines are important Support levels, these are strong Bullish reversal points. It is also a breakdown level, this need to be figured out from the past levels, trend, percentage change and consolidation.
What are the Labels?
• First Number: Price of that level.
• Numbers in (): Percentage change and Change of price from LTP (Last Traded Price) to that Level.
How to use?
Entry:
• Enter when price is closer to the Red or Green lines.
• Enter after considering previous Swing and Trend.
• Note the 50% of previous Swing.
• Enter Short when price reverse from each level.
• If 50% of swing and the pivot level is closer it can be a good entry.
Exit:
• Use the logic of Entry, each level can be a target.
• Exit when price is closer to the Red or Green lines.
Indicator Menu
Source
• Custom: Enter the price manually after choosing the Source as Custom to show the Pivots at that price.
• LTP: Pivot is calculated based on Last Traded Price.
• Day Open: Pivot is calculated based on current day opening price.
• PD Close: Pivot is calculated based on previous day closing price.
• PD HL2: Pivot is calculated based on previous day average of High and Low.
• PD HLC3: Pivot is calculated based on previous day average of High, Low and Close.
"Time (Vertical Lines)"
• This is a marker of every 1 hour.
• Usually major price movement happen between previous day last 1 hour to today first 1 hour.
• Two swings can happen between first 2 hour of current day.
• At the end of the day last 1 hour another important movement will happen.
• Usually rest of the time won't show any interesting movement.
To the Users
• Certain symbols may show the levels as a single line. For such symbols choose a different Source or Timeframe from the indicator menu.
• Please inform if any of the Symbol's price levels don't react to the pivots , include the Symbol a well.
• Also inform if you notice any wrong values, errors or abnormal behavior in the indicator.
• Feel free to suggest or adding new features and options.
General Tips
• It is good if Stock trend is same as that of Index trend.
• Lots of indicators creates lots of confusion.
• Keep the chart simple and clean.
• Buy Low and Sell High.
• Master averages or 50%.
• Previous Swing High and Swing Low are crucial.
Important Note
• Currently the levels are in testing stage.
• Eventually the levels of certain symbols will be corrected after each update and test.

Waddah Attar Weekly Camarilla Pivots [Loxx]Waddah Attar Weekly Camarilla Pivots is an indicator built by Ahmad Waddah Attar that draws weekly Camarilla over lower timeframes.
What are Camarilla pivots?
Camarilla Pivot Points is a math-based price action analysis tool that generates potential intraday support and resistance levels. Similar to classic pivot points, it uses the previous day's high price, low price, and closing price.
Camarilla Pivot Points is a modified version of the classic Pivot Point. Camarilla Pivot Points were introduced in 1989 by Nick Scott, a successful bond trader. The basic idea behind Camarilla Pivot Points is that price has a tendency to revert to its mean until it doesn’t. What makes it different than the classic pivot point formula is the use of Fibonacci numbers in its calculation of pivot levels. Camarilla Pivot Points is a math-based price action analysis tool that generates potential intraday support and resistance levels.
Details
-Used for intraday trading to identify support/resistance levels
-Restricted to timeframes 4 hours and below
-Unlike most versions of Weekly Camarilla Pivots, this version allows you to customize the Fibonacci levels

Volume Profile, Pivot Anchored by DGTVolume Profile (also known as Price by Volume ) is an charting study that displays trading activity over a specified time period at specific price levels. It is plotted as a horizontal histogram on the finacial isntrumnet's chart that highlights the trader's interest at specific price levels. Specified time period with Pivots Anchored Volume Profile is determined by the Pivot Levels, where the Pivot Points High Low indicator is used and presented with this Custom indicator
Finally, Volume Weighted Colored Bars indicator is presneted with the study
Different perspective of Volume Profile applications;
Anchored to Session, Week, Month etc : Anchored-Volume-Profile
Custom Range, Interactive : Volume-Profile-Custom-Range
Fixed Range with Volume Indicator : Volume-Profile-Fixed-Range
Combined with Support and Resistance Indicator : Price-Action-Support-Resistance and Volume-Profile
Combined with Supply and Demand Zones, Interactive : Supply-Demand-and-Equilibrium-Zones
Disclaimer : Trading success is all about following your trading strategy and the indicators should fit within your trading strategy, and not to be traded upon solely
The script is for informational and educational purposes only. Use of the script does not constitutes professional and/or financial advice. You alone the sole responsibility of evaluating the script output and risks associated with the use of the script. In exchange for using the script, you agree not to hold dgtrd TradingView user liable for any possible claim for damages arising from any decision you make based on use of the script

Central Pivot Ranges (CPR) & 3 x VWAP & BarcolorsThis Script Combines daily, weekly and monthly VWAP (Volume Weighted Average Price) with a intraday, daily, weekly and monthly CPR (Central Pivot Range) - which is considered by some traders as the bread and butter of the market for a reason. A combination of Multiple CPRs and VWAPs from different timeframes can provide you with interesting confluences that can give you more confidence in performing your trades.
CPR Features:
- The option to look at current or developing CPRs.
- A resolution selector for all 4 CPRs
- Options to hide and show Tops, Bottoms and Pivots separately
- Various Styling options
- Alerts
VWAP Features:
- 3 x preset VWAPs set to daily, weekly and monthly
- VWAP Lines from the daily O&C or H&L
- Previous VWAP for S/R
- Line Styling options
General Features:
- Barcolors by pivots crossed or daily, weekly and monthly VWAP.
- Barcolors by daily VWAP additionally contain an O and C check instead of just taking the price above or below the VWAP into consideration.

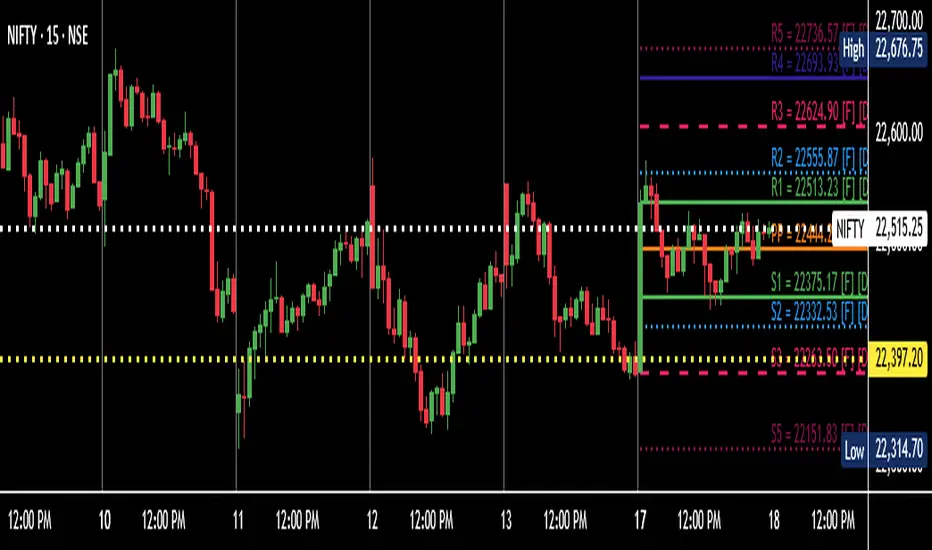
Daily Pivot (Fibonacci)Hello All
-
This is Daily Pivot (Fibonacci).
Simple and very useful tool for traders.
Show R5 to S5 levels.
.
Feel free to comment.
Thank you.
Yearly+Monthly PivotsThe following script helps you instantly plot yearly and monthly plots for indices, equities, commodities etc.
This can help you know the major monthly and yearly resistances and support.
The pivots described in the book are discussed in " Secrets of a Pivot Boss" by Franklin O. Ochoa.
----------------------------------------------------------------------------------------------------------------------------------------
Yearly Pivots :
Floor pivots -
The yearly pivots are labelled for quick reference.
YR1 - Yearly Resistance 1 - Black line
YR2 - Yearly Resistance 2 - Black line
YPP - Yearly CPR - Blue circles
YS1 - Yearly Support 1 - Green line
Note : S2 and S3 are not plotted as they are rarely touched over the course of a year.
Camarilla pivots -
YH3,YH4 - Fuchsia line
YL3,YL4 - Orange line
----------------------------------------------------------------------------------------------------------------------------------------
Monthly Pivots :
The monthly pivots have same color code as yearly pivots.
Floor pivots -
The following are plotted :-
R1,R2,R3,R4,S1,S2 - step_line
CPR - cross
Camarilla pivots -
H1,H2,L1,L2 - dotted
H3,H4,H5,L3,L4,L5 - step_line
Note : H5 and L5 are faded to avoid confusion with other resistances and support.
----------------------------------------------------------------------------------------------------------------------------------------
Constructive feedback appreciated.
Disclaimer : The indicators, strategies, columns, articles and all other features discussed here are for educational purposes only and should not be construed as investment and/or trading advice/tips.

Camerilla PivotsBefore starting special thanks to @QuantNomad for his script "Ultimate Pivot Point Alerts"
Link : -
Please follow and support him for his work.
In this script I'm modifying how time frame factor is imported into the script and removing other types of Pivots and cleaning it further for only CAMs, I've also added the formulas for 5 and 6 numbers, it will help in trading breakout strategies.
Note that this way of importing Time frame produces minor difference in readings/levels from how it is done in QuantNomads script, so before taking your pics you should calculate your levels on separate sheet and compare which ones are working for you and your strategy.
I've been using this CAM setup for almost a year now, so I coded it as per my needs, it is up to users to utilize it to theirs.
Further utility:
1. You can hide/unhide S/R levels 5/6
2. This is MultiTimeframe version, meaning you can change Time-frame of Pivots being displayed on any TF chart.
3. Lines are produced for only level 3 and 4. And you can choose to hide them. Only Pivot line is kept and can not be hidden.
4. You can also choose to hide/unhide level value and only see label if you want.
5. No historical levels are kept to avoid clutter.
I've not included alerts as I don't use them, but if anyone wants it I suggest referring to @QuantNomad script bank. He has published number of excellent scripts in this regard.
There is no restrictions on this script, it can be used and reproduced freely. Its my way of doing little something for community and my first script.
Enjoy.

Aroon Pivots BetaThis script is the beta version of the Aroon Pivots for testing purposes and is not intended to be used in real trading.
========= AROON PIVOTS =========
The purpose of this script is to use the power of the Aroon Lines to determine when trends or portions of a trend have reached a certain level of exhaustion, which in turn can help discover pivot points or reversals. Aroon Lines (the Up and Down lines) are measures of time that compare previous highs and lows, as well as opens and closes, which when compared can give insight on a possible incoming trading move. Aroon is one of the few indications that was designed for this purpose to show possible moves instead of historic data.
========= HOW TO USE =========
It's fairly simple, but small labels are created that show when entry or exit is at its closing peak. Labels can be used to enter as a maximum opportunity in addition to minimal risk, while simultaneously can be used to close an already open position for maximum closing results.
========= ADDITIONAL NOTES =======
- Labels are printed when the criteria is met, however, the labels are not fully realized until candle close.
- Labels are not repainted.
- Labels are specific to their relative timeframe, so its expected that a lower timeframe pivot will not expand into a high timeframe label, especially is the labels are giving opposite pivots.
Version 0.0.1


Manual Pivot Plotter//================================================================================
//📌 Manual Pivot Plotter (P, R1–R3, S1–S3)
//📈 Pine Script v6
//
//This script allows the user to manually input Pivot levels (P), Resistance levels
//(R1, R2, R3), and Support levels (S1, S2, S3). Each line starts at the beginning
//of the new trading day (detected at 00:00 UTC+8) and extends only a limited
//distance into the future (default: 3 bars).
//
//Features:
//✔ Manual pivot, support, and resistance level inputs
//✔ Lines refresh automatically at each new day (00:00 UTC+8)
//✔ Lines extend only a few bars ahead (not full chart)
//✔ Clean label placement slightly below line and near line end
//✔ No repainting, memory-safe line handling
//✔ Smooth intraday updates when values are edited
//
//This tool is ideal for traders who manually calculate or import pivot levels and
//prefer clean, minimal, non-intrusive visual levels on the chart.
//================================================================================

Rolling Pivot RibbonRolling Pivot Ribbon
This indicator displays historical and developing pivot levels across multiple days,
creating a dynamic "ribbon" effect as pivots roll forward through time.
DESIGNED FOR: Intraday timeframes (≤1D). Shows warning on higher timeframes.
USE CASE: Identify key support/resistance levels, track pivot evolution, and spot
price interaction zones with enhanced visual clarity.
WHY?
There comes a time in every Pinescript developer's evolution, they feel compelled to write a script that draws many lines, possibly triangles, into the future. This is mine. It's both totally useless, and a constant source of comfort to me.
KEY FEATURES:
• Multiple pivot calculation methods (Classic, Camarilla)
• Historical pivot tracking with configurable lookback period (default 4 days)
• Real-time "developing" pivots that update intraday based on current day's HLC
• Gradient fills between adjacent pivot levels for visual depth
• 13 pivot levels: PP, R1-R6, S1-S6
TASTY MODE (Advanced):
• Intelligent filtering: only shows lines that price has recently intersected
• Dynamic transparency: opacity adjusts based on intersection frequency
• Auto-cleanup: removes stale lines that haven't been touched in X days
• Smart extensions: lines that see more action project further into the future
• Focus mode options to reduce chart clutter
VISUAL CONTROLS:
• Toggle individual pivot levels on/off
• Customizable colors and transparency for lines and fills
• Flexible label positioning (left-align or right-align)
• Adjustable projection length for pivot lines (defaults to 1. Set to 0 for just a ribbon)

Pivot + OHLC【Pivot + OHLC|使い方(日本語)】
■ 概要
前日のOHLCラインと、当日の高値/安値(点線)を表示しつつ、標準ピボット(複数方式)を同一チャートに描画するインジケーターです。デイトレ~スイングでの当日レンジ把握、前日基準の反発/ブレイク確認、ピボット到達の可視化に向きます。
■ 主な機能
- 前日OHLC:前日の「Open/High/Low/Close」を水平ステップラインで描画(色変更可)
- 当日H/L:当日の「高値/安値」を点線のライン&ラベルで表示(最終バーのみ)
- ピボット:Traditional / Fibonacci / Woodie / Classic / DM / Camarilla に対応
- 表示制御:ピボット各レベル(P, R1~R5, S1~S5)の個別ON/OFF、色、ラベル位置を設定可
- パフォーマンス:古いピボットは自動削除(件数を設定可能)
■ 基本の使い方
1) チャートに追加したら、時間軸を普段の取引足に設定します。
2) 「OHLC Resolution」で前日の参照解像度(通常は1D)を選択。
3) 「Hide past OHLC」をONにすると、前日のOHLCは“表示用解像度の最終バー”付近のみ表示され、過去の混雑を抑えます。
4) 「Display resolution (for OHLC)」はOHLCラベルの表示基準となる時間足(通常は1D)です。
5) 「Line Width」で前日OHLC&当日H/L&ピボットの線幅を共通で調整します。
6) ピボットは「Pivot Type」「Pivots Timeframe」「Use Daily-based Values」等で調整します。
- デイトレ用途:Pivot Timeframe=“Auto or Daily”、Use Daily-based Values=ON が手堅い構成です。
7) 「labels」グループで「Show Labels」「Show Prices」「Labels Position(Left/Right)」を調整します。
■ パラメータ早見表
- OHLC Resolution:前日データの参照足(既定:1D)
- Hide past OHLC:過去の前日OHLCを非表示(既定:ON)
- Display resolution (for OHLC):OHLCラベルの表示基準足(既定:1D)
- Open/High/Low/Close:前日ライン色
- Line Width:全ライン共通の太さ
- Show Labels / Show Prices:ラベルの名称/価格の表示切替
- Pivot Type:ピボット方式(Traditional / Fibonacci / Woodie / Classic / DM / Camarilla)
- Pivots Timeframe:ピボット計算のアンカー(Auto / Daily / Weekly / … / Yearly派生)
- Number of Pivots Back:履歴ピボット保持数(古いものは自動削除)
- Use Daily-based Values:日足ベースで安定描画(短期足での未確定ずれを抑制)
- Labels Position:ピボットラベルの左右
■ 表示仕様のポイント
- 当日H/Lは点線ライン+ラベル(日本語表記:当日高値/当日安値)。最新バー時のみ表示・更新。
- 前日OHLCはステップライン。色を変更すると対応するラベル色も自動で連動。
- ピボットは方式により有効なレベル数が異なります(例:DMは少なめ、Traditional/CamarillaはR5/S5まで可)。
- レベルの個別トグル(Show P, Show R1 …)で混雑を抑えられます。
■ 注意事項 / ヒント
- 低スペック環境や極端に長い履歴では「Number of Pivots Back」を下げると安定します。
- 取引所/銘柄のセッションや休日によっては、1日の切替タイミングと当日H/Lの更新に差異が出る場合があります。
- Intradayでの“開場直後~日足切替前後”はリフレッシュによりH/Lやラベル位置が追随します。
- 「Use Daily-based Values」をONにすると、短期足でのピボット再計算による細かなズレを抑制できます。
■ 使いどころ
- 前日安値→当日戻り高値→ピボットR1の順に到達など、日内の“基準面”を連結して相場の節目を確認。
- ブレイク判定時に当日H/Lとピボット到達を併読して、利確/押し目候補を素早く評価。
- 指値戦略では、前日値幅(H-L)とピボット帯の重なりで「厚い」価格帯を抽出。
■ Overview
This indicator overlays prior-day OHLC lines, today’s high/low (dotted), and standard Pivot Points on the same chart. It’s built for quick intraday context: prior-day anchors, current-day range, and pivot confluence.
■ Key Features
- Yesterday’s OHLC: horizontal step-lines with customizable colors
- Today’s High/Low: dynamic dotted lines + labels (shown/updated on the latest bar)
- Pivot Points: Traditional / Fibonacci / Woodie / Classic / DM / Camarilla
- Fine control: per-level toggles (P, R1–R5, S1–S5), colors, label side
- Performance-aware: old pivots are auto-pruned by “Number of Pivots Back”
■ Quick Start
1) Add to your chart and choose your working timeframe.
2) Set “OHLC Resolution” (usually 1D).
3) Turn ON “Hide past OHLC” to keep charts clean by only showing recent prior-day OHLC.
4) “Display resolution (for OHLC)” defines the baseline timeframe for OHLC label placement (usually 1D).
5) Adjust “Line Width” to control all line thicknesses at once.
6) Configure pivots via “Pivot Type”, “Pivots Timeframe”, and “Use Daily-based Values”.
- For day trading, “Auto or Daily” + “Use Daily-based Values = ON” is a robust setup.
7) In “labels”, toggle “Show Labels”, “Show Prices”, and choose “Labels Position (Left/Right)”.
■ Parameter Cheatsheet
- OHLC Resolution: timeframe used for prior-day data (default 1D)
- Hide past OHLC: hide historical prior-day OHLC (default ON)
- Display resolution (for OHLC): baseline for OHLC label placement (default 1D)
- Open/High/Low/Close: colors for the four prior-day lines
- Line Width: global thickness for OHLC / Today H/L / Pivots
- Show Labels / Show Prices: text/price display for labels
- Pivot Type: Traditional / Fibonacci / Woodie / Classic / DM / Camarilla
- Pivots Timeframe: anchor timeframe (Auto / Daily / Weekly / … / Yearly variants)
- Number of Pivots Back: how many historical pivot sets to keep (older ones are deleted)
- Use Daily-based Values: stabilize pivot drawing on intraday charts
- Labels Position: left or right for pivot labels
■ Display Notes
- Today’s H/L are dotted lines with labels (“Today’s High” / “Today’s Low”); they update only on the latest bar.
- Prior-day OHLC uses step-lines; label color automatically follows line color.
- Available pivot levels depend on the chosen type (e.g., DM has fewer, Traditional/Camarilla support up to R5/S5).
- Use per-level toggles (Show P, Show R1, …) to reduce clutter.
■ Tips / Caveats
- On modest hardware or very long histories, reduce “Number of Pivots Back” for stability.
- Exchange sessions/holidays can slightly shift the daily roll and when Today’s H/L updates.
- Around the daily roll, intraday charts may refresh H/L/labels as new data confirms.
- “Use Daily-based Values = ON” helps avoid micro-shifts from frequent intraday recalculations.
■ Practical Use
- Chain prior-day low → intraday pullback high → pivot R1 to frame day structure.
- On breakouts, read Today’s H/L with pivot reaches to judge take-profit / pullback zones.
- For limit orders, intersect prior-day range (H–L) with pivot bands to find “thick” price zones.

Swing High/Low Pivots Strategy [LV]The Swing High/Low Pivots Strategy was developed as a counter-momentum trading tool.
The strategy is suitable for any market and the default values used in the input settings menu are set for Bitcoin (best on 15min). These values, expressed in minimum ticks (or pips if symbol is Forex) make this tool perfectly adaptable to every symbol and/or timeframe.
Check tooltips in the settings menu for more details about every user input.
STRTEGY ENTRY & EXIT MECHANISMS:
Trades Entry based on the detection of swing highs and lows for short and long entries respectively, validated by:
- Limit orders placed after each new pivot level confirmation
- Moving averages trend filter (if enabled)
- No active trade currently open
Trades Exit when the price reaches take-profit or stop-loss level as defined in the settings menu. A double entry/second take-profit level can be enabled for partial exits, with dynamic stop-loss adjustment for the remaining position.
Enhanced Trade Precision:
By limiting entries to confirmed swing high (HH, LH) or swing low (HL, LL) pivot points, the strategy ensures that trades occur at levels of significant price reversals. This precision reduces the likelihood of entering trades in the midst of a trend or during uncertain price action.
Risk Management Optimization:
The strategy incorporates clearly defined stop-loss (SL) and take-profit (TP) levels derived from the pivot points. This structured approach minimizes potential losses while locking in profits, which is critical for consistent performance in volatile markets.
Trend Filtering for Better Entry:
The use of a configurable moving average filter adds a layer of trend validation. This prevents entering trades against the dominant market trend, increasing the probability of success for each trade.
Avoidance of Noise:
The lookback period (length parameter) confirms pivots only after a set number of bars, effectively filtering out market noise and ensuring that entries are based on reliable, well-defined price movements.
Adaptability Across Markets:
The strategy is versatile and can be applied across different markets (Forex, stocks, crypto) due to its dynamic use of ticks and pips converters. It adapts seamlessly to varying price scales and asset types.
Dual Quantity Entries:
The original and optionnal double-entry mechanism allows traders to capture both short-term and extended profits by scaling out of positions. This adaptive approach caters to varying risk appetites and market conditions.
Clear Visualization:
The plotted pivot points, entry limits, SL, and TP levels provide visual clarity, making it easy for traders to track the strategy's behavior and make informed decisions.
Automated Execution with Alerts:
Integrated alerts for both entries and exits ensure timely actions without the need for constant market monitoring, enhancing efficiency. Configurable alert messages are suitable for API use.
Any feedback, comments, or suggestions for improvement are always welcome.
Hope you enjoy!

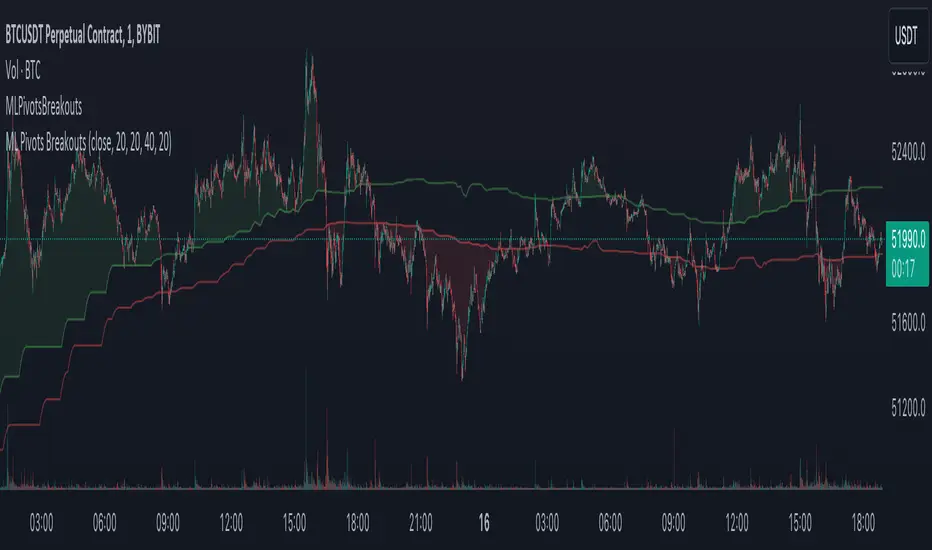
Machine Learning Breakouts (from Pivots)I developed the 'Machine Learning Breakouts (from Pivots)' indicator to revolutionize the way we detect breakout opportunities and follow trend, harnessing the power of pivot points and machine learning. This tool integrates the k-Nearest Neighbors (k-NN) method with the Euclidean distance algorithm, meticulously analyzing pivot points to accurately forecast multiple breakout paths/zones. "ML Pivots Breakouts" is designed to identify and visually alert traders on bullish breakouts above high lines and bearish breakouts below low lines, offering essential insights for breakout and trend follower traders.
For traders, the instruction is clear: a bullish breakout signal is given when the price crosses above the forecasted high line, indicating potential entry points for long positions. Conversely, a bearish breakout signal is provided when the price breaks below the forecasted low line, suggesting opportunities to enter short positions. This makes the indicator a vital asset for navigating through market volatilities and capitalizing on emerging trends, designed for both long and short strategies and adeptly adapting to market shifts.
In this indicator I operate in a two-dimensional space defined by price and time. The choice of Euclidean distance as the preferred method for this analysis hinges on its simplicity and effectiveness in measuring and predicting straight-line distances between points in this space.
The Machine Learning Breakouts (from Pivots) Indicator calculations have been transitioned to the MLPivotsBreakouts library, simplifying the process of integration. Users can now seamlessly incorporate the "breakouts" function into their scripts to conduct detailed momentum analysis with ease.
Fibonacci Matrix Pivot Points [Trading Instruments]1. Overview:
Fibonacci Pivot Points is a highly dynamic and versatile indicator. It specializes in calculating pivot points using Fibonacci ratios, a popular method in technical analysis for identifying significant price levels. This tool is ideal for traders who focus on intraday and long-term market trends, offering precise pivot points for a variety of trading styles.
2. Core Features and Functionality:
Multiple Timeframe Options: From 'Auto' to 'Decennially', the indicator provides flexibility in selecting the appropriate pivot calculation period, catering to both short-term and long-term analysis.
Diverse Pivot Types: Includes options like 'Standard Levels', 'Extended Support/Resistance Levels', and 'Every Level', offering a range of pivot point calculations to suit different market conditions.
Number of Pivots Back' Function: This feature allows users to view historical pivot points up to a specified number, providing a deeper insight into past market behavior.
Customizable Visuals: Allows for personalization with various line styles (solid, dashed, dotted) and colors, enhancing the visibility and differentiation of pivot levels on charts.
Label and Price Display: Options to show labels and prices for each pivot point, with the ability to position them on either the left or right side, providing clear and immediate identification of key levels.
3. Technical Specifications:
The pivot point calculations are based on Fibonacci ratios, providing a mathematical and predictive approach to market analysis.
Historical Pivot Analysis: The 'Number of Pivots Back' function allows for analysis of pivot points over historical data, enhancing trend and reversal identification.
The indicator's flexibility allows it to adjust to different market conditions, whether for stocks, forex, crypto, commodities, or futures. Basically any and all instruments with moving prices.
Detailed Pivot Level Formulas: Each pivot type employs specific Fibonacci ratios for calculation:
Standard Levels:
Pivot Median (P) = (Previous High + Previous Low + Previous Close) / 3
R1 = P + 0.382 * (Previous High - Previous Low)
S1 = P - 0.382 * (Previous High - Previous Low)
R2 = P + 0.618 * (Previous High - Previous Low)
S2 = P - 0.618 * (Previous High - Previous Low)
R3 = P + 1.000 * (Previous High - Previous Low)
S3 = P - 1.000 * (Previous High - Previous Low)
Standard Enhanced Levels:
Pivot Median (P) = (Previous High + Previous Low + Previous Close) / 3
RA = P + 0.236 * (Previous High - Previous Low)
SA = P - 0.236 * (Previous High - Previous Low)
R1 = P + 0.382 * (Previous High - Previous Low)
S1 = P - 0.382 * (Previous High - Previous Low)
RB = P + 0.500 * (Previous High - Previous Low)
SB = P - 0.500 * (Previous High - Previous Low)
R2 = P + 0.618 * (Previous High - Previous Low)
S2 = P - 0.618 * (Previous High - Previous Low)
RC = P + 0.764 * (Previous High - Previous Low)
SC = P - 0.764 * (Previous High - Previous Low)
R3 = P + 1.000 * (Previous High - Previous Low)
S3 = P - 1.000 * (Previous High - Previous Low)
Bumper Levels (R3/S3):
Pivot Median (P) = (Previous High + Previous Low + Previous Close) / 3
R3 = P + 1.000 * (Previous High - Previous Low)
S3 = P - 1.000 * (Previous High - Previous Low)
Support Levels:
Pivot Median (P) = (Previous High + Previous Low + Previous Close) / 3
Follows the same structure as 'Standard Enhanced' but only includes the support levels (SA, S1, SB, S2, SC, S3, S4, S5, S6, S7).
Resistance Levels:
Pivot Median (P) = (Previous High + Previous Low + Previous Close) / 3
Follows the same structure as 'Standard Enhanced' but only includes the resistance levels (RA, R1, RB, R2, RC, R3, R4, R5, R6, R7).
Extended Support Levels:
Pivot Median (P) = (Previous High + Previous Low + Previous Close) / 3
S3 to S7 are calculated with increasing Fibonacci extensions beyond the 'Standard' level.
Extended Resistance Levels:
Pivot Median (P) = (Previous High + Previous Low + Previous Close) / 3
R3 to R7 are calculated with increasing Fibonacci extensions beyond the 'Standard' level.
Full Levels:
Combines all R and S levels from 'Standard' and 'Extended' types.
Full Enhanced Levels:
Combines all R, S, RA, SA, RB, SB, RC, SC levels from 'Standard Enhanced', 'Extended Support', and 'Extended Resistance' types.
4. User Interface and Visualization:
The interface is designed for ease of use, offering intuitive controls for selecting pivot types, timeframes, and visual settings.
Pivot points are displayed prominently on the chart, with clear demarcation and labeling for quick analysis.
5. Application and Trading Strategy Integration:
The indicator can be seamlessly integrated into various trading strategies, especially those that emphasize support and resistance levels for entry and exit points.
Traders can use it to identify potential reversal points, breakout opportunities, or to confirm other technical indicators.
6. Benefits and Advantages:
Enhances trading strategy by providing precise Fibonacci-based pivot points.
Aids in risk management by clearly identifying potential support and resistance levels.
Adaptable to various market conditions and trading styles, from day trading to swing and position trading.
7. Instructions for Use:
To add this indicator to a TradingView chart, search for "Fibonacci Pivot Points " in the indicators section and apply it to your chart.
Customize the pivot type, timeframe, and visual settings as per your trading needs and preferences.
8. Conclusion:
The "Fibonacci Pivot Points " indicator is a comprehensive tool that combines the reliability of Fibonacci calculations with the flexibility of multiple pivot point types and timeframes. Its integration into TradingView makes it a valuable asset for traders looking to enhance their market analysis and decision-making process.
9. Disclaimer:
This indicator is provided for informational purposes only and should not be solely relied upon for trading. Past performance is not indicative of future results. Traders should use this tool as part of a broader trading strategy.

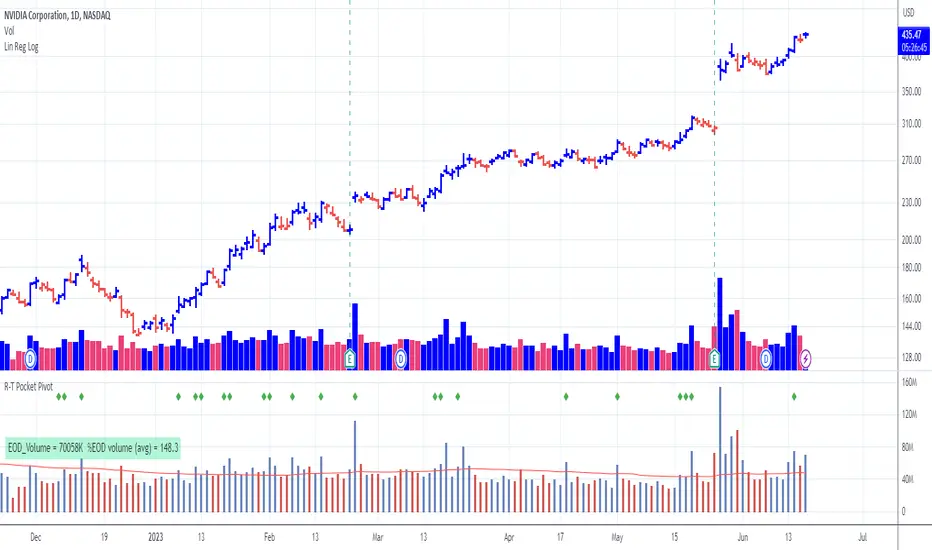
Pocket Pivot with extrapolated Volume and Moving AveragesThe script shows historical pocket pivots, much as other scripts with a green diamond shape on the volume pane.
When the market is open, the current bar, however, is extrapolated to the end of the day using a sixth-order polynomial.
Thus real-time pocket pivots are shown. To work properly, the user must input a time-zone offset parameter; the default is west coast USA.
Time-zone offset is -12 hours to +12 hours compared to the NYSE exchange time zone (USA west coast: -3.)
The volume extrapolation polynomial is based on a historical NASDAQ intraday volume model developed locally by a team.
Only ten-day lookback pocket pivots are computed as defined initially by Dr. Chris Kacher. (The default lookback can be changed by the user.)
Only pocket pivots are shown where the low of the daily bar is within user-defined proximity to the 50-day moving average or 10-day moving average (for continuation pocket pivots.)
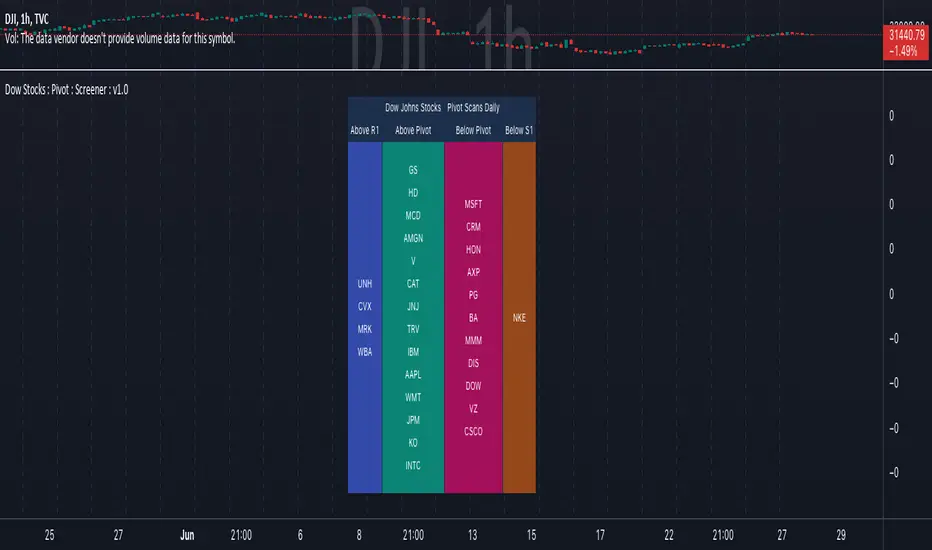
Dow Jones Stocks : Pivot : ScreenerWith the Dow Jones Stocks Pivot Screener, you can scan a list of the 30 stocks / companies included in the Dow Jones Industrial Average index in real-time.
By using the indicator, you can monitor pivot breakouts and enter trades based on them.
As soon as the DJIA Index list is updated, I will update this List
The indicator includes three types of pivots . Classic, Fibonacci, and Standard.
You have the option to select between Daily, Weekly, and Monthly time frames as well
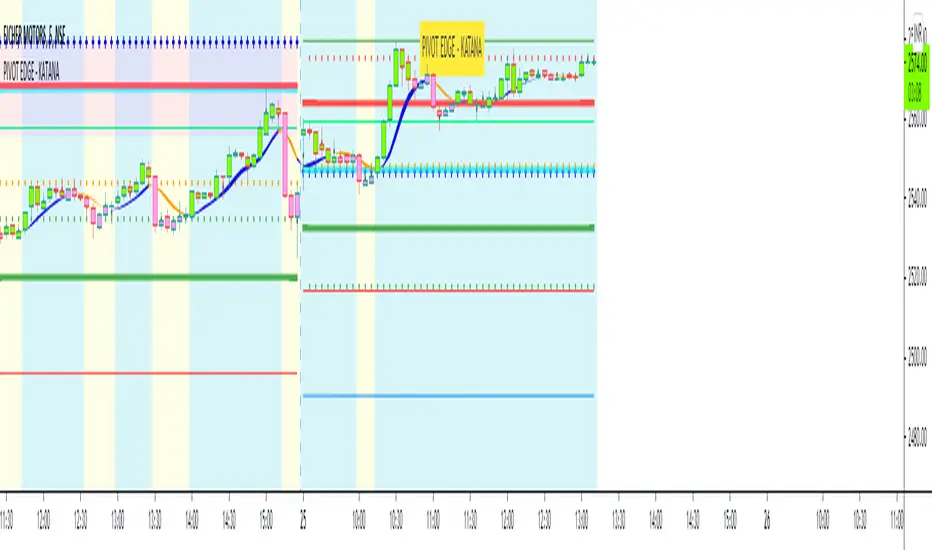
PIVOT EDGE - KATANAIntroduction to the Indicator " PIVOT EDGE - KATANA " . Katana means the sword in Japanese that the legendary samurai warriors used which was sharp , swift and strong to take on any opponent and gave an edge to win. This Indicator also has some of the unique features and hence it is aptly named so.
The Foundation layout for this indicator is based on PIVOT's which are nothing but the most important levels that the price has respected in the past. The values for the pivots are derived from the key attributes of the price in any timeframe such as the OPEN, HIGH, LOW and CLOSE. These define the mood of the price and where it intends to move in relation to the previous range formed. Earlier HIGH - LOW i.e the RANGE indicates the possible movement that a stock can make in the current session and as per the calculated pivots we can possible find out the tentative supports and resistances. In addition to this indicator, It is advisable to use the price action theory which helps in taking a right decision for entries.
This indicator by itself is complete in nature, i.e it guides the user for possible entry levels and the projected targets that we can achieve and also the likely stop loss limit in case the price reverses. So beforehand even before entering into a trade position, the user can ascertain what can be his loss or max profit and then he can chose an optimum position size for favorable results.
The beauty of this Indicator lies in the fact that it can be used for all types of trading like Scalping, Intra day, Swing or Positional and Investments also. It works on all timeframes and across all market segments like EQUITY, COMMODITIES , FUTURES , OPTIONS , FOREX etc.
This indicator can be used for any exchange and any time zone also without any changes or adjustments needed.
Now let us understand the features of this Indicator in detail.
TIMEFRAME - It has options to choose between Day, week and month as timeframe. By default it is set to Day timeframe
DISPLAY MAJOR LEVELS - These are the important support and resistance levels calculated based on the past price data. Most important ones are marked in BOLD RED and BOLD GREEN between which the price tends to move generally.
Apart from these, We have breakout level marked in light green and if price breaks this level we can expect targets upto extended levels and beyond marked in blue.
we also have breakdown level marked in light red and if price breaks this level we can expect targets down up to extended levels and below it marked in blue.
DISPLAY HIDDEN LEVELS - These levels are intermediate supports and resistances that can be used whenever the present day indicated range is very wide. Whenever we have an explosive moments in market the range of that day is very huge and so he next day support and resistance band becomes very wide indicating the sideways movement day within that range. And on those days we can switch on the hidden levels and the price respects these levels and most of the days it is inside this range only.
DISPLAY PREVIOUS HIGH / LOW / CLOSE - I have included Daily / Weekly levels. It is important to know the earlier highs / lows and close since price respects it very must just like support and resistance .
MID OF PEMA - This is an important EMA based indicator which potentially indicates curves of support and resistance during retracements or pullbacks. If the curve is breached then the trend is reversed and the price will tend to move to the next pivots . You can use this as trailing stop loss.
CPR - Central Pivot range, An Important tool for the CPR purists. I am using this particular CPR , TC , BC Band as a colored band indicating whether it is ascending or descending bias. The Band color is GREEB when the CPR is ascending up compared to yesterday and RED when is descending. By the width and narrowness of CPR you can ascertain the trading range and this information is available right after the market close so that you can plan your trades for tomorrow.
SENTIMETER LINE - Gives you a glimpse of the market sentiment at the pre open. Based on this you can know if there is a shift in the sentiment of Buyers / sellers and if price is accepted or rejected. This level acts as an important support / resistance level.
VWAP - Volume weighted average price , One of the widely used and maybe the only Indicator used on charts by most pro traders and big institutions. It gives you an Idea of the volumes that are getting traded in huge quantity and will act as a magnet attracting and also repelling price.
CANDLE MID POINT - This is small feature that's is very important but gets ignored because of lack of knowledge or awareness by traders. Most of the times the mid of the explosive or momentum candles becomes the last line of defense for Buyers / sellers and you can see the battle happening exactly at this point.
THE TURNING POINT - As the name suggests, most of the times price gets turned away from this because lot of fresh and unfilled orders are waiting to be executed at this level. So it becomes an important profit booking or fresh entry level
SCALPERS MAGIC CURVE - This is a high speed curve which has zero lag and very dynamic in nature which reacts quickly to the change in price. Go long when it is trending up and Blue in color, close trade when it turns orange and makes a U turn and vice versa. Most suited for scalpers who trade in 2 to 5 mins time frame. When you want to use this, switch off all other below parameters.
SMART RIBBON - The best and the new unique feature of this curve. As compared my other previous Indicators which had PEMA curve as the base for trend Identification, Here i am introducing this ribbon concept which is much faster reacting to the change in trend and gives you very early entry and also early exits so that you can get the maximum gains from the trend. In a way you can catch the fall right from the start till the end and exit at the end of the trend. Blue for uptrend and Orange for Downtrend.
MARKET BIAS INDICATOR - Again one more unique feature introduced in this Indicator. This feature will paint the chart background in Light blue for BUY ZONE And light yellow for SELL ZONE. You can look to BUY or SELL based on the background color and hence it prevents you from entering trade in wrong or opposite direction. You can avoid trade when there is too much crisscross of colors indicating sideways or range bound market.
BUY SELL TRIGGERS - This features is built on smart logic based on price action / Candle patterns / pivots and my trading experience. It colors the candle bars into LIME GREEN / PINK whenever Buying / Selling opportunities are seen. This is also paired with the alert system which can be used to set automatic sound and desktop notifications. Based on the type of account you hold in trading view you can set alerts for upto 400 stocks.
SMART CANDLE COLORING - If you don't want to do the work of finding the trend and looking for right entry location and exit levels, then you can simply use this feature which makes trading look so simple and easy. This is like an AUTO PILOT mode or CRUISE mode where it colors the candles in only BUY ZONE color ( LIME GREEN ) or SELL ZONE color ( PINK ). Take entry above the high of the first candle and be in the trade as long as you see the opposite color. When you want to use this feature, switch off the BUY SELL TRIGGER.
It is advised that you first learn how this indicator works by back testing historical data and also forward testing in live market by way of paper trading before you deploy real money.
IMPORTANT NOTE : This indicator does not guarantee any favorable results nor protect your from any loss. You own the complete risk of your trades. It is suggested that you use this indicator and do back testing for considerable period to understand how it works the the potential win rate it can give. If you have any doubts or need any clarifications of assistance in understanding, you can message me and I will try to help.
Happy and Safe trading - Mohan from PIVOT EDGE
Contact for getting access to this Indicator. Send a personal message on trading view or on my whatsapp no 9353160775