Cari dalam skrip untuk "pivot"

[JRL] Pivot Regression OscillatorIntroducing the Pivot Regression Oscillator. This oscillator uses a similar formula to the Stochastic Oscillator. However, instead of comparing the closing price to the lowest price of a period, it compares the distance between current price and the current pivot point. By basing our oscillator on pivot levels, we incorporate a much more relevant and consequential price point around which to base our comparisons.
The indicator can give reliable overbought and oversold signals, and it plots two exponential moving averages as output, which provides crossover signals that can be used to help time trades.
The Pivot Regression Oscillator can be effective for timing re-entries into a trend and seems to be able to avoid some of the false signals of other indicators.
Let me know if you find this useful. Cheers!

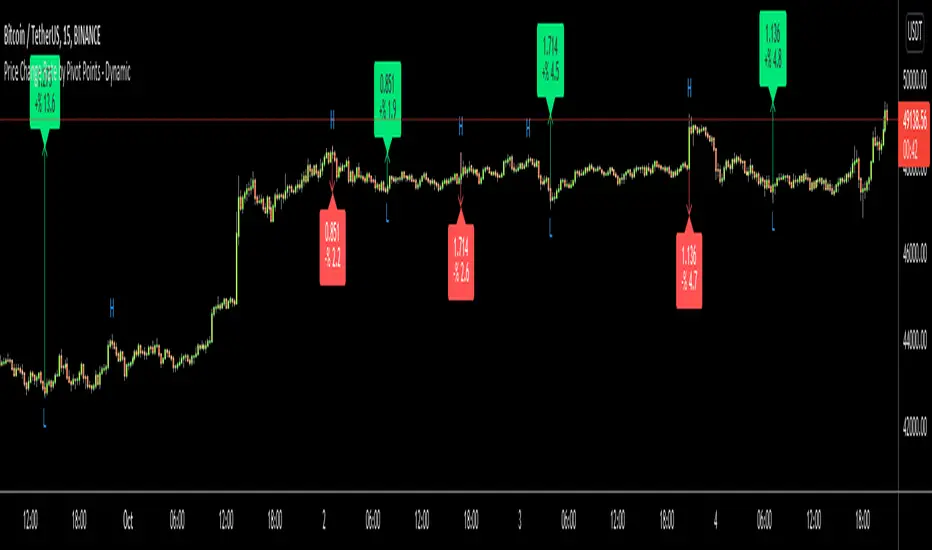
Price Change Rate by Pivot Points - DynamicHi Everyone
Usually I need Price Change info and I believe most of you need this info too. I want to see how it increased/decreased. I automate this by using Pivot Points.
it works dynamically and it uses Pivot Highs and Pivot Lows accordingly. That means it calculates which one to use.
Please watch following video:
Enjoy!
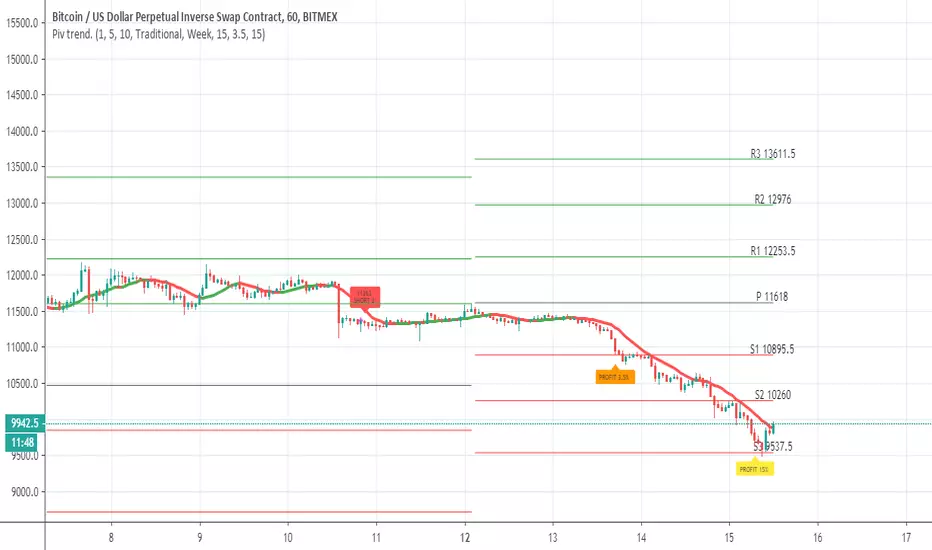
Pivot trend pivots taken from
the system is based on cross up or down of the trend line of weekly pivot point
exit is by % 3.5 and 15% (you can change it to your liking
rebuy at 15% loss
this is sill crude system so user need to refine setting to make it work best for him
ATR based Pivots mcbwHey everyone this is an exciting new script I have prepared for you.
I was reading an old forex bulletin article some time ago when I came across this: solar.murty.net (or you can download the full bulletin with lots of other good articles here: www.forexfactory.com).
You can already buy this for metatrader (www.mql5.com) so I figured to make it for free for tradingview.
This bulletin suggested that you can reasonably predict daily volatility by adding or subtracting multiples of the daily ATR to the daily opening. Using this you can choose multiples to use as price targets and alternatively as stop losses. For example, if you already have a sense of market direction you can buy at market open place a stop loss at - 1 daily ATR and a profit target at + 3 ATRs for a risk to reward ratio of 3. If you are looking for smaller/quicker moves with a ratio of 3 you can have a stop loss at -0.25 ATR and a take profit at +0.75 ATR.
Alternatively this article also suggests to use this method to catch volatility breakouts. If price is higher than the + 1 ATR area then you can safely assume it will be going to the +2 ATR area so you can put a buy stop at + 1 ATR with a profit target at + 2 ATR with a stop loss at +0.5 ATR to catch a volatility breakout with a risk to reward ratio of 2!
Even further there are methods that you can use with ATRs of multiple window sizes, for example by opening two copies of this indicator and measuring recent volatility with a 1 week window and long term volatility within a 1 month window. If the short term volatility is crossing the long term volatility then there is a high probability chance that even more price movement will occur.
However I have found that this method is good for more than daily volatility , it can also be used to measure weekly volatility , and monthly volatility and use these multiples as good long term price targets.
To select if you want daily, weekly, or monthly values of the ATR of volatility you're using go to the settings and click on the options in the "Opening period". The default window of the ATR here is 14 periods, but you can change this if you want to in "ATR period". Most importantly you are able to select which multiples of the ATR you would like to use in the settings in "ATR multiple 1" which is the green line, "ATR multiple 2" which is the blue line, and "ATR multiple 3" which is the purple line. You can select any values you want to put in these, the choice of 0.25, 0.5, and 1 is not special, some people use fibonacci numbers here or simply 0.33, 0.66, and 0.99.
Repainting issue: This script uses the daily value of the Average True Range (ATR), which measures the volatility that is happening today. If price becomes more volatile then the value of the ATR can increase throughout the day, but it can never decrease. What this means is that the ATR based pivots are able to expand away from the opening price, which should not affect the trades that you take based on these areas. If you base your take profit on one of these ATR multiples and the daily volatility increase this means that your take profit area will be closer to your entry than the ATR multiple. Meaning that your trades will be more conservative.
While this all may sound very technical it is super intuitive, throw this on your chart and play around with it :)
Happy trading!


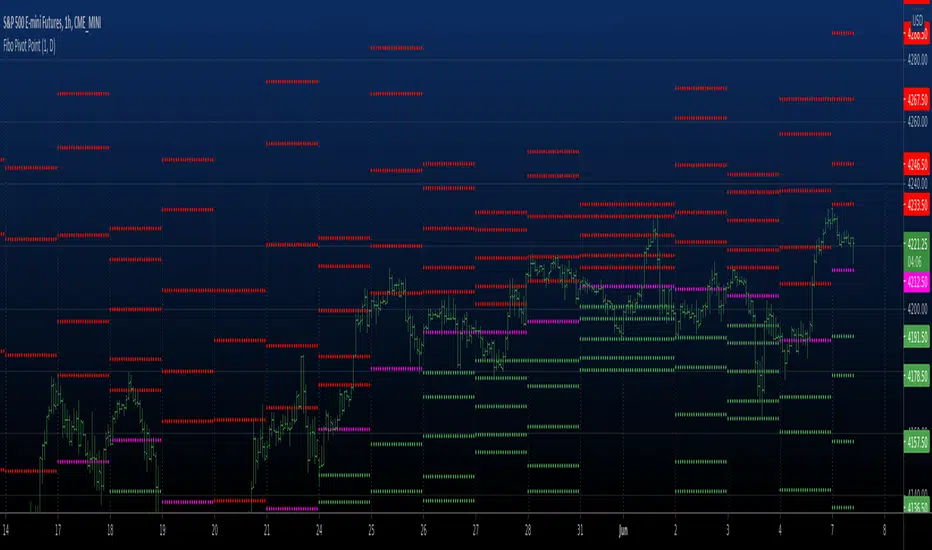
Fibonacci Pivot RangeThis is based on Fibonacci Pivot Points. I forked "CristianD CD_PivotR" code for this. Thanks
"Fibonacci Pivot Points start just the same as Standard Pivot Points. From the base Pivot Point, Fibonacci multiples of the high-low differential are added to form resistance levels and subtracted to form support levels."
Pivot Point (P) = (High + Low + Close)/3
Support 1 (S1) = P - {.382 * (High - Low)}
Support 2 (S2) = P - {.618 * (High - Low)}
Resistance 1 (R1) = P + {.382 * (High - Low)}
Resistance 2 (R2) = P + {.618 * (High - Low)}
Adding more support or resistance levels should be really easy.

[Study] Pivots EMA Stoch SetupUsing daily pivot, if price is greater or under the four EMAs, and if we have a stoch signal, then we have an entry/exit condition.

Dynamic Fibonacci Pivot Points & EMA CrossoversI have created this script for those who face difficulties drawing Fibonacci levels as this script is Dynamic so it automatically calculates the ranges based on current High and Lows. I have also added Standard Fibonacci Pivot Points so that we can easily see the confluences between Dynamic and Standard pivot points. Apart from this I have also added EMA Crossovers so that we can easily identify trend changes. You can modify this script as per your own.

Fibo Pivot Point Copyright by HPotter v1.0 07/05/2021
Fibo Pivot Points
Added change TF for calculate.
Original version:by BhavikBhavsar
[JRL] ATR Pivot PointsThis indicator plots pivot points with support and resistance lines based on average true range (ATR). ATR is one of the best volatility and trading range predictors, so it can be very useful for finding confluence in any strategy.

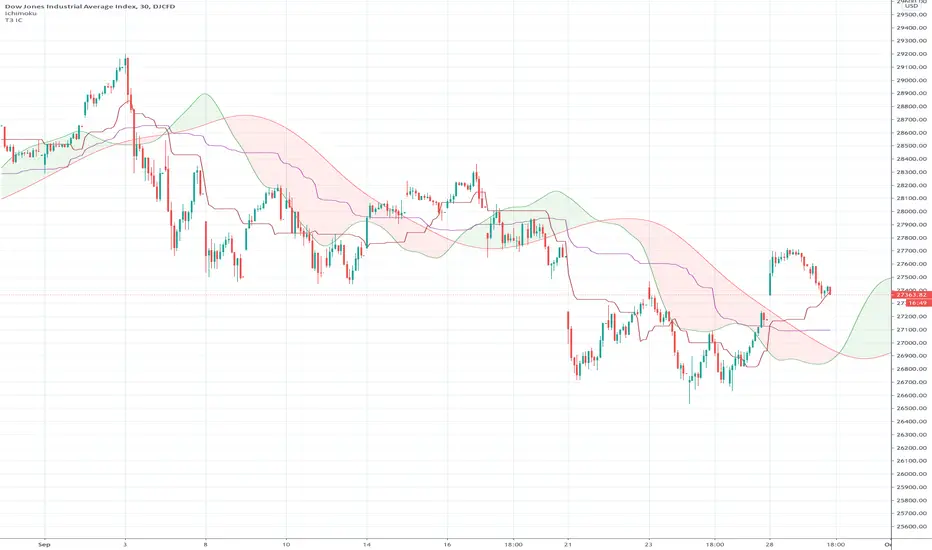
Ichimoku Cloud "Pivot"The purpose of the base and conversion lines is to give an indication of the current trend but the numerous crossings and false signals make it noisy and unreliable. This new indicator dubbed the the Ichimoku Cloud Pivot is based on an average of the IC leading spans without the time offset which are further filtered through a Donchian Channel. The result is the purple line which has fewer crossings and reliably serves as a resistance/support as shown in the diagram. It can be used in instances where the cloud fails to give a clear signal of the current trend. The brown line is the standard conversion line and is shown for reference.
Fibonacci and Pivot Point ,vwap and Average to Determine Trend Script has Current day Pivot Point with Central Pivot Range,vwap and Average to Determine Trend , and a day Back Projection of Fibonacci.
Its Very easy to see the Support and Resistance and even can set your Target based on that ..
i will clean it more after that and Update same ..
Thank You
If any one has any Modification to do its Code is open to Use.

Pivot LinesThis indicator provides possible short, medium, and long-term support and resistance levels based on recent highs and lows. The furthest the level is, the thicker its line is, making it easy to spot stronger levels where 2 lines overlap. It can be configured to use open/close values instead of high/low for tighter levels.
Default settings:
- Short Period: 20
- Medium Period: 50
- Long Period: 100
This script also provides alerts for when the price crosses over/under a given level or pulls back.
Note: It sometimes displays supports above the price and resistances below it, I still have to figure out why (and fix it if possible), but it's still useful.


The Pivot Detector Oscillator Strategy The Pivot Detector Oscillator, by Giorgos E. Siligardos
The related article is copyrighted material from Stocks & Commodities 2009 Sep
WARNING:
- This script to change bars colors.

Double Pivot RSfinding the resistance and support line from pivot point with similar value as double-top or bottom.

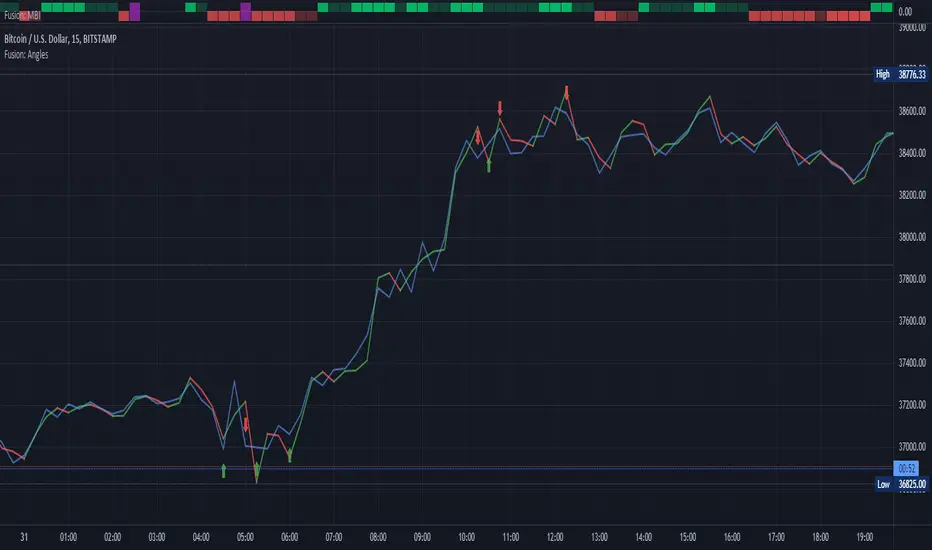
Fusion: Pivot Angles and ThresholdsThis is a somewhat unusual indicator working purely on geometry.
You set a threshold for an angle of a pivot and if the angle is LESS THAN (because the sharper the pivot the smaller the angle) your threshold then a signal is given.
I use this as an exit indicator and it works well for me when other methods don't give a clear signal. Seeing where it shows up it might also make a good entry indicator but I'll leave it up to others to play with that and see if it's a good entry indicator for them. If you find it is good for entries or other things please drop me a note or make a comment, I would appreciate knowing.
If you set the length to 1 for the moving average then it will just use the source and not perform a moving average operation.
There's half a dozen or so moving average types to select from so you will probably find one that suits you pretty well.
The settings are certainly not optimized so set to whatever suits your needs as my defaults will probably be wrong for you.
The code is structured to easily drop into a bigger system so use it as a lone indicator or add the code to some bigger project you are creating. If you do integrate it into something else then send me a note as it would be nice to know it's being well used.
Finally, if you find value please do make a comment, give a thumbs up etc.
Enjoy and good luck!
Future PivotNormaly Pivot is calculate from the last candle.
Future Pivot is calculate from the running candle.
The Future Pivot Indicator is usefull at the end of a period (11pm, Sundays, and end of the month)
Have Fun
Please do not Copy&Paste, use this Link
Have Fun

Chonky Pivot Pointsstandard pivot points re-written with circle plots.
Only shows the current pivot points. P, R1/R2, S1/S2
I don't use R3, R4 etc. so I didnt include them but feel free to modify the code.
You can change the resolution in indicator settings, default is set to Monthly.
Also to change the size of the circles all at once, you can input a number 1-4 in the inputs section.
