Cari dalam skrip untuk "pivot"

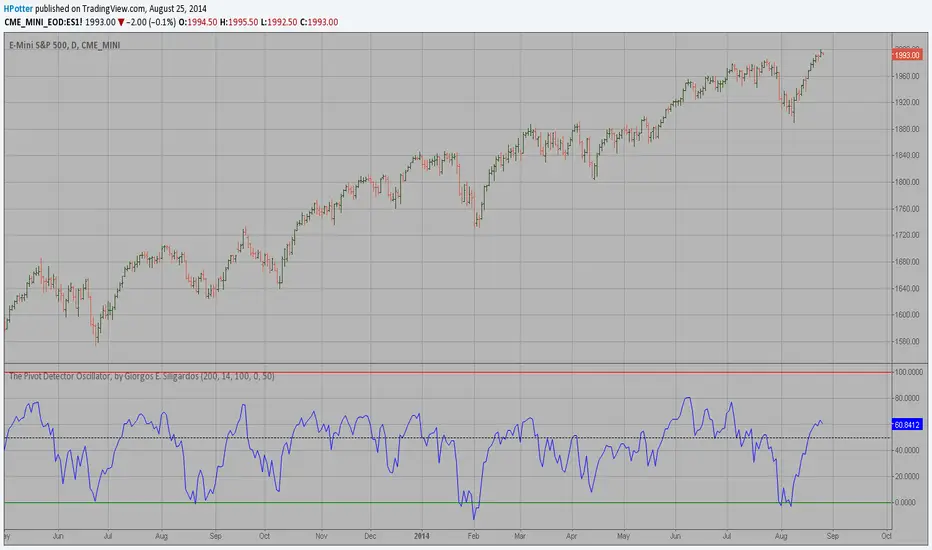
Pivot Detector Oscillator, by Giorgos E. Siligardos The Pivot Detector Oscillator, by Giorgos E. Siligardos
The related article is copyrighted material from Stocks & Commodities 2009 Sep
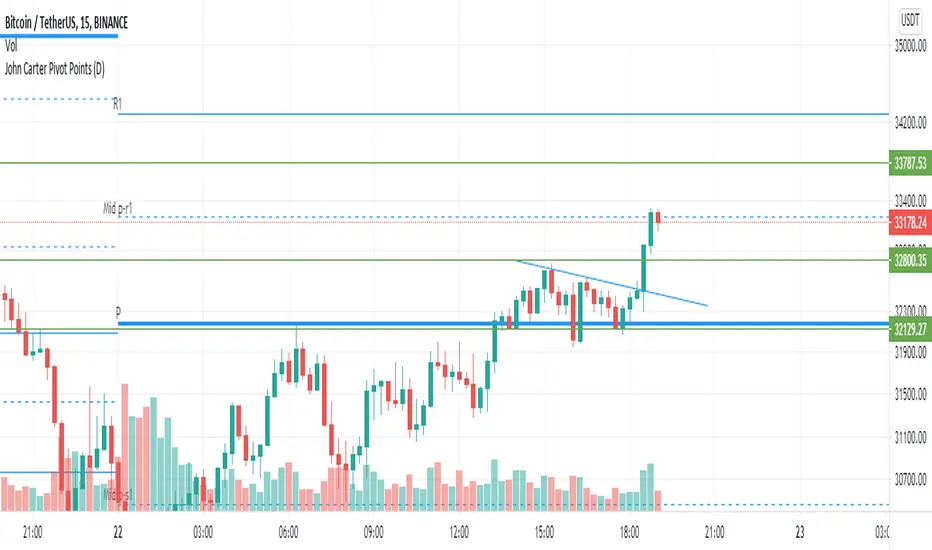
John Carter Pivot Points
This script is based on John Carter Mastering The Trade book. Pivot calculation is based on the previous day high, low, and close.
What Are the Trading Rules for Pivot Buys on Trending Days?
Sells are reversed.
1. Each day I update the appropriate pivot levels on the charts to reflect the previous day’s action. On Mondays, I also
update the weekly pivots, and on the first trading day of a new month, I update the monthly pivots.
2. The first pivot play is done in conjunction with the gap, if there is one. If there is a gap down, then I buy a decline into
the closest pivot level. If there isn’t a playable gap (more than 10 YM points or 1 ES point), then I will wait until
9:45 a.m. eastern to initiate the first play.
3. If the volume on the five-minute ES chart is more than 25,000 contracts, then I’ll wait for the markets to penetrate a
pivot level and move up at least a quarter of the way to the next pivot level. Once this happens, I will then set up a
bid to buy the first retracement back to the violated pivot level.
4. I enter my trades with limit orders only. I place orders “just in front of” the pivot. For the YM, I use 3 points; for the
ES, 0.25 point; for the NQ, 0.50 point; for the TF, 0.20 point; and for individual stocks, 5 cents. For example, if I’m
trading the YM and the pivot level is 10,000, then I would buy a decline to 10,003 and short a rally to 9997
.Sometimes the pivot will be an odd number, such as 1117.38 on the ES. In this case, I always round in the direction of
the trade. So, if I’m bidding for a long, I will round 1117.38 to 1117.50, and my bid will be 1117.75. If I’m offering a
short, I will round 1117.38 down to 1117.25 and place my offer at 1117.00. My stops and targets, then, would be “just
in front of” these appropriate long and short levels.
5. Once filled, I place an order to close the first half at the next pivot level and the second half at the pivot level after
that, using the same “just in front of” parameters.
6. I place a stop at 20 points for the YM, 2 points for the ES, 4 points for the NQ, and 1.50 points for the Russell. For
stocks, I will use a stop based roughly on the price of the stock. If the stock is under $10 a share, I will use a stop of
20 cents. If it is between $10 and $20, I will use a stop of 30 cents; if it is between $20 and $30, I will use a stop of
40 cents, and so on, adding another 10 cents for each $10 increment in price. (A $75 stock would have an 80-cent
stop, for example.)
7. If the first target is hit, I will then move up the stop to my entry-level pivot, minus the “just in front of” fractions
discussed in rule 3. For example, if I get in a YM long at 10,003 and the pivot is at 10,000, then my new stop would
be 9997 once the first target is hit.
8. If I am in a trade at the market close and neither my stop nor my target has been hit, I will close out my position “at the
market” at 4:10 p.m. eastern for futures, and at 3:58 p.m. eastern for stocks.
9. I don’t initiate any new positions after 3:30 p.m. eastern, but I will manage existing positions into the close.
10. The markets rarely have a sustained move above R3 or below S3. If I trade to those levels, I will always fade the
move.
11. After two losers in a row, I’m done with pivots for the day.
What Are the Trading Rules for Pivot Buys on Choppy Days?
Once again, sells are the same, just reversed. The rules for choppy days are identical except for the targets. On choppy days, I
just focus on the YM and the ES. My first target is mechanical: 10 points for the YM and 1 point for the ES on half of my
position. Once this is hit, I will trail up my stop in the same way I would for a trending trade. The second target becomes the
“just in front of” level for the actual next pivot level
Camarilla Pivot Plays (Lite) [BruzX]█ OVERVIEW
This indicator implements the Camarilla Pivot Points levels and a system for suggesting particular plays. It only 3rd, 4th, and 6th levels, as these are the only ones used by the system. It also optionally shows the Central Pivot Range, which is in fact between S2 and R2. In total, there are 12 possible plays, grouped into two groups of six. The algorithm evaluates in real-time which plays fulfil their precondition and shows the candidate plays. The user must then decide if and when to take the play.
█ CREDITS
The Camarilla pivot plays are defined in a strategy developed by Thor Young, and the whole system is explained in his book "A Complete Day Trading System". This description is self-sufficient for effective use.
█ FEATURES
Display the 3rd, 4th and 6th Camarilla pivot levels
Works for stocks, futures, indices, forex and crypto
Automatically switches between RTH and ETH data based on criteria defined by the system.
Option to force RTH/ETH data and force a close price to be used in the calculation.
Preconditions for the plays can be toggled on/off
Works correctly on both RTH and ETH charts
Well-documented options tooltips
Well-documented and high-quality open-source code for those who are interested
█ HOW TO USE
The defaults work well; at a minimum, just add the indicator and watch the plays being called. For US futures, you will probably want to chat the "Timezone for sessions" to New York and the regular session times to 09:30 - 16:00. The following diagram shows its key features.
By default, the indicator draws plays 1 days back; this can be changed up to 20 days. The labels can be shifted left/right using the "label offset" option to avoid overlapping with other labels in this indicator or those of another indicator.
An information box at the top-right of the chart shows:
The data currently in use for the main pivots. This can switch in the pre-market if the H/L range exceeds the previous day's H/L, and if it does, you will see that switch at the time that it happens
Whether the current day's pivots are in a higher or lower range compared to the previous day's.
The width of the pivots compared to the previous day
The current candidate plays fulfilling preconditions. You then need to watch the price action to decide whether to take the play.
The resistance pivots are all drawn in the same colour (red by default), as are the support pivots (green by default). You can change the resistance and support colours, but it is not possible to have different colours for different levels of the same kind.
█ CONCEPTS
The indicator is focused around daily Camarilla pivots and evaluates the preconditions for 12 possible plays: 6 when in a higher range, 6 when in a lower range. The plays are labelled by two letters—the first indicates the range, the second indicates the play—as shown in this diagram:
The pivots can be calculated using only RTH (Regular Trading Hours) data, or ETH (Extended Trading Hours) data, which includes the pre-market and post-market. The indicator implements logic to automatically choose the correct data, based on the rules defined by the strategy. This is user-overridable. With the default options, ETH will be used when the H/L range in the previous day's post-market or current day's pre-market exceeds that of the previous day's regular market. In auto mode, the chosen pivots are considered the main pivots for that day and are the ones used for play evaluation. The "other" pivots can also be shown—"other" here meaning using ETH data when the main pivots use RTH data, and vice versa.
The plays must fulfil a set of preconditions. There are preconditions for valid region and range, price sweeps into levels, correct pivot width, opening position, price action, and whether neutral range plays and premarket plays are enabled. When all the preconditions are fulfilled, the play will be shown as a candidate.
█ NOTE FOR FUTURES
Futures don't officially have a pre-market or post-market like equities. Let's take ES on CME as an example. It trades from 18:00 ET Sunday to 17:00 Friday (ET), with a daily pause between 17:00 and 18:00 ET. However, most of the trading activity is done between 09:30 and 16:00, which you can tell from the volume spikes at those times, and this coincides with NYSE/NASDAQ regular hours. So we define a pseudo-pre-market from 18:00 the previous day to 09:30 on the current day, then a pseudo-regular market from 08:30 to 16:00, then a pseudo-post-market from 16:00 to 17:00. The indicator then works exactly the same as with equities—all the options behave the same, just with different session times defined for the pre-, regular, and post-market, with "RTH" meaning just the regular market and "ETH" meaning all three.
█ LIMITATIONS
The pivots are very close to those shown in DAS Trader Pro. They are not to-the-cent exact, but within a few cents. The reasons are:
TradingView provides free real-time data from CBOE One, not full exchange data (you can pay for this though, and it's not expensive), and
the close/high/low are taken from the intraday timeframe you are currently viewing, not daily data—which are very close, but often not exactly the same. For example, the high on the daily timeframe may differ slightly from the daily high you'll see on an intraday timeframe.
Despite these caveats, occasionally large spikes will be seem in one platform and not the other (even with paid data), or the spikes will reach significantly difference prices. Where these spikes create the daily high or low, this can cause significantly different pivots levels. The more traded the stock is, the less the difference tends to be. Highly traded stocks are usually within a few cents (but even they occasionally have large differences in spikes). There is nothing that can be done about this.
The 6th Camarilla level does not have a standard definition and may not match the level shown on other platforms. It does match the definition used by DAS Trader Pro.
Replay mode for stocks does not work correctly. This is due to some important Pine Script variables provided by the TradingView platform and used by the script not being assigned correct values in replay mode. Futures do not use these variables, so they should work in replay mode.
The indicator is an intraday indicator (despite also being able to show weekly and monthly pivots on an intraday chart). It deactivates on a daily timeframe and higher. Sub-minute timeframes are also not supported.
The indicator was developed and tested for US/European stocks, US futures and EURUSD forex and BTCUSD. It should work as intended for stocks and futures in different countries, and for all forex and crypto, but this is tested as much as the security it was developed for.
█ DISCLAIMER
This indicator is provided for information only and should not be used in isolation without a good understand of the system and without considering other factors. You should not take trades using real money based solely on what this indicator says. Any trades you take are entirely at your own risk.

Fibonacci Pivot | SyedFibonacci pivots combine Fibonacci retracement levels with pivot points to provide potential support and resistance levels. This tool is based on the idea that price tends to retrace a predictable portion of a move, after which it often continues in the original direction.
Here’s a breakdown of Fibonacci pivots:
1. Pivot Point (PP)
The central level that acts as the main reference point for support and resistance levels. It’s calculated as the average of the high, low, and close of the previous period (typically a day).
Formula:
𝑃
𝑃
=
(
𝐻
𝑖
𝑔
ℎ
+
𝐿
𝑜
𝑤
+
𝐶
𝑙
𝑜
𝑠
𝑒
)
3
PP=
3
(High+Low+Close)
2. Fibonacci-Based Support and Resistance Levels
These levels are derived by multiplying the range (High - Low) of the previous period with key Fibonacci ratios (23.6%, 38.2%, 61.8%, etc.), then adding or subtracting this result from the Pivot Point.
The Fibonacci ratios used in Fibonacci pivots are typically:
38.2%: A strong retracement level.
61.8%: The golden ratio, a key Fibonacci level that often acts as major support or resistance.
100%: Full retracement from the previous period's high or low.
Fibonacci Support Levels (S1, S2, S3, etc.)
These levels indicate potential areas where the price might find support:
S1 = PP - (Range * 0.382)
S2 = PP - (Range * 0.618)
S3 = PP - (Range * 1)
Fibonacci Resistance Levels (R1, R2, R3, etc.)
These are the areas where price might face resistance:
R1 = PP + (Range * 0.382)
R2 = PP + (Range * 0.618)
R3 = PP + (Range * 1)
Interpretation
R1/R2/R3: Potential resistance levels where price might face selling pressure.
S1/S2/S3: Potential support levels where price might encounter buying interest.
Pivot Point (PP): Acts as the primary level of interest. If the price is above the PP, it suggests bullish sentiment; if below, bearish sentiment.
Example

Simple PivotsSuper Simple Pivots, based on
and adapted from
Will take a low or high point and compare left and right, if its the lowest or highest respectively, a line is drawn forward until another point meets the criteria
The lookback period will delay the formation of new pivots. In the original two indicators, the pivot lines would stop drawing. I have added a line extension from the most recent pivots forward to indicate whether the current market price exceeds or is within the recent pivot point ranges. If the market price is above or below the high or low pivots respectively, the line will become solid. Otherwise, the pivot extension lines will be dotted.
There is an option to place price labels below the historical pivot points. Default is disabled because it clutters the chart.
Removed all alerts and MA from the original two indicators to improve speed.
Let me know if you have any questions!
gkjch

Multi-Timeframe Pivot PointsThis is a MTF pivot point indicator. I was unhappy with the standard pivot point indicator in Trading View as I wanted to be aware of how price was interacting with pivot points on a higher timeframe. For example, if I'm on the 1H time frame looking at daily pivots, I want to be sure that my trading plan to move between these pivots does not contradict what price is trying to do in relation to the weekly pivots. In addition, sometimes daily and weekly pivots will align increasing probability of a bounce
Ultimately its about trying to automate as much as possible to quickly have an awareness of what might be happening on the timeframe above without having to manual enter levels.
I concluded I don't like the results of this script - whilst i clearly see price interacting with pivots on the current timeframe and higher timeframes there is too much screen clutter on the screen for me.
Rather than delete the script I thought I'd make it available for other people to use. I hope its useful to people. Good luck
(For the record it actually takes a little thinking outside the box to make so many pivots display - you can't just plot hlines. If your a pinescript geek you might like the code)
BTC-OTHERS Liquidity PivotBTC-OTHERS Liquidity Map – 1-hour Multi-Asset Pivot Scanner
WHAT IT DOES
This script tracks liquidity shifts between Bitcoin (BTC) and the broader alt-coin market (the OTHERS market-cap index that excludes the top-10 coins). It labels every confirmed 1-hour swing high or low on both assets, then flags four states:
BearPivot – BTC prints a new swing High while OTHERS does not; liquidity crowds into BTC and alts are weak.
BullPivot – BTC prints a swing Low and OTHERS forms a Higher Low; fresh liquidity starts flowing into stronger alts.
BearCon – BTC prints a swing Low and OTHERS forms a Lower Low; down-trend continuation.
BullCon – No new BTC Low while OTHERS makes a Higher High; up-trend continuation.
Signals appear on the actual pivot bar (offset back by the look-back length), so they never repaint after confirmation.
HOW THE PIVOTS ARE FOUND
• Symmetrical window: “Pivot Len” bars to the left and right (default 21).
• Full confirmation on both sides delivers stable, non-repainting pivots at the cost of about Pivot Len bars’ delay.
• Labels are offset –Pivot Len so they sit on the genuine extreme.
INPUTS
Symbols: BTC symbol and an OTHERS symbol so you can switch exchanges or choose another alt index.
Pivot Len: tighten for faster but noisier signals; widen for cleaner pivots.
Style: customise shape and text colours.
PLOTS AND ALERTS
Four labelled shapes (BearPivot, BullPivot, BearCon, BullCon) plot above or below price. Each label is linked to an alertcondition, so you can create one-click alerts and stay informed without watching the screen.
TYPICAL WORKFLOW
1. Attach the script to any 1-hour BTC chart (or leave the script’s timeframe empty to follow your current chart TF).
2. Turn on alerts to receive push/email notifications.
3. Use the labels as a liquidity compass, combining them with volume, funding or your own strategy for actual entries and exits.
Enjoy and trade safe.

Predictive Pivot Points based on Technicals Did this indicator as an experiment for fun and it actually works pretty well!
What it does?
Well, Pivot Points (PP) are useful but delayed. So the premise of this indicator is pretty simple. It stores variables from previous Pivot Highs and Pivot Lows (RSI, MFI, Stochastics and volume) and then looks for like circumstances to trigger early pivot alerts based on historic pivot traits.
And that's pretty much it.
It also acts as a normal pivot indicator, but it will display the data that is being logged. You can see in the chart above but here is another image:
How to use it?
So, there are a lot of inputs. First off, you can customize the data you want stored, in terms of the RSI, MFI and Stochastic source and length.
You can then set the thresholds for triggering. The default threshold is +/- 2. That means, it will look for similarities within +/- 2 of the previous pivot points.
You can then select to see each individual technical to signal pivots. That means, it will look at RSI, MFI, Stochastic and Volume in isolation to trigger early pivot signals. See the image below:
In the image above, you can see it signaling pivots based on individual technical readouts from RSI, to Stochastics and MFI and Volume.
If you want it to be a bit more strict, you can have it only trigger when all 3 (MFI, Stochastics and RSI) are similar. Note that volume has been excluded in the identical instances:
In the image above, you will see it triggers based on all 3 being similar. Note that when you select this option, you will get a lot less signals but more rigorous signals.
Final thoughts:
That is basically the indicator in a nut shell. Its pretty self explanatory.
If you have any specific questions feel free to leave them below.
Thanks for checking this out and safe trades!

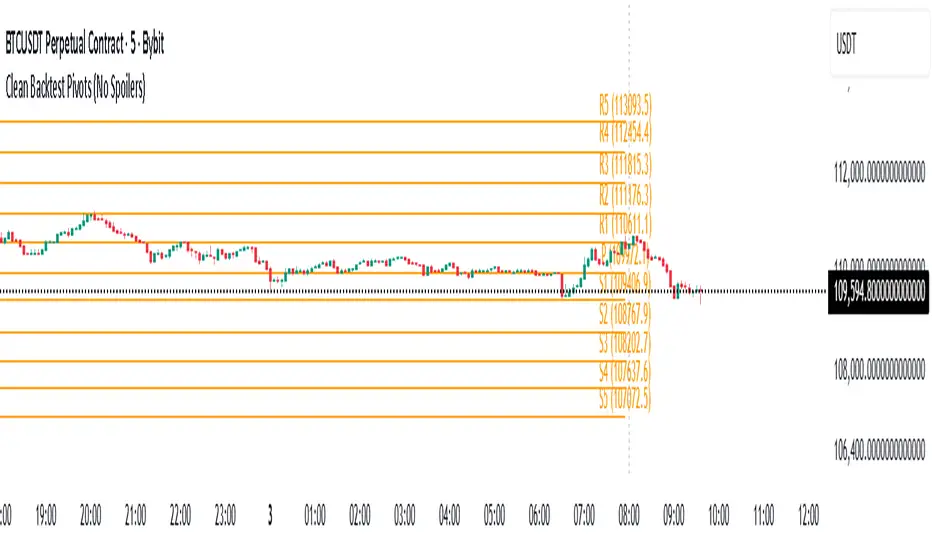
Daily Backtest Pivots Problem with the built-in Pivot Points Standard indicator in backtesting/replay mode:
The default "Pivot Points Standard" indicator is excellent on live charts, but it becomes completely unusable for proper backtesting or bar-replay because it always calculates and displays the current day’s pivot points (P, R1, R2, S1, S2, etc.) using the high/low/close of the still-forming current day — even when you're replaying historical bars.
Example:
When replaying or backtesting September 8 at 08:00 (Asian session), the indicator already shows the final R1, R2, S1, S2 for the entire September 8 daily candle, even though in real trading at that moment you would have no idea where the day will close or what the final daily range will be. This creates massive look-ahead bias and makes any strategy that uses daily pivots impossible to test realistically.
Desired behavior (historical accuracy):
During backtesting or bar replay, the indicator should only plot:
The previous day’s completed pivot levels (which were actually known at the start of the current day)
NO current-day pivot levels at all (or only plot them after the daily candle is closed)
Many custom pivot scripts already do exactly this (they only show the prior day’s levels throughout the current day), which is why people abandon the built-in indicator for backtesting.
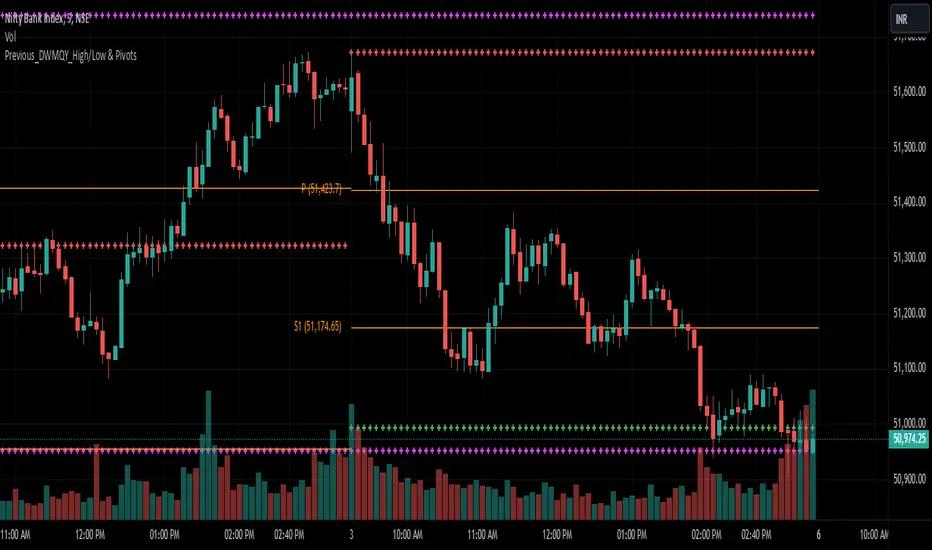
Previous_DWMQY_High/Low & PivotsThis script calculates high/low pivots for different timeframes (daily, weekly, monthly, quarterly, and yearly). You have various pivot point calculation methods (Traditional, Fibonacci, Woodie, Classic, DM, Camarilla) and have inputs that allow customization of the indicator. The script also accounts for custom year-based calculations (bi-yearly, tri-yearly, quinquennially, decennially).
The first part of your code calculates the high and low levels for different timeframes, which are plotted on the chart as crosses. The second part involves the pivot point calculations, where the user selects the type of pivot point calculation (Traditional, Fibonacci, etc.), the timeframe for pivots, and other display settings.
SVE Pivot PointsSVE Pivot Points are a modified variation of traditional pivot points created by Sylvain Vervoort (SVE). They are designed to adapt more dynamically to price volatility and short-term market structure, giving traders more responsive support and resistance levels.
Unlike standard floor pivots that rely only on the previous period’s high/low/close, SVE Pivot Points incorporate volatility-based smoothing, making the levels more stable during choppy markets and more reactive when volatility expands.
1. Volatility-Adaptive Formulas
SVE uses smoothing techniques (often EMA-based or Vervoort’s proprietary volatility filters) that adjust to current market noise.
This reduces false levels and gives clearer reaction zones.
2. Dynamic Support & Resistance
You still get:
• Pivot (P)
• Support levels (S1, S2, S3)
• Resistance levels (R1, R2, R3)
But they update based on volatility-weighted highs/lows instead of raw numbers.
3. More Reliable in Intraday Trading
SVE pivot points were designed to:
• Improve accuracy
• Reduce whipsaw
• Give better intraday turning points
This is why they’re popular among futures, forex, and index traders.

Modified - Pivot Points Standard with Daily H/L/CThis indicator plots Pivot Points Standard with six calculation methods (Traditional, Fibonacci, Woodie, Classic, DM, Camarilla) and flexible anchors (Auto/D/W/M/Q/Y and multi-year). You can restrict pivots to the current day/week/month, choose daily-based data (uses higher-timeframe OHLC; futures use settlement close) or intraday aggregation, and independently style pivots versus previous-period lines with solid/dashed/dotted types and custom widths. Per-level colors are provided (PP/R/S), with R4/R5 and S4/S5 off by default, plus optional labels showing prices positioned left or right. It also draws the previous Day/Week/Month High, Low, and Close across the current period using completed higher-timeframe values (lookahead_off with ), ensuring they always reflect the prior session/period. Rendering is optimized by limiting historical pivot sets and auto-cleaning old lines for smooth performance on any timeframe.

[r380]Bear & Bull Pivot Signal Indicator_(Lite))Bear & Bull Pivot Signal Indicator
Overview:
The Bear & Bull Multi Pivot Signal Indicator is a comprehensive trading tool designed to identify potential market reversal points and trend changes. This indicator combines multiple technical analysis strategies such as RSI, MACD, and pivot points to generate reliable signals. By overlapping these signals, the indicator increases the possibility of accurate trend predictions, providing traders with valuable insights for informed decision-making.
"This indicator is primarily optimized for Bitcoin on a 15-minute timeframe and is recommended for short-term trading. Reliability on other timeframes is not guaranteed."
Key Features:
Bear and Bull Signals: Clearly indicate potential market reversal points using bear and bull emojis.
Support and Resistance Signals: Indicated with sun and snowflake emojis to show critical price levels.
Overheat Cooldown Pivot: Detects market exhaustion points to signal potential reversals.
Settings:
RSI Settings: Adjust the RSI period and thresholds to match your trading strategy. Default values are optimized for short-term trading.
MACD Settings: The MACD settings are pre-configured but can be customized if needed.
Visual Settings: If excessive signals cause visual discomfort, you can selectively enable or disable features in the visual settings.
Signal Descriptions:
🐻 Bear Signal: Indicates a potential high point where the market may reverse downwards. Combines RSI and MACD conditions to provide a reliable overbought signal. When accompanied by high volume, it can indicate a strong resistance level.
🐮 Bull Signal: Indicates a potential low point where the market may reverse upwards. Uses both RSI and MACD conditions to highlight oversold situations. When accompanied by high volume, it can indicate a strong support level.
❄️ Resistance Signal: Shows a resistance level where the price has difficulty moving higher. When the price crosses below this level, it signals a potential downward movement. Combined with high volume, it can signify robust resistance.
☀️ Support Signal: Shows a support level where the price has difficulty moving lower. When the price crosses above this level, it signals a potential upward movement. Combined with high volume, it can signify strong support.
Detailed Explanation:
This indicator is not simply a combination of multiple indicators but is designed to increase the probability of detecting potential trend reversal signals by using multiple signals. If signals only appear when multiple conditions are met, how many trades can we make in a year? Because there is no 100% certainty in any situation, we need to use various signals to construct our strategy and proceed with trading. For example, if only one signal appears, the reliability of the trend reversal signal is somewhat weak, so we can strategize by betting only a portion of the capital. If multiple signals appear simultaneously, we can consider it a highly reliable trend reversal signal and increase the betting amount and stop loss accordingly. The essence of this indicator, in my view, is not to blindly trade based on signals but to use it as an auxiliary tool for strategic decision-making.
RSI (Relative Strength Index), MACD, and Stochastic RSI: By using various indicators to confirm trend reversal signals, bear and bull emojis are included. If the RSI reaches an oversold zone and then drops by a certain amount, while the MACD turns negative and the Stochastic RSI makes a gold or dead cross, the bear and bull signals are activated.
Pivot Points: Calculated based on the high, low, and close prices over a specific lookback period. These points are used to determine support and resistance levels. Pivot points provide a framework for assessing market sentiment and potential reversal zones. The values calculated this way activate the sun and snowflake signals.
The Overheat Cooldown Pivot: captures moments when the market shows signs of exhaustion, particularly when overbought or oversold conditions are accompanied by a drop in volume. This helps traders anticipate market turning points more effectively. These signals appear as red or green triangles indicating potential reversals. Although similar to the bear and bull signals in detecting market cool-off points, these signals rely on volume and may have slightly lower reliability.
Practical Application:
By using this indicator, traders can strategically adjust their bet sizes based on the reliability of the signals. When multiple signals coincide, it indicates a higher probability of a trend reversal, allowing for larger position sizes. Conversely, when signals occur independently, it suggests a lower probability, warranting smaller position sizes. This approach enables traders to manage their risk effectively and capitalize on high-probability trading opportunities without excessively reducing trading frequency.
Trading Method:
The basic setup is for Bitcoin on a 15-minute timeframe, and short-term trading is recommended by the creator. Upon signal activation, if only one signal appears, verify the volume and support/resistance lines, calculate the risk-reward ratio, and enter a position with a low betting ratio. If three signals activate simultaneously, enter a position with a higher betting ratio.
Reliability Order:
🐻🐮 > ❄️☀️ > 🔻🔺 (replacing green triangle emojis)
This indicator provides a powerful method for detecting multiple potential market reversals and trend continuations.
Note: Have realistic expectations and understand the limitations of technical analysis tools. This indicator is a tool to assist in your trading decisions and not a guaranteed prediction of market movements.
Warning! Do not trade solely based on this indicator.
Additionally, if you find the settings lacking, feel free to adjust them yourself! Thank you!
Korean Version
곰돌이와 송아지 멀티 피봇 시그널 인디케이터
개요:
곰돌이와 송아지 멀티 피봇 시그널 인디케이터는 잠재적 시장 반전 지점과 추세 변화를 식별하기 위해 설계된 종합 거래 도구입니다. 이 인디케이터는 RSI, MACD, 피봇 포인트 등의 여러 기술 분석 전략을 결합하여 신뢰할 수 있는 신호를 생성합니다. 이러한 신호들을 중첩함으로써 정확한 추세 예측의 가능성을 높여, 트레이더가 정보를 기반으로 결정을 내리는 데 유용한 통찰력을 제공합니다.
기본적으로 비트코인 15분봉을 기준으로 하며 매매 방법은 단타를 권장합니다. 다른 타임프레임에서의 신뢰는 보장 하지 않습니다.
주요 기능:
곰돌이와 송아지 신호: 시장의 잠재적 반전 지점을 곰돌이와 송아지 이모지로 명확하게 표시합니다.
지지 및 저항 신호: 중요한 가격 수준을 나타내기 위해 태양과 눈송이 이모지로 표시합니다.
오버히트 쿨다운 피봇: 시장 피로 지점을 감지하여 잠재적 반전 신호를 제공합니다.
세팅방법:
RSI 설정: RSI 기간과 임계값을 조정하여 자신의 거래 전략에 맞춥니다. 기본값은 단기 거래에 최적화되어 있습니다.
MACD 설정: MACD 설정은 미리 구성되어 있으며, 필요에 따라 사용자 정의가 가능합니다.
비쥬얼 세팅: 과도한 시그널 때문에 눈이 아프시다면 비쥬얼세팅에서 선택적으로 기능들을 켜거나 끌 수 있으니 참고하세요.
신호 설명:
🐻 곰돌이 신호: 시장이 하락할 가능성이 있는 고점을 나타냅니다. RSI와 MACD 조건을 결합하여 신뢰할 수 있는 과매수 신호를 제공합니다. 높은 거래량과 함께 나타나면 강한 저항 수준을 나타낼 수 있습니다.
🐮 송아지 신호: 시장이 상승할 가능성이 있는 저점을 나타냅니다. RSI와 MACD 조건을 사용하여 과매도 상황을 강조합니다. 높은 거래량과 함께 나타나면 강한 지지 수준을 나타낼 수 있습니다.
❄️ 저항 신호: 가격이 더 이상 상승하기 어려운 저항 수준을 나타냅니다. 가격이 이 수준 아래로 하락하면 잠재적 하락 움직임을 신호합니다. 높은 거래량과 함께 나타나면 강력한 저항을 의미할 수 있습니다.
☀️ 지지 신호: 가격이 더 이상 하락하기 어려운 지지 수준을 나타냅니다. 가격이 이 수준 위로 상승하면 잠재적 상승 움직임을 신호합니다. 높은 거래량과 함께 나타나면 강한 지지를 의미할 수 있습니다.
상세 설명:
이 인디케이터는 여러 인디케이터를 단순히 결합한 것이 아니라, 여러가지 시그널들을 사용해서 잠재적 추세전환 신호 감지 확률을 높이는 것에 목적이 있습니다. 단순히 여러가지 조건들이 중첩되었을때만 신호가 뜬다면 우리는 1년에 몇번이나 매매를 할 수 있을까요. 모든경우에 100% 라는 경우가 없기때문에 우리는 다양한 신호들을 활용하여 전략을 구성하고 매매를 진행 해야합니다. 예를들어 1개의 시그널만 뜬다면 추세전환 신호의 신뢰도가 다소 약하기 때문에 시드의 일부 금액만 배팅 하는 식으로 전략을 구성 할 수도 있고, 만약 여러가지 시그널들이 충접적으로 뜬다면 신뢰도 높은 추세전환의 신호로 인식하여 배팅금액을 높이고 스탑로스를 높게 잡는 방향으로 전략을 구성 할 수 있습니다. 단순히 맹목적으로 시그널이 떳다고 매매하는것이 아닌 보조 신호로써의 기능, 이것이 내가 생각하는 인디케이터의 역할이자 본질 이라고 생각합니다.
RSI (상대 강도 지수)와 MACD, 스토캐스틱 RSI: 여러가지 지표들을 기반으로 추세 반전의 신호를 확인 할 수 있는 곰돌이와 송아지를 넣었습니다. RSI 가 과매도 구간에 도달한 이후일정 수치 이상 하락하는 동시에 MACD가 음수로 변하고 스토캐스틱 RSI가 골드, 데드 크로스가 된다면 곰돌이와 송아지 신호가 활성화 됩니다.
피봇 포인트: 특정 되돌아보기 기간 동안의 최고, 최저, 종가를 기반으로 계산됩니다. 이 포인트는 지지 및 저항 수준을 결정하는 데 사용됩니다. 피봇 포인트는 시장 심리와 잠재적 반전 영역을 평가하는 프레임워크를 제공합니다. 이렇게 계산된 값을 기반으로 눈송이와 해 신호가 활성화 됩니다.
오버히트 쿨다운 피봇: 는 과매수 또는 과매도 상태에서 거래량이 감소할 때 시장 피로 지점을 포착하여 잠재적 반전 지점을 신호합니다. 이러한 피로 지점을 식별함으로써 인디케이터는 트레이더가 시장의 전환점을 보다 효과적으로 예측할 수 있도록 돕습니다. 그렇게 추세 반전의 신호로 녹색 또는 붉은색 삼각형 시그널이 뜹니다. 과열된 시장이 냉각되는 포인트를 찾는점에서는 곰돌이 송아지 신호와 비슷하지만 거래량을 기반으로 하고 있기 때문에 명백히 다른 시그널이며 신뢰도는 약간 낮을 수도 있습니다
실용적 적용:
이 인디케이터를 사용함으로써, 트레이더는 신호의 신뢰도에 따라 베팅 크기를 전략적으로 조정할 수 있습니다. 여러 신호가 동시에 나타날 때, 이는 추세 반전의 가능성이 높음을 나타내며, 더 큰 포지션 크기를 허용합니다. 반대로, 신호가 독립적으로 발생할 때는 낮은 가능성을 나타내므로 작은 포지션 크기가 적합합니다. 이 접근 방식은 트레이더가 효과적으로 리스크를 관리하고 높은 확률의 거래 기회를 활용하면서 거래 빈도를 과도하게 줄이는 것을 방지할 수 있게 합니다.
매매방법:
기본적인 세팅은 비트코인 15분 타임프레임이며 제작자는 단타를 추천합니다. 포지션 진입시 시그널이 1개가 뜬다면 거래량과 지지와 저항라인을 확인하고 손익비를 계산후 낮은 배팅 비율로 포지션에 진입합니다. 만약에 3개의 시그널이 동시에 활성화 된다면 보다 높은 비율로 포지션에 진입합니다.
신뢰도 순서:
]🐻🐮 > ❄️☀️ > 🔻🔺(초록 삼각이모지가 없기때문에 이것으로 대체)
이 지표는 여러 잠재적인 시장 반전 및 추세 지속성을 감지하는 강력한 방법을 제공합니다.
참고: 현실적인 기대를 가지고 기술 분석 도구의 한계를 이해하십시오. 이 지표는 시장 움직임을 보장하는 예측이 아니라 거래 결정을 돕기 위한 도구입니다.
경고! 절대 이 지표만을 가지고 매매하지 마십쇼.
추가적으로 제작자는 지표 세팅에 허접이라 꼬우면 당신이 세팅하십쇼! 감사합니다!

Multi PivotsThis script is meant for day traders. It's based on the CPR concepts. The pivots plots based on the timeframe, means less that 15minuts it will plot daily pivots, less that daily tf, it plots weekly and then monthly. It also includes Camarillas, ADR levels, Fibonacci levels based on last 500 candles, Fib pivots, Pivot zones, developing pivot, Vwap, Dashboard shows RSI,ADX,Vwap,SuperTrend and day price difference. Options available to plot Day HighLow, Initial Balance levels as well. There is option to show running CPR which highlights virgin CPR. It can plot next day pivots as well
I dont own any of codes or ideas in the script. Codes are taken from different scripts and altered based on the requirements. Kudos to all the great pinecoders who provided their codes as public which helps everyone. Thanks

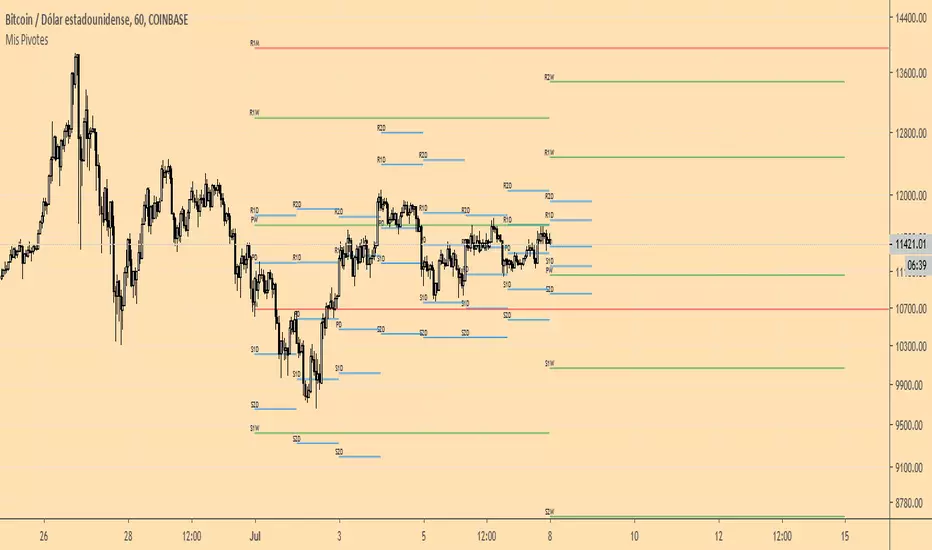
Mis PivotesPrimera prueba de ploteo de objetos line y label introducidos en PineScript v4.
Puntos Pivote tradicionales diario, semanal y mensual.
Daily Pivot Breakout Strategy IndicatorTagline:
A pivot-based breakout system that identifies confirmed daily breakouts with momentum and volume filters, with precise entry timing across all timeframes.
How It Works:
This indicator detects strict pivot high breakouts on daily data, filtered by Rate of Change (ROC ≥30%) and Relative Volume (RVOL >1). It displays both the breakout confirmation signal and the next-day entry signal directly on your chart, regardless of timeframe.
Visual Signals:
Orange Pivot Line: The most recent confirmed pivot high (within 250-day lookback)
Day-0 Label (Teal): Appears on the breakout confirmation day (when price closes above daily pivot with filters met)
Entry Banner (Green): Appears on the next trading day at market open - your actual entry point
Cross-Timeframe Consistency:
Daily Chart: View the big picture - Day-0 on breakout bar, Entry on next bar
Any Timeframe: Logic remains consistent to daily pivots and data, signals adapt to show at the correct time
Built-in Alert Conditions:
5PivotBreakout_Scan (Day-0): Fires when breakout is confirmed. Use this for after-hours scanning to build watchlists of confirmed breakouts
5PivotBreakout_Strategy (Next): Fires at market open the next day. Use this to automate entries on confirmed breakouts
Typical Workflow:
Set up Day-0 alerts on your watchlist to catch breakouts as they happen
Review confirmed breakouts each evening
Set up Entry alerts on selected tickers to automate next-day execution (fires at market open)
Optional: Convert to strategy() for backtesting with custom exits (20% trail is good)
Key Features:
Strict pivot detection: No ties allowed - center must be highest point
Momentum filter: 100-day ROC ensures trending strength
Volume confirmation: 20-day RVOL validates participation
No repainting: Uses lookahead_off for realistic, tradeable signals
Customizable Inputs:
Pivot strength parameters (left/right bars)
Pivot lookback period
ROC period and minimum threshold
RVOL period
Toggle visibility of pivot line and labels
Note: This indicator is for educational purposes only and does not constitute financial advice. Past performance does not guarantee future results. Always test thoroughly before live trading.

Auto-Trend Finder (Pivot + ADX)Inspired in part by LuxAlgo Trendlines with Breaks. Extended and enhanced for directional clarity and pivot-based precision.
🔍 What It Does
The Auto-Trend Finder (Pivot + ADX) is a smart trend-detection toolkit that combines:
Pivot-based swing detection (HH, HL, LH, LL)
ADX-filtered trendline projections
Custom slope estimation using ATR, Standard Deviation, Linear Regression, or a blended approach
Candlestick pattern detection for added confirmation (e.g., hammer, engulfing, shooting star)
📈 How It Works
1. Swing Detection
Uses ta.pivothigh / ta.pivotlow to mark major price turning points.
Labels pivots as Higher High (HH), Lower High (LH), Lower Low (LL), or Higher Low (HL).
Optionally overlays basic candle pattern names for visual context.
2. Trendline Logic
Connects successive pivot highs/lows with real-time trendlines.
Draws separate Uptrend and Downtrend lines with distinct colors.
3. Extended Projections
Projects extended dashed lines from the last pivot using slope formulas:
ATR-based (volatility)
Stdev-based (dispersion)
Linear Regression (trend best-fit)
Or a Combined slope using user-defined weights.
Color changes dynamically on breakout to visually signal momentum shifts.
4. ADX Trend Strength Filter
Optional ADX filter disables trendline updates unless directional strength exceeds a threshold (e.g. 20+).
Helps remove noise in sideways markets.
⚠️ Important Notes
Backpainting Warning: This script includes a backpainting setting (backpaint) that may cause lines to appear "reliably predictive" in historical data. Backpainting does not repaint once the pivot is confirmed, but it still reflects a post-fact state. Use this feature cautiously in live trading decisions.
Reused Code Attribution: Extended trendline concept and breakout color logic were inspired by publicly available open-source versions of LuxAlgo's trendline logic. Credit is given in the script comments and here as required.
🛠️ How to Use It
Adjust Pivot Length for swing detection sensitivity.
Toggle ADX filtering on or off to avoid choppy signals.
Choose your preferred Slope Calculation Method.
Use candlestick labels as potential entry signals near trendline retests or breaks.
✅ Why This Is More Than a Mashup
This tool integrates several separate technical methods into one cohesive, customizable framework:
It’s not just combining indicators, it’s engineering synergy between them.
The slope and ADX filtering mechanics dynamically adjust to trend strength.
Candlestick confirmation and labeling give visual, real-time trade confidence.
It enhances open-source logic by adding modular slope options, ADX gating, pattern labeling, and user control.
"Know the structure. Follow the strength. Trade with clarity. Auto-Trend Finder is your edge in the chaos."

Ely Waves PivotsThese pivot points are used to create an expected range based on open and closing candle data. It's a mixture of two different types of pivots and together they form an expected range for various time frames. You can set them up from as little as 4 hours to 1 month. My personal favorites are 4 hour, 1 day, 1 week, and 1 month.
The dashed lines create the pivot area for the time frame chosen, and the thick lines create the expected high and low for the chosen time frame.
These are very powerful if used correctly!
Hope you enjoy!

MI Pivot Points with mid-pivotsJust a standard daily pivot point indicator but I have added mid-pivots as they are critical to my intraday fx trading.
Posty PivotsIndicator plots anticipated support/resistance areas based on prior day price action and includes breakout/breakdown targets.
This work is an original interpretation of Camarilla Pivots as well as the techniques taught by Pivot Boss.
As with everything context along with price action is crucial when trading potential reversal zones.
This indicator is used for intraday trading.

Fibonacci Pivots Enhanced Levels (daily)Fibonacci pivot point levels
multiply the previous day’s range with its corresponding Fibonacci level.
Tradingview Standard Pivot Template includes S/R Levels 1 – 3 only .
I take into account additional Fibonacci pivot levels (S/R 4 – 7) on daily basis (no need for higher timeframes - weekly, monthly).

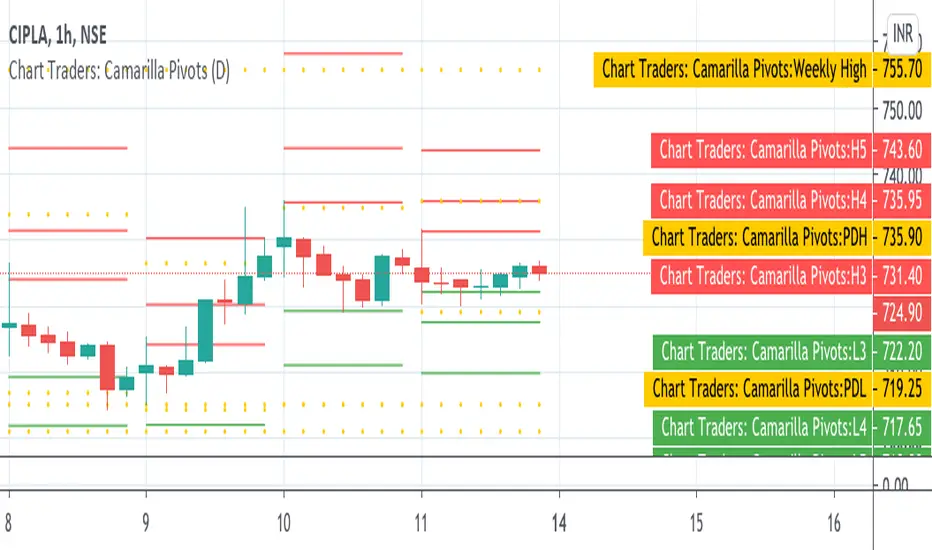
Chart Traders: Camarilla PivotsChart Traders: Camarilla Pivot point indicator gives you support and resistance level.
This indicator give (h1 to H5) five resistance level and (L1 to L5) support level. You can buy at any support level with reversal sign and sell at resistance with reversal sign.
In this indicator you can also see the next day Camarilla pivot points.