Strategy Myth-Busting #5 - POKI+GTREND+ADX - [MYN]This is part of a new series we are calling "Strategy Myth-Busting" where we take open public manual trading strategies and automate them. The goal is to not only validate the authenticity of the claims but to provide an automated version for traders who wish to trade autonomously.
Our fifth one we are automating is one of the strategies from "The Best 3 Buy And Sell Indicators on Tradingview + Confirmation Indicators ( The Golden Ones ))" from "Online Trading Signals (Scalping Channel)". No formal backtesting was done by them and resuructo messaged me asking if we could validate their claims.
Originally, we mimic verbatim the settings Online Trading Signals was using however weren't getting promising results. So before we stopped there we thought we might want to see if this could be improved on. So we adjusted the Renko Assignment modifier from ATR to Traditional and adjusted the value to be higher from 30 to 47. We also decided to try adding another signal confirmation to eliminate some of the ranged market conditions so we choose our favorite, ADX . Also, given we are using this on a higher time-frame we adjusted the G-Channel Trend detection source from close to OHLC4 to get better average price action indication and more accurate trend direction.
This strategy uses a combination of 2 open-source public indicators:
poki buy and sell Take profit and stop loss by RafaelZioni
G-Channel Trend Detection by jaggedsoft
Trading Rules
15m - 4h timeframe. We saw best results at the recommended 1 hour timeframe.
Long Entry:
When POKI triggers a buy signal
When G-Channel Trend Detection is in an upward trend (Green)
ADX Is above 25
Short Entry:
When POKI triggers a sell signal
When G-Channel Trend Detection is in an downward trend (red)
ADX Is above 25
If you know of or have a strategy you want to see myth-busted or just have an idea for one, please feel free to message me.
Cari dalam skrip untuk "renko"

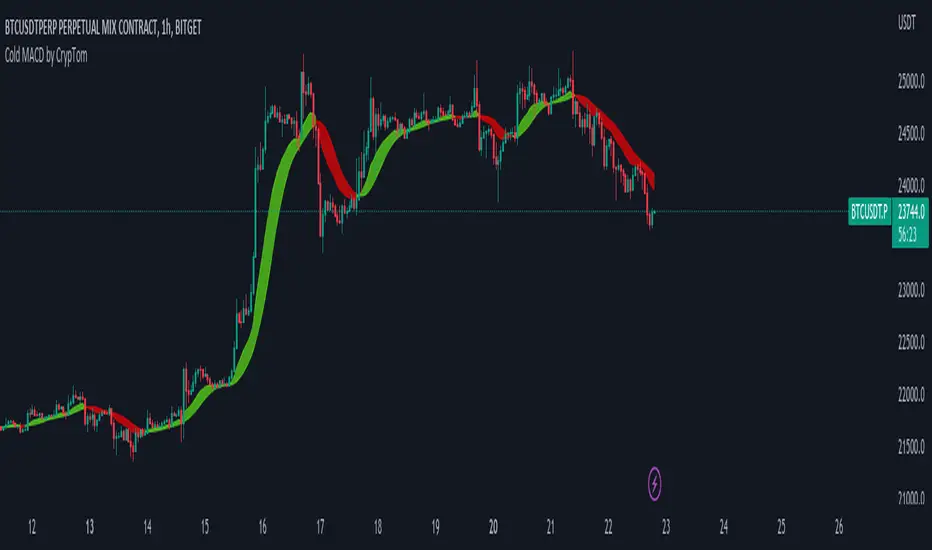
Cold MACD by CryptomPlots the MACD directly on Chart. This helps you better understand the MACD indicator and filter the false signals, It is recommended to use it with Macd oscillator
15M Chart:
3D Chart:
4H Chart:
30M Chart with Renko candle:
snapshot
End-Pointed SSA of Normalized Price Corridor [Loxx]End-Pointed SSA of Normalized Price Corridor is an end-pointed SSA of normalized input price to output a smoothed normalized oscillator of price. Corridors are added in attempt to decipher larger trend direction of price. These corridor trend lines are based on highs and lows of price. Due to the SSA algorithm, this indicator takes some time load on the chat, so be patient. You can adjust the lag parameter downward to speed up the indicator load time but this will also degrade the signal. There are many different ways to use this indicator. It is also Renko chart friendly.
An example of emerging trends (these do not repaint)
What is Singular Spectrum Analysis ( SSA )?
Singular spectrum analysis ( SSA ) is a technique of time series analysis and forecasting. It combines elements of classical time series analysis, multivariate statistics, multivariate geometry, dynamical systems and signal processing. SSA aims at decomposing the original series into a sum of a small number of interpretable components such as a slowly varying trend, oscillatory components and a ‘structureless’ noise. It is based on the singular value decomposition ( SVD ) of a specific matrix constructed upon the time series. Neither a parametric model nor stationarity-type conditions have to be assumed for the time series. This makes SSA a model-free method and hence enables SSA to have a very wide range of applicability.
For our purposes here, we are only concerned with the "Caterpillar" SSA . This methodology was developed in the former Soviet Union independently (the ‘iron curtain effect’) of the mainstream SSA . The main difference between the main-stream SSA and the "Caterpillar" SSA is not in the algorithmic details but rather in the assumptions and in the emphasis in the study of SSA properties. To apply the mainstream SSA , one often needs to assume some kind of stationarity of the time series and think in terms of the "signal plus noise" model (where the noise is often assumed to be ‘red’). In the "Caterpillar" SSA , the main methodological stress is on separability (of one component of the series from another one) and neither the assumption of stationarity nor the model in the form "signal plus noise" are required.
"Caterpillar" SSA
The basic "Caterpillar" SSA algorithm for analyzing one-dimensional time series consists of:
Transformation of the one-dimensional time series to the trajectory matrix by means of a delay procedure (this gives the name to the whole technique);
Singular Value Decomposition of the trajectory matrix;
Reconstruction of the original time series based on a number of selected eigenvectors.
This decomposition initializes forecasting procedures for both the original time series and its components. The method can be naturally extended to multidimensional time series and to image processing.
The method is a powerful and useful tool of time series analysis in meteorology, hydrology, geophysics, climatology and, according to our experience, in economics, biology, physics, medicine and other sciences; that is, where short and long, one-dimensional and multidimensional, stationary and non-stationary, almost deterministic and noisy time series are to be analyzed.
Included
Bar coloring
Signals
Alerts
Loxx's Expanded Source Types

Tallrye AlertsThis is just a script to see the usage of volume from another source, i.e. US100 while using alerts in Renko chartview.
Chervolinos_Rob Hoffman_Inventory Retracement Bar_and_OverlayHere is something like a combo from the well known Rob Hoffman (Overlay) Indicator and the Inventory Retracement Bar without any ballast
This really smart strategy with a low risk and a quick profit. I combine this two Indicators to save space.
The first condition is that the orange line and the lime line must be parallel and there is no other line between them because this condition is moving under 45 angle.
The second condition is that the target candles must be below the orange line in the case of the downtrend as we see.
As we see it here in the case of an uptrend should be candles above the orange line and this is logical as we see here.
Sometimes we noticed the appearance of the signal onto the candle but the conditions were not applicable because there is an orange line between the green line and the orange line and this means that the signal is fake.
This candle is also good for entry and we can place a buy order above it but is it beginner, so you must respect the conditions in order to be able to master it very well.
Enter with Confidence all conditions are present a red arrow above the candle and the candle is above the orange line and there are no lines between the lime and
orange line. Yes this is our target the entry-point will be a little above the wicked the candle, that is you will not buy now but it's a price exceeds the weight limit
even slightly, we will buy directly it is hoffman's method. Expected if the price in which resistance occurred which is the resistance represented
by the candlewick will be broken the price for rise up and strongly and if it does not happen you will not lose anything anyway to stop loss and take profit. Try the ratio by 1,5.
This part of this strategy is one of the best trading strategies with a low risk rate and can be used as an initial guide to know the market movement and to enter successful trades.
Let's start correctly. This strategy can be used on any time frame from one minute to one day or even more, but I recommend using it on a 10-minute frame one hour or 30 minutes frame. Here I use the 30-Minute frame.
This strategy is based on two things: Tramp Direction and the inventory retracement bar. Don't worry and don't think about it because all this will be automatic but let's understand some simple terms.
There many arrows in green and red. Please read the discription above.
Please read the following tipps:
To avoid the trend Reversal, try to add one one of the Divergence indicators to your chart.
To avoid entering in a pullback movement as much as possible.
--> Combine it with other indicators <--
Best Regards Chervolino
if there were any typographical errors, please forgive me
Note: Buy/Sell signals using non-standard chart types (Heikin Ashi, Renko, Kagi, Point & Figure, and Range) are not allowed, as they produce unrealistic results

[blackcat] L2 SVE Volatility BandsLevel 2
Background
Sylvain Vervoort’s articles in the July issues on 2018,“The V-Trade, Part 5: Technical Analysis—Moving Average Support & Resistance And Volatility Bands”
Function
In “The V-Trade, Part 5: Technical Analysis—Moving Average Support & Resistance And Volatility Bands” in the July 2018 STOCKS & COMMODITIES, author Sylvain Vervoort introduced a new type of price band that he calls the SVEVolatilityBand. He created this new type of band to better highlight volatility changes when using non-time-related charts. According to the author, when using charts such as renko, traditional bands may fail to effectively highlight these changes.
Remarks
Feedbacks are appreciated.

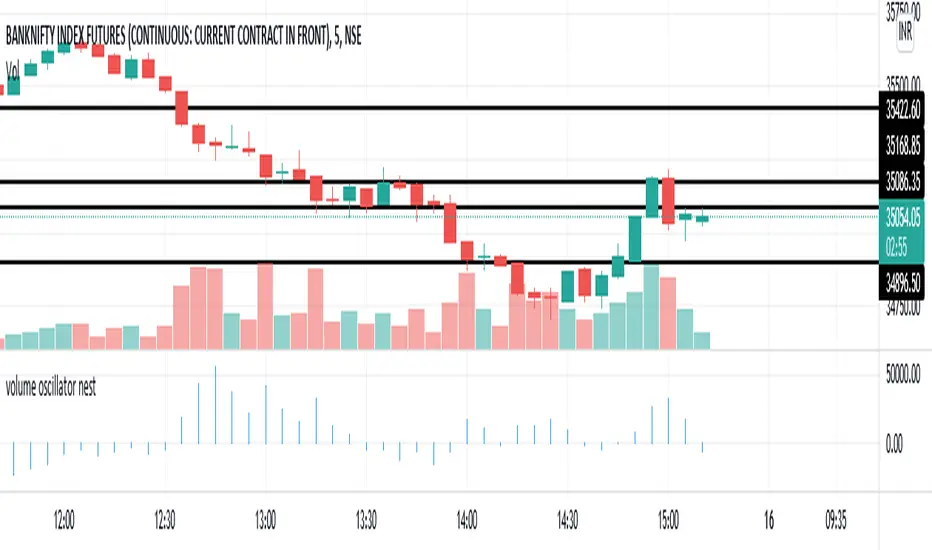
volume oscillator nestPrice encountered resistance at Point A where it had earlier witnessed support. Later, it also witnessed resistance at points B and C, where earlier there had been demand — the previous support acting as resistance as per the principle of polarity. Renko brick reversal formations can help us in seeking confirmation and trading them.
Smoothed Heiken Ashi - SamXThis is my version of the Smoothed Heiken Ashi indicator. While there are a few versions of these out there (most notably "Modified Smoothed Heiken Ashi" by badshah_e_alam and "Smoothed Heiken Ashi Candles v1" by jackvmk), none matched what I was looking for.
1. All had hard-coded the smoothing to use the EMA calculation - in this indicator, these are user-configurable
2. Both applied the double-smoothing principle (Take a moving-average of price, apply the Heiken Ashi conversion, then apply a second moving average to the smoothed Heiken Ashi candles to calculate new candles). While this is the most common approach, I had a few issues with this:
Even if setting both moving average lengths to 1, the indicator did not correctly calculate what should be the actual corresponding Heiken Ashi candle values (as compared to the built-in Heiken Ashi chart on Tradingview)
They were inconsistent in operating on different chart types - indicator values for the same candle can differ between using a base Heiken Ashi or Renko chart vs a standard Candle or Bar chart.
I wanted the ability to easily enable/disable the second smoothing (which is now a configuration option)
I wanted the ability to configure different moving-average calculations for each smoothing iteration (e.g. EMA for the initial smoothing, and Smoothed Moving Average for the second smoothing)
3. Many of the inputs were not clearly or properly defined in the settings window - this script has far more refined user input settings, put in logical groupings, and with relevant help text.
4. Enhanced some visual styling (and added to the Settings) to make it easier for the user to enable/disable printing candle wicks, as well as customizing the bullish / bearish bar colors
5. Added alerts for bar color change to help users catch potential trend reversals
Reference paper on the original Smoothed HA formulas: www.researchgate.net
Reference on the more common implementation formulas (using double-smoothing): www.sierrachart.com
Smoothed Waddah ATR~~~All Credit to LAZY BEAR for posting the original Script which is an old MT4 indicator.~~~~
No this system does not repaint... if it does let me know. Either the code is wrong or you are using a repainting chart such as renko candles.
*PURPOSE*
This Is an "Enhanced or Smoothed" version of the script that captures the heiken-ashi closing price as its main calculation variable. While using normal bar or line charts. Enhancements integrate trade filters to reduce false signals.
*WHAT TYPE OF TRADING STRATEGY IS THIS?*
This is a Long Only, Trend Trading System. Is intended to be applied to Charts/Timeframes that produce sustainable trends for which ever asset you are trading.
*NOTE OF ADVICE REGARDING SETTINGS*
Settings can be tweaked but I have found that best results come with the given settings. If a chart is too choppy to trade this indicator successfully, it is advised not to change the settings but either find a different timeframe or different asset to apply this strategy to.
TLDR
Indicator measures the change of the MacD (difference between MAC D of given EMA's) and compares it to the difference between the Upper and Lower Bollinger bands. Green bar over trigger line= entry. Red bar over trigger line = close.
*SETTINGS AND INPUTS*
-MacD of HeikenAshi chart (will always be of the Heikenashi chart even when applied to different chart type)
sensitivity = input(150, title='Sensitivity') =range should be (125-175)multiplier so that MacD can be compared to BB
fastLength = input(20, title='MacD FastEMA Length')
slowLength = input(40, title='MacD SlowEMA Length')
-Bollinger Band of currently used price chart type
channelLength = input(20, title='BB Channel Length')
mult = input(1.5, title='BB Stdev Multiplier')
-14 Period RSI Trade Filter (set to 0 to Disable)
RSI14filter = input(40, title='RSI Value trade filter') =only gives entry when RSI is higher than given value
*ABSTRACT & CONCEPT*
TLDR - Indicator measures the change of the MacD (difference between MAC D of given EMA's) and compares it to the difference between the Upper and Lower Bollinger bands. Green bar over trigger line= entry. Red bar over trigger line = close.
Indicator plots -
Bars are the change in the MAC D and the indicator line is the difference in the BB.
When Bars are higher than the indicator line then it is considered a trend "Explosion"
Green Bars are Trend Explosion to the upside, Red Bars are Trend explosion to the downside.
GENERAL DETAIL-
the core calculation is measuring the change in MacD of current candle compared to the MacD of two previous candles.
This value is multiplied by the sensitivy so it can be compared to the change in Bollinger Band Width.
if the MACD change is positive then you get a green/lime bar for that value. If the MacDchange is negative you get a red/orange bar for that value.
and are determined by whether the actual change is increasing in that direction or decreasing. (bars getting taller or bars getting shorter)
Entry signal for long is A positive change in MACD difference (Green bar) that is greater than the change of the bollinger band (orange signal line) AND if the RSI value is above your filter.
Close signal or Trend Stop Warning Signal is given when a Negative MacD Difference (red bar) is greater than the change of the bollinger band (orange Line)
*CONSIDERATIONS AND THOUGHTS*
I have over 150 iterations of this indicator and this is the most consistent and best version of settings and filters I was able to generate. I built this indicator specifically for 3 charts. SPY monthly, QQQ monthly, BTC 3 Day. However this indicator works well on any long term bullish chart. (tech stocks are great) .
Trend trading systems are intended to be homerun hitting, plunge protecting indicators that allow for long legs and expanding volatility. This indicator does this as the trigger line is Dynamic with the expansion and contraction of the bollinger band.
I do not take every signal specifically not the close signals. Instead they more like warnings in ultra bullish environments.
If i had to pair this indicator with any other filter than the RSI, it would be a long term moving average i.e. the 50 week or equivalent for your chart. signals above rising moving averages means that you are trading with an upward trending market.
Hope this helps. Happy trades.
-SnarkyPuppy

st_renkoThe indicator has two parameters: the period and the number of splits. For the selected period, the maximum and minimum are calculated, and the scope of the market is determined by the difference between the maximum and minimum. The scope is divided by the number of partitions, thereby determining the step of the levels. If the average price (ohlc4) falls within the range between levels, this range is drawn. A simpler analogy: we have a local minimum. and the local maximum for the selected period, we build a ladder between them, the number of steps of which is equal to the number of splits, and if the price is on some step of this ladder, then this step is drawn, so we can see how many steps separate us from the maximum and minimum.

[JL] ATR LabelsJust need to see ATR values when I made Renko script. So I make this script.
I like number 5 so I use 5 to timeframe.
Calculate ATR for the following:
- Monthly
- Weekly
- Daily
- 5-Hour
- 1-Hour
- 12-Min
Label default displayed on right side and middle of 50 bars.

Volume BricksVolume Bricks - As if a Renko made new bricks on volume.
Set a percentage of the previous day's volume and this will post new levels when accumulated volume meets that percentage.
It will also plot shapes (and labels for recent bars) when price movement is accompanied by more than one times the volume level specified.

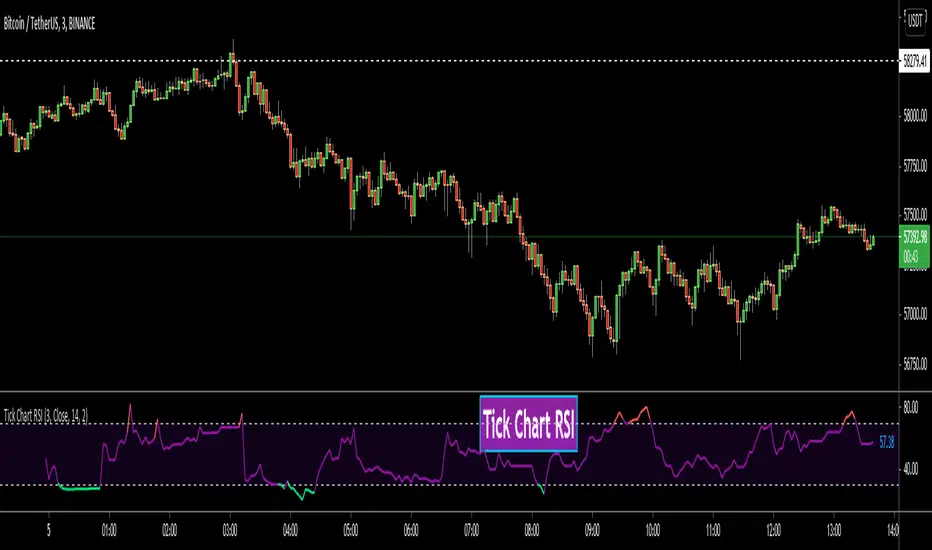
Tick Chart RSIHello All,
This is Tick Chart RSI script and it calculates & shows RSI for Tick Chart. What is Tick chart? Tick Chart is created using ticks and each candlestick in Tick Chart shows the price variation of X consecutive ticks (X : Number of Ticks Per Candle). For example if you set "Number of Ticks Per Candle" = 100 then each candlestick is created using 100 ticks. so, Tick Charts are NOT time-based charts (like Renko or Point & Figure Charts). Tick is the price change in minimum time interval defined in the platform. There are several advantages of Tick Charts. You can find many articles about Tick Charts on the net.
Tick Chart and Tick Chart RSI only work on realtime bars.
You can set " Number of Ticks Per Candle " and the colors. You can also set any of the candles OHLC values as source for RSI.
While using Tick Chart RSI I recommend you to add Tick Chart as well.
P.S. Tick Chart RSI script can be developed using different methods. in this script, all RSI values are calculated on each tick because RSI is calculated for only real-time bars, and also calculated for limited number of bars
Tick Chart and Tick Chart RSI:
Tick Chart RSI:
Enjoy!
Tick ChartHello All,
Tick Chart is created using ticks and each candlestick in Tick Chart shows the price variation of X consecutive ticks ( X : Number of Ticks Per Candle ). for example if you set Number of Ticks Per Candle = 100 then each candlestick is created using 100 ticks. so, Tick Charts are NOT time-based charts (like Renko or Point & Figure Charts). Tick is the price change in minimum time interval defined in the platform. There are several advantages of Tick Charts. You can find many articles about Tick Charts on the net.
Tick Chart only works on realtime bars.
You can set " Number of Ticks Per Candle " and " Number of Candles" using options. You can change color of body, wicks abd volume bars as well.
The script shows current, minimum, maximum and average volumes. it also shows OHLC values on the last candle.
Tick Chart using different number of ticks
Volume info:
Enjoy!

ITG ScalperITG Scalper by Complector.
Inspired by Juboal-Rabaroansa Perosteck Alseyn Balveda dam T'seif
Methology:
- I am using a TEMA (triple EMA) to determine the local trend direction and to give buy & sell signals when the trend changes.
- An optional filter, using moving average convergence divergence (MACD), can be switched on to filter out 'false' signals.
- The calculation of the TEMA does not request data from a resolution higher or lower than the resolution of the main charts symbol,
However, the filter function does, if another resolution is chosen for the filter.
- Persistent variables are used for buy and sell prices, enabling color-coding of the sell-signal (profitable or not).
Features:
- Color coded TEMA - bullish=green , bearish=red
- Buy/Sell indicator - Sell indicator: green=profit, yellow=loss
- Optional noise filter
- Optional variable time-frame for noise filter
Remarks:
In my experience, the default values works best on the daily time frame. I encourage everyone to experiment with the values for best results.
Using the script on non-standard charts (Heikin Ashi, Renko etc.) can produce unrealistic results.
Using a resolution higher or lower than the main charts symbol for the filter can possibly lead to repainting.
Thanks to Iain M. Banks for making my life richer :-)
Trendy Bar Trend Color LiteLite version of the original Trendy Bar Trend Color
This will only color the candlestick body of your chart
Can be used with solid, hollow, renko, or any other chart type
Custom coloring for Highs, Lows, and consolidation is removed

Up/Down Trend MarkerA simple indicator of trend by using 3 EMAs of multiplies of 2, 5 and 10, filtered by standard positive/negative directional movements (DM) which are the base of Average Directional Index (ADX).
The "Trend Strength" option is included to set the EMA multipliers and also the variation between DM+ and DM- which interpret the trend as a weak or a strong one.
Note that the markers only point to almost the beginning of the trends and just change the direction when the opposite trend is detected.
Feel free to send me your opinions.

Ichimoku Cloud - AlertsIchimoku cloud
IC is a trend - following system with an indicator similar to moving averages
It predicts price movements
Offers a unique perspective of support and resistance levels.
Conversion Line (Turning Line)
- Measures Short Term Trend
- SIgnals an area of minor support and resistance
Base Line (Confirmation Line)
Measures Medium term trend
Used as Trailing Stop Level.
Lagging Span (Lagging Line)
Used for Confirmation of signals
Can also serve as Support and Resistance Level
Kumo Cloud
Formed of two lines: Span A (Green Line) and Span B (Red Line)
Dynamic Support and Resistance .
HOW TO READ ICHIMOKU INDICATOR
Conversion Line
If the Market Price is above the Conversion Line = Short Term Upward Movement
If the Market Price is below the Conversion Line = Short Term Downward Movement
Increasing Conversion Line = Upward Short Term Trend
Decreasing Conversion Line = Downward Short Term Trend
Base Line
If the Market Price is above the baseline = Medium - term upward trend
If the Market price is below the baseline = Medium - Term downward Trend
Increasing Base Line = Upward Medium term trend
Decreasing Base Line = Downward Medium Term Trend
Lagging Span
The Evolution of the current price action in relation to previous price action
If the Lagging span is above the current price = Bullish Bias
If the Lagging span is below the current price = Bearish Bias
Lagging span near the current price = Trading range
Kumo Cloud
Dynamic Support and Resistance based upon price action.
The longer the price stays below/above the Kumo cloud, the STRONGER the trend is.
When the cloud is wide, the expected support or resistance is strong
When the cloud is thin, the expected support or resistance is weak
Never trade inside the KUMO CLOUD.
HOW TO TRADE WITH ICHIMOKU CLOUD
Baseline and conversion Line crossover (Lagging Span as a Filter)
crossover(conversion line, baseline) = Buy
crossunder(conversion line, baseline) = Sell
FILTER
crossover(conversion line, baseline) and lagging span is Bullish (i.e above the price) = Buy
Crossunder(conversion line, baseline) and lagging span is Bearish (i.e below the price) = Sell
2. Baseline - Conversion line crossover (Kumo cloud Filter)
crossover(conversion line, baseline) above the Kumo Cloud = Strong Buy
crossover(conversion line, baseline) below the Kumo cloud = Weak Buy
crossunder(conversion line, baseline) below the Kumo Cloud = Strong Sell
crossunder(conversion line, baseline) above the Kumo Cloud = Weak Sell
3. Kumo Cloud Breakout
When the price enters the Kumo Cloud, and breaks its Upper wall upward = Bullish Signal
When the price enters the Kumo Cloud, and breaks its Lower wall downward = Bearish Signal
4. Kumo Cloud Crossover
When Span A cuts the Span B from below to the upside and prices are positioned above the Kumo Cloud = Strong Buy Signal
When Span A cuts the Span B from upside to the bottom and the prices are positioned below the Kumo Cloud = Strong Sell
When Span A cuts Span B from bottom to the upside and prices are positioned below the Kumo Cloud = Weak Buy Signal
When Span A cuts Span B from the upside to the bottom and the prices are positioned above the Kumo Cloud = Weak Sell Signal.
NOTE:- Some of the signals collide with each other, but they collide for the same call, so shouldn't really be a problem overall. Let me know if you have any suggestions to nullify the trading Range. Though I do plan on adding my Renko code to it for filtering out Trading Range.

Trend Risk Indicator (TRI)The Trend Risk Indicator is a simple bands indicator made of 2 custom averages of candlesticks ranges calculated within the variable “ BandBars ” period.
Upper and lower channel bands width can be adjusted with the “ Deviation ” variable, which act as a simple factor to enlarge the spread between them.
When Close crosses over the upper band, it is a bearish signal and candlesticks are painted in Red.
When Close crosses under the lower band, it’s a bullish signal and candlesticks are painted in Green.
One of the most interesting indicators for 1 minute scalping. Recommended to use on Renko bars.
*drag to chart and pin to scale, also remove borders from candlesticks.

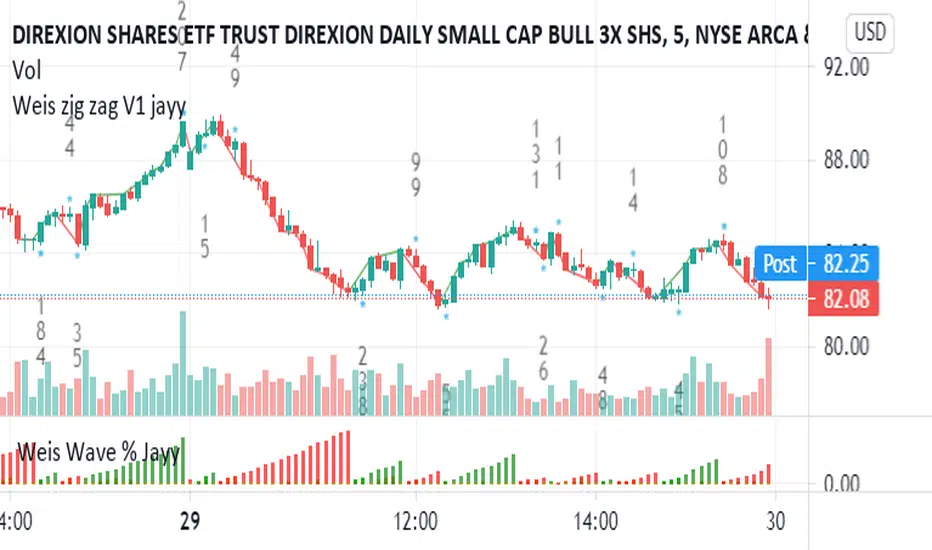
Weis pip zigzag jayyWhat you see here is the Weis pip zigzag wave plotted directly on the price chart. This script is the companion to the Weis pip wave ( ) which is plotted in the lower panel of the displayed chart and can be used as an alternate way of plotting the same results. The Weis pip zigzag wave shows how far in terms of price a Weis wave has traveled through the duration of a Weis wave. The Weis pip zigzag wave is used in combination with the Weis cumulative volume wave. The two waves must be set to the same "wave size".
To use this script you must set the wave size. Using the traditional Weis method simply enter the desired wave size in the box "Select Weis Wave Size" In this example, it is set to 5. Each wave for each security and each timeframe requires its own wave size. Although not the traditional method a more automatic way to set wave size would be to use ATR. This is not the true Weis method but it does give you similar waves and, importantly, without the hassle described above. Once the Weis wave size is set then the pip wave will be shown.
I have put a pip zigzag of a 5 point Weis wave on the bar chart - that is a different script. I have added it to allow your eye to see what a Weis wave looks like. You will notice that the wave is not in straight lines connecting wave tops to bottoms this is a function of the limitations of Pinescript version 1. This script would need to be in version 4 to allow straight lines. There are too many calculations within this script to allow conversion to Pinescript version 4 or even Version 3. I am in the process of rewriting this script to reduce the number of calculations and streamline the algorithm.
The numbers plotted on the chart are calculated to be relative numbers. The script is limited to showing only three numbers vertically. Only the highest three values of a number are shown. For example, if the highest recent pip value is 12,345 only the first 3 numerals would be displayed ie 123. But suppose there is a recent value of 691. It would not be helpful to display 691 if the other wave size is shown as 123. To give the appropriate relative value the script will show a value of 7 instead of 691. This informs you of the relative magnitude of the values. This is done automatically within the script. There is likely no need to manually override the automatically calculated value. I will create a video that demonstrates the manual override method.
What is a Weis wave? David Weis has been recognized as a Wyckoff method analyst he has written two books one of which, Trades About to Happen, describes the evolution of the now popular Weis wave. The method employed by Weis is to identify waves of price action and to compare the strength of the waves on characteristics of wave strength. Chief among the characteristics of strength is the cumulative volume of the wave. There are other markers that Weis uses as well for example how the actual price difference between the start of the Weis wave from start to finish. Weis also uses time, particularly when using a Renko chart. Weis specifically uses candle or bar closes to define all wave action ie a line chart.
David Weis did a futures io video which is a popular source of information about his method.
This is the identical script with the identical settings but without the offending links. If you want to see the pip Weis method in practice then search Weis pip wave. If you want to see Weis chart in pdf then message me and I will give a link or the Weis pdf. Why would you want to see the Weis chart for May 27, 2020? Merely to confirm the veracity of my algorithm. You could compare my Weis chart here () from the same period to the David Weis chart from May 27. Both waves are for the ES!1 4 hour chart and both for a wave size of 5.
Weis Pip Wave jayyWhat you see here is the Weis pip wave. The Weis pip wave shows how far in price a Weis wave has traveled through the duration of a Weis wave. The Weis pip wave is used in combination with the Weis cumulative volume wave. The two waves must be set to the same "wave size" and using the same method as described by Weis.
Using the traditional Weis method simply enter the desired wave size in the box "Select Weis Wave Size". In the example shown, it is set to 5 points. Each wave for each security and each timeframe requires its own wave size. Although not the traditional method a more automatic way to set wave size would be to use ATR. This is not the true Weis method but it does give you similar waves and, importantly, without the hassle of selecting a wave size for every chart. Once the Weis wave size is set then the pip wave will be shown.
I have put a zigzag of a 5 point Weis wave on the above bar chart. I have added it to allow your eye to get a better appreciation for Weis wave pivot points. You will notice that the wave is not in straight lines connecting wave tops to bottoms this is a function of the limitations of Pinescript version 1. This script would need to be in version 4 to allow straight lines. I will elaborate on the Weis pip zigzag script.
What is a Weis wave? David Weis has been recognized as a Wyckoff method analyst he has written two books one of which, Trades About to Happen, describes the evolution of the now popular Weis wave. The method employed by Weis is to identify waves of price action and to compare the strength of the waves on characteristics of wave strength. Chief among the characteristics of strength is the cumulative volume of the wave. There are other markers that Weis uses as well for example how the actual price difference between the start of the Weis wave from start to finish. Weis also uses time, particularly when using a Renko chart. Weis specifically uses candle/bar closes to define all wave action.
David Weis did a futures.io video which is a popular source of information about his method.
Cheers jayy
PS This script was published a day ago, however, I had included some links to the website of a person that uses Weis pip waves and also a dropbox link that contains the Weis wave chart for May 27, 2020, published by David Weis. Providing those links is against TV policy and so the script was hidden by TV. This is the identical script with the identical settings but without the offending links. If you want to see the pip Weis method in practice then search Weis pip wave. I have absolutely no affiliation. If you want to see Weis chart in pdf then message me and I will give a link or the Weis pdf. Why would you want to see the Weis chart for May 27, 2020? Merely to confirm the veracity of my algorithm. You could compare my chart () from the same period to the Weis chart. Both waves are for the ES!1 4 hour chart and both for a wave size of 5.

TA Basics: further "Steps" with our Moving AverageSo far in this series of posts, we have worked thru creating a basic zero-lag moving average, then moved forward all the way to coding a "Fibonacci" Weighted Moving Average.
in this post we take a look at a technique that can help traders minimize noise in the underlying data and get better insight on the changes that are happening in the data series represented by the moving average. we'll look at adding "stepping" to our Fibonacci Moving Average as an example. we introduce the Stepping Fibonacci Moving Average , or Step_FiMA
note that you can use the same technique with any plot you may have. feel free to copy or leverage the relevant parts of the script - the script is commented to make this easier.
How is this useful?
==================
with "stepping", you get your indicator to "round" the outcome into pre-specified bands or ranges. this works very similar to how, for example, range or Renko charts work. you can easily see the difference in the chart above once we look at a non-stepped and a stepping moving average of the same length side-by-side
the more granular your timeframe is, you will see the effect of the stepping clearer - here's how the same chart looks when we go into the 1-hr aggregation
Notes about this script
====================
there are couple of pieces i wanted to highlight in the script if you plan to use some of it :
1 - the step(x) function is meant to try to automatically pick the best "suitable" step size based on the range of the underlying series (for example, the closing price). these ranges i included here in the code are just my own "best choices" - you are totally welcome to adjust these ranges and the resulting step size to your own preference
2 - we applied the stepping as a user-choice. user can choose a manual entry, or "0" to get the code to automatically pick the step size, or enter -1 (or actually any value below zero) to cancel the stepping option altogether - this gives us some flexibility on how to use the stepping in an indicator
3 - very important (and somehow confusing): on the "rounding" approach:
the magic math formula that actually creates the stepping is this one
result = round(input / step) * step
now, this tells the script to "round" the result up or down (the basic rounding) -- so for example, a price of 17 with a step of 5 would be rounded (down) to 15, where as a price of 18 would be rounded "up" to 20 -- this is not the way some of us would expect or want, cause the price never reached 20 and they would want an 18 to still be rounded to 15 - and the stepping line not to show 20 *until* the price actually hits or exceeds 20 -- in that case, you would need to replace the function "round" with the function "floor" --
so the new formula becomes: floor(input / step) * step
-- in an ideal world, we can make this rounding choice a user-option in the settings -- maybe in an improved version
4 - we kept the smoothing option, and it takes place before the stepping is applied - we continue to use that smoothing to further minimize the level changes in the FiMA line.
I hope you find this script useful in your journey with technical analysis and DIY scripting, and good luck in your trading.

Hakimi - Ichi Based Pivot Time Prediction - V.2This indicator is based on multitime ichimoku and can be used to predict some of pivots .
How to use:
1- Select the arbitrary chart (Candles, Heikin Ashi, Line and Renko) and time frame.
2. Set the “Offset” value. Default value is -1.
3. Set the “Time Coefficient 1” to “Time Coefficient 4”. Default values are 2, 3, 4 and 5.
