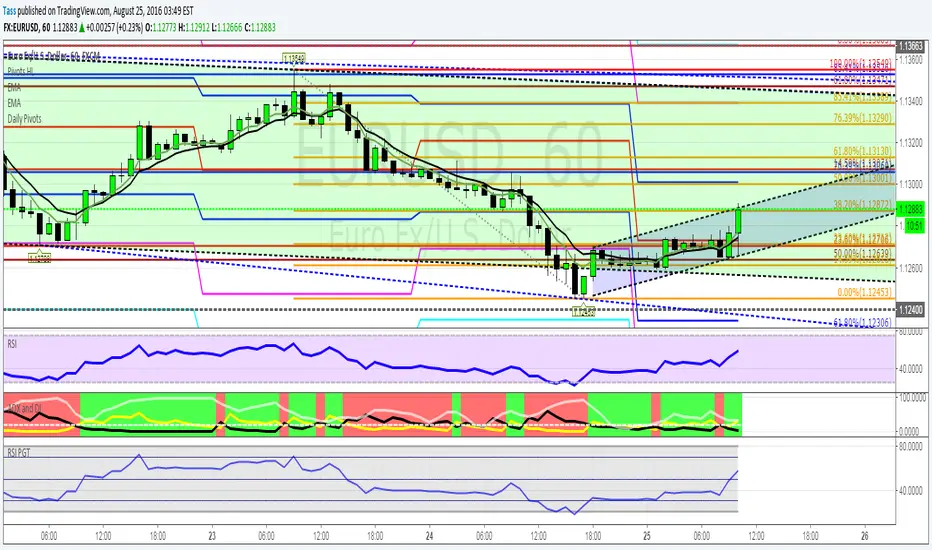
RSI TrendRSI Hull Trend is a hybrid indicator with RSI of HULL Signal. The Hull MA is combined with RSI to see if the Hull MA Buy/Sell Signal is in overbought or oversold condition. Buy Sell Signals are plotted based on settings of OB/OS or RSI. This indicator is very useful to see if the Trend is in Exhaustion or Beginning of a Trend. Entry and Exit conditions can be more precise based on OB/OS condition of price action. In addition normal RSI trend is plotted with trend color from Hull MA. Best Performance with Heiken Ashi Candles.
OB/OS Settings provided
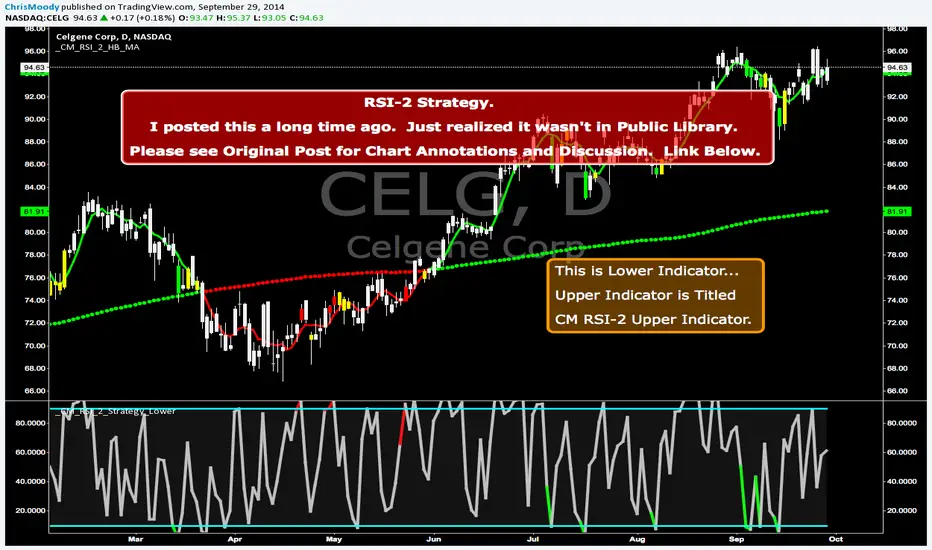
Hull Buy/Sell Signals plotted
Double RSI FAST and DEFAULT signal with crossover
Bar Color applied based on Hull RSI Trend
Hull Trend + RSI + Price Action
Cari dalam skrip untuk "rsi"
RSI+SMA AL SATrsi ve sma'nın kesiştiği dönemlerde yükseliş ve düşüş dalgalarını bulmaya yarıyan indikator
En ideal kullanım 8e 8 değerleri
RSI Full [Titans_Invest]RSI Full
One of the most complete RSI indicators on the market.
While maintaining the classic RSI foundation, our indicator integrates multiple entry conditions to generate more accurate buy and sell signals.
All conditions are fully configurable, allowing complete customization to fit your trading strategy.
⯁ WHAT IS THE RSI❓
The Relative Strength Index (RSI) is a technical analysis indicator developed by J. Welles Wilder. It measures the magnitude of recent price movements to evaluate overbought or oversold conditions in a market. The RSI is an oscillator that ranges from 0 to 100 and is commonly used to identify potential reversal points, as well as the strength of a trend.
⯁ HOW TO USE THE RSI❓
The RSI is calculated based on average gains and losses over a specified period (usually 14 periods). It is plotted on a scale from 0 to 100 and includes three main zones:
Overbought: When the RSI is above 70, indicating that the asset may be overbought.
Oversold: When the RSI is below 30, indicating that the asset may be oversold.
Neutral Zone: Between 30 and 70, where there is no clear signal of overbought or oversold conditions.
⯁ ENTRY CONDITIONS
The conditions below are fully flexible and allow for complete customization of the signal.
______________________________________________________
🔹 CONDITIONS TO BUY 📈
______________________________________________________
• Signal Validity: The signal will remain valid for X bars .
• Signal Sequence: Configurable as AND/OR .
📈 RSI Conditions:
🔹 RSI > Upper
🔹 RSI < Upper
🔹 RSI > Lower
🔹 RSI < Lower
🔹 RSI > Middle
🔹 RSI < Middle
🔹 RSI > MA
🔹 RSI < MA
📈 MA Conditions:
🔹 MA > Upper
🔹 MA < Upper
🔹 MA > Lower
🔹 MA < Lower
📈 Crossovers:
🔹 RSI (Crossover) Upper
🔹 RSI (Crossunder) Upper
🔹 RSI (Crossover) Lower
🔹 RSI (Crossunder) Lower
🔹 RSI (Crossover) Middle
🔹 RSI (Crossunder) Middle
🔹 RSI (Crossover) MA
🔹 RSI (Crossunder) MA
🔹 MA (Crossover) Upper
🔹 MA (Crossunder) Upper
🔹 MA (Crossover) Lower
🔹 MA (Crossunder) Lower
📈 RSI Divergences:
🔹 RSI Divergence Bull
🔹 RSI Divergence Bear
______________________________________________________
______________________________________________________
🔸 CONDITIONS TO SELL 📉
______________________________________________________
• Signal Validity: The signal will remain valid for X bars .
• Signal Sequence: Configurable as AND/OR .
📉 RSI Conditions:
🔸 RSI > Upper
🔸 RSI < Upper
🔸 RSI > Lower
🔸 RSI < Lower
🔸 RSI > Middle
🔸 RSI < Middle
🔸 RSI > MA
🔸 RSI < MA
📉 MA Conditions:
🔸 MA > Upper
🔸 MA < Upper
🔸 MA > Lower
🔸 MA < Lower
📉 Crossovers:
🔸 RSI (Crossover) Upper
🔸 RSI (Crossunder) Upper
🔸 RSI (Crossover) Lower
🔸 RSI (Crossunder) Lower
🔸 RSI (Crossover) Middle
🔸 RSI (Crossunder) Middle
🔸 RSI (Crossover) MA
🔸 RSI (Crossunder) MA
🔸 MA (Crossover) Upper
🔸 MA (Crossunder) Upper
🔸 MA (Crossover) Lower
🔸 MA (Crossunder) Lower
📉 RSI Divergences:
🔸 RSI Divergence Bull
🔸 RSI Divergence Bear
______________________________________________________
______________________________________________________
🤖 AUTOMATION 🤖
• You can automate the BUY and SELL signals of this indicator.
______________________________________________________
______________________________________________________
⯁ UNIQUE FEATURES
______________________________________________________
Signal Validity: The signal will remain valid for X bars
Signal Sequence: Configurable as AND/OR
Condition Table: BUY/SELL
Condition Labels: BUY/SELL
Plot Labels in the Graph Above: BUY/SELL
Automate and Monitor Signals/Alerts: BUY/SELL
Signal Validity: The signal will remain valid for X bars
Signal Sequence: Configurable as AND/OR
Condition Table: BUY/SELL
Condition Labels: BUY/SELL
Plot Labels in the Graph Above: BUY/SELL
Automate and Monitor Signals/Alerts: BUY/SELL
______________________________________________________
📜 SCRIPT : RSI Full
🎴 Art by : @Titans_Invest & @DiFlip
👨💻 Dev by : @Titans_Invest & @DiFlip
🎑 Titans Invest — The Wizards Without Gloves 🧤
✨ Enjoy the Spell!
______________________________________________________
o Mission 🗺
• Inspire Traders to manifest Magic in the Market.
o Vision 𐓏
• To elevate collective Energy 𐓷𐓏
RSI + MA + Divergence + SnR + Price levelOverview
This indicator combines several technical analysis tools to give traders a comprehensive view based on the RSI indicator. Its main features include:
RSI & Moving Averages on RSI:
RSI: Calculates the RSI based on the closing price (or a user-selected source) with a configurable period (default is 14).
EMA and WMA: Computes and plots an Exponential Moving Average (EMA with a period of 9) and a Weighted Moving Average (WMA with a period of 45) on the RSI, helping to smooth out signals and better identify trends.
Price Ladder Based on RSI:
Draws horizontal lines at specified target RSI levels (from targetRSI1 to targetRSI7, default levels ranging from 20 to 80).
Calculates a target price based on the price change relative to the averaged gains and losses, providing an estimated price level when the RSI reaches those critical levels.
Divergence Detection:
Identifies divergence between price and RSI:
Bullish Divergence: Detected when the price forms a lower low but RSI fails to confirm with a corresponding lower low, with the RSI falling under a configurable threshold (d_below).
Bearish Divergence: Detected when the price forms a higher high while the RSI does not, with the RSI exceeding a configurable upper threshold (d_upper).
Optionally displays labels on the chart to alert the trader when divergence signals are detected.
Auto Support & Resistance on RSI:
Automatically calculates and plots support and resistance lines based on the RSI over different lookback periods (e.g., 34, 89, 200 bars).
Helps traders identify key RSI levels where price reversals or breakouts might occur.
Benefits for the Trader
This indicator is designed to assist traders in their decision-making process by integrating multiple technical analysis elements:
Identifying Market Trends:
By combining the RSI with its moving averages (EMA, WMA), traders can better assess market trends and the strength of these trends, thereby improving trade entry accuracy.
Early Reversal Signals via Divergence:
Divergence signals (both bullish and bearish) can help forecast potential reversals in the market, allowing traders to adjust their strategies timely.
Determining RSI-Based Support/Resistance Levels:
Automatic identification of support and resistance levels on the RSI provides key areas where a price reversal or breakout may occur, assisting traders in setting stop-loss and take-profit levels strategically.
Price Target Forecasting with the Price Ladder:
The target price labels calculated at important RSI levels provide insights into potential price objectives, aiding in risk management and profit planning.
Flexible Configuration:
Traders can customize key parameters such as the RSI period, lengths for EMA and WMA, target RSI levels, divergence conditions, and support/resistance settings. This flexibility allows the indicator to adapt to different trading styles and strategies.
How to read data
Some use-cases
Used to estimate price according to the RSI level.
When you trade using RSI, you want to set your stop-loss or take-profit levels based on RSI. By looking at the price ladder, you know the corresponding price level to enter a trade.
Used to determine the entry zone.
RSI often reacts to its own previously established support/resistance levels. Use the Auto SnR feature to identify those zones.
Used to determine the trend.
RSI and its moving averages help identify the price trend:
Uptrend: 3 lines separate and point upward.
Downtrend: 3 lines separate and point downward.
Use WMA45 to determine the trend:
Uptrend: WMA45 is moving upward or trading above the 50 level.
Downtrend: WMA45 is moving downward or trading below the 50 level.
Sideways: WMA45 is trading around the 50 level.
Use EMA9 to confirm the trend: A crossover of EMA9 through WMA45 confirms the formation of a new trend.
Configuration
The script allows users to configure a number of important parameters to suit their analytical preferences:
RSI Settings:
RSI Length (rsiLengthInput): The number of periods used to compute the RSI (default is 14, adjustable as needed).
RSI Source (rsiSourceInput): Select the price source (default is the closing price).
RSI Color (rsiClr): The color used to display the RSI line.
Moving Averages on RSI:
EMA Length (emaLength): The period for calculating the EMA on RSI (default is 9).
WMA Length (wmaLength): The period for calculating the WMA on RSI (default is 45).
EMA Color (emaClr) and WMA Color (wmaClr): Customize the colors of the EMA and WMA lines.
Price Ladder Settings:
Toggle Price Ladder (showPrice): Enable or disable the display of the price ladder.
Target RSI Levels: targetRSI1 through targetRSI7: RSI values at which target prices are calculated (default values range from 20, 30, 40, 50, 60, 70 to 80).
Price Label Color (priceColor): The text color for displaying the target price labels.
Divergence Settings:
Divergence Toggle (calculateDivergence): Option to enable or disable divergence calculation and display.
Divergence Conditions:
d_below: RSI level below which bullish divergence is considered.
d_upper: RSI level above which bearish divergence is considered.
Display Divergence Labels (showDivergenceLabel): Option to display labels on the chart when divergence is detected.
Auto Support & Resistance on RSI:
Toggle Auto S&R (enableAutoSnR): Enable or disable automatic plotting of support and resistance levels.
Lookback Periods for Support/Resistance:
L1_lookback: Lookback period for level 1 (e.g., 34 bars).
L2_lookback: Lookback period for level 2 (e.g., 89 bars).
L3_lookback: Lookback period for level 3 (e.g., 200 bars).
Support and Resistance Colors:
rsiSupportClr: Color for the support line.
rsiResistanceClr: Color for the resistance line.
Alerts:
Divergence Alerts: Alert conditions are set up to notify the trader when bullish or bearish divergence is detected, aiding in timely decision-making.
RSI, SRSI, MACD and DMI cross - Open source codeHello,
I'm a passionate trader who has spent years studying technical analysis and exploring different trading strategies. Through my research, I've come to realize that certain indicators are essential tools for conducting accurate market analysis and identifying profitable trading opportunities. In particular, I've found that the RSI, SRSI, MACD cross, and Di cross indicators are crucial for my trading success.
Detailed explanation:
The RSI is a momentum indicator that measures the strength of price movements. It is calculated by comparing the average of gains and losses over a certain period of time. In this indicator, the RSI is calculated based on the close price with a length of 14 periods.
The Stochastic RSI is a combination of the Stochastic Oscillator and the RSI. It is used to identify overbought and oversold conditions of the market. In this indicator, the Stochastic RSI is calculated based on the RSI with a length of 14 periods.
The MACD is a trend-following momentum indicator that shows the relationship between two moving averages of prices. It consists of two lines, the MACD line and the signal line, which are used to generate buy and sell signals. In this indicator, the MACD is calculated based on the close price with fast and slow lengths of 12 and 26 periods, respectively, and a signal length of 9 periods.
The DMI is a trend-following indicator that measures the strength of directional movement in the market. It consists of three lines, the Positive Directional Indicator (+DI), the Negative Directional Indicator (-DI), and the Average Directional Index (ADX), which are used to generate buy and sell signals. In this indicator, the DMI is calculated with a length of 14 periods and an ADX smoothing of 14 periods.
The indicator generates buy signals when certain conditions are met for each of these indicators.
1) For the RSI, a buy signal is generated when the RSI is below or equal to 35 and the Stochastic RSI %K is below or equal to 15, or when the RSI is below or equal to 28 the Stochastic RSI %K is below or equal to 15 or when the RSI is below or equal to 25 and the Stochastic RSI %K is below or equal to 10 or when the RSI is below or equal to 28.
2) For the MACD, a buy signal is generated when the MACD line is below 0, there is a change in the histogram from negative to positive, the MACD line and histogram are negative in the previous period, and the current histogram value is greater than 0.
3) For the DMI, a buy signal is generated when the Positive Directional Indicator (+DI) crosses above the Negative Directional Indicator (-DI), and the -DI is less than the +DI.
The indicator generates sell signals when certain conditions are met for each of these indicators:
1) For the RSI, a sell signal is generated when the RSI is above or equal to 75 and the Stochastic RSI %K is above or equal to 85, or when the RSI is above or equal to 80 and the Stochastic RSI %K is above or equal to 85, or when the RSI is above or equal to 85 and the Stochastic RSI %K is above or equal to 90 or when the RSI is above or equal to 82.
2)For the MACD, a sell signal is generated when the MACD line is above 0, there is a change in the histogram from positive to negative, the MACD line and histogram are positive in the previous period, and the current histogram value is less than the previous histogram value. On the other hand, a buy signal is generated when the MACD line is below 0, there is a change in the histogram from negative to positive, the MACD line and histogram are negative in the previous period, and the current histogram value is greater than the previous histogram value.
3)For the DMI a bearish signal is generated when plusDI crosses above minusDI, indicating that bulls are losing strength and bears are taking control.
The indicator uses a combination of these four indicators to generate potential buy and sell signals. The buy signals are generated when RSI and SRSI values are in oversold conditions, while sell signals are generated when RSI and SRSI values are in overbought conditions. The indicator also uses MACD crossovers and DMI crossovers to generate additional buy and sell signals.
When a signal is strong?
The use of multiple signals within a specific timeframe can increase the accuracy and reliability of the signals generated by this indicator. It is recommended to look for at least two signals within a range of 5-8 candles in order to increase the probability of a successful trade.
Why it's original?
1) There is no indicator in the library that combine all of these indicators and give you a 360 view
2)The combination of the RSI, Stochastic RSI, MACD, and DMI indicators in a single script it's unique and not available in the libray.
3)The specific parameters and conditions used to calculate the signals may be unique and not found in other scripts or libraries.
4)The use of plotshape() to plot the signals as shapes on the chart may be unique compared to other scripts that simply plot lines or bars to indicate signals.
5)The use of alertcondition() to trigger alerts based on the signals may be unique compared to other scripts that do not have custom alert functionality.
Keep attention!
It is important to note that no trading indicator or strategy is foolproof, and there is always a risk of losses in trading. While this indicator may provide useful information for making conclusions, it should not be used as the sole basis for making trading decisions. Traders should always use proper risk management techniques and consider multiple factors when making trading decisions.
Support me:)
If you find this new indicator helpful in your trading analysis, I would greatly appreciate your support! Please consider giving it a like, leaving feedback, or sharing it with your trading network. Your engagement will not only help me improve this tool but will also help other traders discover it and benefit from its features. Thank you for your support!
RSI - 5UP Overview
The "RSI - 5UP" indicator is a versatile tool that enhances the traditional Relative Strength Index (RSI) by adding smoothing options, Bollinger Bands, and divergence detection. It provides a clear visual representation of RSI levels with customizable bands and optional moving averages, helping traders identify overbought/oversold conditions and potential trend reversals through divergence signals.
Features
Customizable RSI: Adjust the RSI length and source to fit your trading style.
Overbought/Oversold Bands: Visualizes RSI levels with intuitive color-coded bands (red for overbought at 70, white for neutral at 50, green for oversold at 30).
Smoothing Options: Apply various types of moving averages (SMA, EMA, SMMA, WMA, VWMA) to the RSI, with optional Bollinger Bands for volatility analysis.
Divergence Detection: Identifies regular bullish and bearish divergences, with visual labels ("Bull" for bullish, "Bear" for bearish) and alerts.
G radient Fills: Highlights overbought and oversold zones with gradient fills (green for overbought, red for oversold).
How to Use
1. Add to Chart: Apply the "RSI - 5UP" indicator to any chart. It works well on timeframes from 5 minutes to daily.
2. Configure Settings:
RSI Settings:
RSI Length: Adjust the period for RSI calculation (default: 14).
Source: Choose the price source for RSI (default: close).
Calculate Divergence: Enable to detect bullish/bearish divergences (default: disabled).
Smoothing:
Type: Select the type of moving average to smooth the RSI ("None", "SMA", "SMA + Bollinger Bands", "EMA", "SMMA (RMA)", "WMA", "VWMA"; default: "SMA").
Length: Set the period for the moving average (default: 14).
BB StdDev: If "SMA + Bollinger Bands" is selected, adjust the standard deviation multiplier for the bands (default: 2.0).
3.Interpret the Indicator:
RSI Levels: The RSI line (purple) oscillates between 0 and 100. Levels above 70 (red band) indicate overbought conditions, while levels below 30 (green band) indicate oversold conditions. The 50 level (white band) is neutral.
Gradient Fills: The background gradients (green above 70, red below 30) highlight overbought and oversold zones for quick reference.
Moving Average (MA): If enabled, a yellow MA line smooths the RSI. If "SMA + Bollinger Bands" is selected, green bands appear around the MA to show volatility.
Divergences: If "Calculate Divergence" is enabled, look for "Bull" (green label) and "Bear" (red label) signals:
Bullish Divergence: Indicates a potential upward reversal when the price makes a lower low, but the RSI makes a higher low.
Bearish Divergence: Indicates a potential downward reversal when the price makes a higher high, but the RSI makes a lower high.
4. Set Alerts:
Use the "Regular Bullish Divergence" and "Regular Bearish Divergence" alert conditions to be notified when a divergence is detected.
Notes
The indicator does not provide direct buy/sell signals. Use the RSI levels, moving averages, and divergence signals as part of a broader trading strategy.
Divergence detection requires the "Calculate Divergence" option to be enabled and may not work on all timeframes or assets due to market noise.
The Bollinger Bands are only visible when "SMA + Bollinger Bands" is selected as the smoothing type.
Credits
Developed by Marrulk. Enjoy trading with RSI - 5UP! 🚀
Easy RSI by nnamWhat Does this Indicator Do?
The Easy RSI Indicator color codes candles based on their RSI Value vs. Open / Close (Red / Green). It plots the current price and current RSI value on the chart in real-time. Additionally, when the RSI Value is in an oversold or overbought condition, it plots that signal on the chart in real-time.
The initial candle color is the standard Red / Green Tradingview color, but a Gradient is added to the color which either darkens or lightens the color based on the RSI Value.
As seen in the screenshot below, the higher the RSI Value, the brighter the Green Color is. The lower the RSI Value, the brighter the Red Color is.
The current Price and current RSI Value are both plotted on the chart by default, but can be optionally switched off by the trader.
As seen in the screenshot below, the prices and RSI Values are easily seen while visually tracking the price in real-time.
RSI Overbought Values are plotted when the Overbought condition is triggered. The Default is RED for Overbought and GREEN for Oversold.
As seen in the screenshot below, with all three labels turned on under the input settings (these are ON by default) you can see the overbought condition, the current RSI Value, and current price all in one centralized area. Oversold Values are also plotted when turned on under the input settings.
As shown in the screenshot below, the candle is GREEN (as evident by the green candle outline) but the RSI Value is low and shows lower than average relative strength. This turns the bar color ORANGE vs, GREEN showing that the relative strength of the move is subpar.
As shown on the screenshot below, if the trader has the standard Tradingview Price label switched on (in the Tradingview Chart Settings), the color of the bar is also translated to the price are for an easy to recognize RSI Value just by looking at the price. Even if the current candle is RED, when the RSI is higher than lower, the color will be green / greenish and even if the current candle is GREEN, when the RSI Value is lower than higher, the color will be red-ish / orange in color giving the user a quick view of RSI Value.
If you have any questions or feature requests for this Indicator please do not hesitate to reach out and ask.
GOOD LUCK trading!!
~nnamdert
SUPER RSI [Gabbo]RSI revolutionizes the classic RSI by allowing you to modify its behavior based on different chart types and dynamic multi-source calculations.
It’s designed for traders who want greater precision and adaptability in momentum analysis across various market conditions.
Whether you want to apply the RSI on alternative candles like Heikin Ashi, Renko, or even combine multiple data sources, this tool provides maximum flexibility.
🔷 Key Features
🟩Customizable Chart Inputs
Apply RSI calculations not only on traditional candles but also on alternative bar types like Heikin Ashi, Kagi, Line Break, Point & Figure, and Renko for a deeper understanding of trend strength.
🟩Multi-Source Aggregation
Blend multiple sources together to create a more stable and refined RSI signal. Combine 2, 3, 4, or even 5 different sources into a single input.
🟩Dynamic RSI and Bands
Unlock advanced options to dynamically adjust the RSI itself and its surrounding bands based on real-time price action.
🔷 Technical Details and Customizable Inputs
1️⃣ Bar Type Selection:
Choose the type of chart structure used for RSI calculation:
Candles (classic)
Heikin Ashi
Kagi
Line Break
Point & Figure
Renko
2️⃣ Use Different Source???
Activate multi-source RSI by combining multiple elements:
2 sources : (Source 1 + Source 2) ÷ 2
3 sources : (Source 1 + Source 2 + Source 3) ÷ 3
4 sources : (Source 1 + Source 2 + Source 3 + Source 4) ÷ 4
5 sources : (Source 1 + Source 2 + Source 3 + Source 4 + Source 5) ÷ 5
3️⃣ Use Dynamic RSI???
Enable a dynamic RSI calculation that adjusts in real-time to market behavior for greater responsiveness.
4️⃣ Use Dynamic Band???
Enable dynamic bands that adapt to price action rather than relying on fixed static thresholds.
🔍 How to Use Dynamic RSI Source Pro
📈 Choose Your Candle Type
Select the bar format that best matches your strategy needs—classic candles, Heikin Ashi, Renko, and more.
🧩 Customize Your Data Source
Activate multi-source input to create smoother, more reliable RSI signals.
⚡ Unlock Dynamic Adaptation
Enable dynamic RSI and bands to adjust automatically to live price movements and enhance signal accuracy.
☄️ With Dynamic RSI Source Pro, you can elevate your RSI analysis by applying it dynamically across multiple candle types and sources, giving you a new level of control and precision.
RSI Overbought/Oversold + Divergence IndicatorDESCRIPTION:
This script combines the Relative Strength Index ( RSI ), Moving Average and Divergence indicator to make a better decision when to enter or exit a trade.
- The Moving Average line (MA) has been made hidden by default but enhanced with an RSIMA cloud.
- When the RSI is above the selected MA it turns into green and when the RSI is below the select MA it turns into red.
- When the RSI is moving into the Overbought or Oversold area, some highlighted areas will appear.
- When some divergences or hidden divergences are detected an extra indication will be highlighted.
- When the divergence appear in the Overbought or Oversold area the more weight it give to make a decision.
- The same color pallet has been used as the default candlestick colors so it looks familiar.
HOW TO USE:
The prerequisite is that we have some knowledge about the Elliot Wave Theory, the Fibonacci Retracement and the Fibonacci Extension tools.
Wave 1
(1) When we receive some buy signals we wait until we receive some extra indications.
(2) On the RSI Overbought/Oversold + Divergence Indicator we can see a Bullish Divergence and our RSI is changing from red to green ( RSI is higher then the MA).
(3) If we are getting here into the trade then we need to use a stop loss. We put our stop loss 1 a 2 pips just below the lowest wick. We also invest maximum 50% of the total amount we want to invest.
Wave 2
(4) Now we wait until we see a clear reversal and here we starting to use the Fibonacci Retracement tool. We draw a line from the lowest point of wave(1) till the highest point of wave (1). When we are retraced till the 0.618 fib also called the golden ratio we check again the RSI Overbought/Oversold + Divergence Indicator. When we see a reversal we do our second buy. We set again a stop loss just below the lowest wick (this is the yellow line on the chart). We also move the stop loss we have set in step (3) to this level.
Wave 3
(5) To identify how far the uptrend can go we need to use the Fibonacci Extension tool. We draw a line from the lowest point of wave(1) till the highest point of wave (1) and draw it back to the lowest point of wave (2). Wave (3) is most of the time the longest wave and can go till it has reached the 1.618 or 2.618 fib. On the 1.618 we can take some profit. If we don't want to sell we move our stop loss to the 1 fib line (yellow line on the chart).
(6) We wait until we see a clear reversal on the Overbought/Oversold + Divergence Indicator and sell 33% to 50% of our investment.
Wave 4
(7) Now we wait again until we see a clear reversal and here we starting to use the Fibonacci Retracement tool. We draw a line from the lowest point of wave(2) till the highest point of wave (3). When we are retraced till the 0.618 fib also called the golden ratio we check again the RSI Overbought/Oversold + Divergence Indicator. When we see a reversal we buy again. We set again a stop loss just below the lowest wick (this is the yellow line on the chart).
(8) If we bought at the first reversal ours stop los was triggered (9) and we got out of the trade.
(9) If we did not bought at step (7) because our candle did not hit the 0.618 fib or we got stopped out of the trade we buy again at the reversal.
Wave 5
(10) To identify how far the uptrend can go we need to use the Fibonacci Extension tool. We draw a line from the lowest point of wave(2) till the highest point of wave (3) and draw it back to the lowest point of wave (4). Most of the time wave 5 goes up till it has reached the 1 fib. And that is the point where we got out of the trade with all of our investment. In this trade we got out of the trade a bit earlier. We received the sell signals and got a reversal on the Overbought/Oversold + Divergence Indicator.
We are hoping you learned something so you can make better decisions when to get into or out of a trade.
If you have any question just drop it into the comments below.
FEATURES:
• You can show/hide the RSI .
• You can show/hide the MA.
• You can show/hide the lRSIMA cloud.
• You can show/hide the Stoch RSI cloud.
• You can show/hide and adjust the Overbought and Oversold zones.
• You can show/hide and adjust the Overbought Extended and Oversold Extended zones.
• You can show/hide the Overbought and Oversold highlighted zones.
• Etc...
HOW TO GET ACCESS TO THE SCRIPT:
• Favorite the script and add it to your chart.
REMARKS:
• This advice is NOT financial advice.
• We do not provide personal investment advice and we are not a qualified licensed investment advisor.
• All information found here, including any ideas, opinions, views, predictions, forecasts, commentaries, suggestions, or stock picks, expressed or implied herein, are for informational, entertainment or educational purposes only and should not be construed as personal investment advice.
• We will not and cannot be held liable for any actions you take as a result of anything you read here.
• We only provide this information to help you make a better decision.
• While the information provided is believed to be accurate, it may include errors or inaccuracies.
Good Luck and have fun,
The CryptoSignalScanner Team
RSI-Volume Oscillator Quick Scalping By Akhilesh PatelTitle: RSI-Volume Oscillator Quick Scalping Indicator
Description:
The "RSI-Volume Oscillator Quick Scalping" is a powerful and versatile custom indicator designed for traders who engage in scalping strategies. This indicator combines the Relative Strength Index (RSI) with a Volume Oscillator to provide valuable insights into momentum and volume dynamics in the market. Traders can also select their preferred moving average types (SMA, EMA, or HMA) to further customize the indicator's behavior.
Key Features:
RSI and Volume Oscillator Fusion: The indicator blends the RSI and a custom Volume Oscillator to offer a comprehensive view of both price momentum and volume trends. This integration provides valuable signals for quick scalping opportunities.
Customizable Moving Averages: Traders can choose from three popular moving average types (SMA, EMA, or HMA) for further customization. This flexibility allows users to align the indicator with their preferred trading strategies.
Clear Visualization: The Combined RSI-Volume Oscillator is plotted as a solid blue line, while the three selected moving averages are represented by orange, purple, and green lines, respectively. The zero line, overbought, and oversold levels for RSI are also indicated for easy reference.
Quick Scalping Signals: The indicator helps traders spot potential buy and sell signals efficiently, making it ideal for quick scalping strategies in rapidly moving markets.
Usage Instructions:
Customize the indicator by selecting your preferred RSI length, Volume Oscillator length, and moving average type (SMA, EMA, or HMA).
Observe the Combined RSI-Volume Oscillator and moving averages for potential entry and exit points.
Look for crossovers between the Combined RSI-Volume Oscillator and the selected moving averages for buy and sell signals.
The overbought (70) and oversold (30) levels for RSI can be used to identify potential reversal points.
Important Note:
Test the indicator on historical data and demo accounts before using it in live trading to ensure it aligns with your trading strategy.
Understand that no indicator guarantees profits, and trading involves risk. Always use proper risk management and discipline when executing trades.
Overall, the "RSI-Volume Oscillator Quick Scalping" indicator is a valuable addition to any scalper's toolkit, providing comprehensive insights into momentum and volume dynamics to enhance trading decisions. Happy scalping!
RSI + Support/Resistance Zones + EMAThis indicator enhances the RSI with support and resistance zones and an EMA.
RSI: a regular RSI (default: orange / 14 period)
EMA: an EMA on the RSI (default: light gray / 10 period)
RSI support/resistance zones
SR-Zones for bull markets: In a bull market the price tends to find resistance between 80 and 90 and support between 40 and 50 RSI.
SR-Zones for bear markets: In a bear market the price tends to find resistance between 55 and 65 and support between 20 and 30 RSI.
The concept of these support and resistance zones has been popularized by Constance Brown in her book Technical Analysis for the Trading Professional . The SR zones are described in the first chapter which is available in the preview section on Amazon.
RSI-EMA
The EMA on the RSI can also be used as support and resistance. For example, you can be use it for a simple strategy such as the following: In an uptrend after a significant correction during which the RSI has been below the EMA for some time, wait for the RSI to cross above the EMA to go long and exit (partially) after the RSI crossed down the EMA.
Hint: All visual elements (RSI, EMA, support zones) can be enabled/disabled and adjusted individually.
RSI-EMA-Crossing with Donchian-Stop-LossThe Donchian RSI Indicator is a visual tool that combines momentum and trend analysis to identify high-quality long opportunities based on RSI crossovers, price action, and Donchian channel dynamics.
How It Works
Momentum Signal: A bullish RSI crossover is detected when the RSI crosses above its moving average.
Trend Filter: A signal is only valid if the crossover occurs while the price is above its moving average – filtering out entries against the prevailing trend.
Signal Candle: The high of the crossover candle is stored.
Entry Trigger: A valid signal occurs when a later candle closes above that signal high.
Stop-Loss (Visual Only)
The lower band of the Donchian Channel acts as a visual reference for a dynamic stop-loss level.
Features
Customizable RSI, Donchian Channel, and moving average lengths
Selectable MA types: SMA, EMA, WMA, VWMA, HMA
Signal candle highlighted (yellow background)
Entry points labeled on the chart
Price MA and Donchian Channel plotted
Trend filter improves signal quality by confirming upward bias
Use Case
Designed for swing and position traders
Optimized for use on daily or 4H charts
RSI+EMA+MZONES with DivergencesFeatures:
1. RSI Calculation:
Uses user-defined periods to calculate the RSI and visualize momentum shifts.
Plots key RSI zones, including upper (overbought), lower (oversold), and middle levels.
2. EMA of RSI:
Includes an Exponential Moving Average (EMA) of the RSI for trend smoothing and confirmation.
3. Bullish and Bearish Divergences:
Detects Regular divergences (labeled as “Bull” and “Bear”) for classic signals.
Identifies Hidden divergences (labeled as “H Bull” and “H Bear”) for potential trend continuation opportunities.
4. Customizable Labels:
Displays divergence labels directly on the chart.
Labels can be toggled on or off for better chart visibility.
5. Alerts:
Predefined alerts for both regular and hidden divergences to notify users in real time.
6. Fully Customizable:
Adjust RSI period, lookback settings, divergence ranges, and visibility preferences.
Colors and styles are easily configurable to match your trading style.
How to Use:
RSI Zones: Use RSI and its zones to identify overbought/oversold conditions.
EMA: Look for crossovers or confluence with divergences for confirmation.
Divergences: Monitor for “Bull,” “Bear,” “H Bull,” or “H Bear” labels to spot key reversal or continuation signals.
Alerts: Set alerts to be notified of divergence opportunities without constant chart monitoring.
RSI Shaded - MTF
Non-repainting multiple time frame RSI with shading of overbought and oversold levels.
Includes option for simple moving average smooth of the RSI (Larry Connors)
Includes option to plot the EMA of the RSI
Related to RSI Shaded .
For other multiple time frame indicators see:
Adaptive ATR-ADX Trend
Fisher Transform MTF
ADX-DI MTF
Laguerre RSI MTF
RSI HistogramThis an experiment to visualise the famous RSI indicator within a Histogram.
Opposed to regular RSI this RSI is plotted into a Histogram and uses different scales (100 to -100), in addition it has the ability to smooth the RSI with various moving averages like HMA, JMA and KAMA.
About RSI:
The RSI measures recent performance of a given stock against its own price history performance, by combining the average gain or loss a particular security owns over a predetermined time period.
Bars can be colored in Settings (Disabled by default)
Enjoy and like if you like :)
RSI Cross by uykusuzpenguenRSI Cross Explanation;
It's simple,
When short-term RSI crossover long-term RSI ; BUY ( Green Area )
When short-term RSI crossunder long-term RSI ; SELL ( Red Area )
You can change RSI lenghts or moving average lenght on settings.
If you knew that, you would sell all your bitcoins at a price of $13.500 and not look back on 8th January.
Happy trading.
RSI DINGUE - 3³ DivergenceThis is the updated version for PineScript V5
3x RSI indicator into 1. You can turn on or off all of them.
Each RSI has 2 individual Moving Averages that can also be changed to be "Full RSI" in the settings.
This makes 3x3 = 9 indicators on screen at the same time. (you can turn them on or off)
It has Bullish and Bearish divergence and hidden divergence as well.
Several visual options to show crosses between RSIs and or MAs fill in colors, background colors, midline. Overbought and Oversold levels with signals when entry and exit.
---------------------
In closing, no indicator can give perfect signals, you need to use them in conjunction with other information to make better decisions.
I hope you like my indicators and that they help your trading.
If you have any questions please ask.
Thank you.
CM RSI-2 Strategy Lower IndicatorRSI-2 Strategy
***At the bottom of the page is a link where you can download the PDF of the Backtesting Results.
This year I am focusing on learning from two of the best mentors in the Industry with outstanding track records for Creating Systems, and learning the what methods actually work as far as back testing.
I came across the RSI-2 system that Larry Connors developed. Larry has become famous for his technical indicators, but his RSI-2 system is what actually put him “On The Map” per se. At first glance I didn’t think it would work well, but I decided to code it and ran backtests on the S&P 100 In Down Trending Markets, Up Trending Markets, and both combined. I was shocked by the results. So I thought I would provide them for you. I also ran a test on the Major forex Pairs (12) for the last 5 years, and All Forex Pairs (80) from 11/28/2007 - 6/09/2014, impressive results also.
The RSI-2 Strategy is designed to use on Daily Bars, however it is a short term trading strategy. The average length of time in a trade is just over 2 days. But the results CRUSH the general market averages.
Detailed Description of Indicators, Rules Below:
Link For PDF of Detailed Trade Results
d.pr
Original Post
CM RSI-2 Strategy - Upper Indicators.RSI-2 Strategy
***At the bottom of the page is a link where you can download the PDF of the Backtesting Results.
This year I am focusing on learning from two of the best mentors in the Industry with outstanding track records for Creating Systems, and learning the what methods actually work as far as back testing.
I came across the RSI-2 system that Larry Connors developed. Larry has become famous for his technical indicators, but his RSI-2 system is what actually put him “On The Map” per se. At first glance I didn’t think it would work well, but I decided to code it and ran backtests on the S&P 100 In Down Trending Markets, Up Trending Markets, and both combined. I was shocked by the results. So I thought I would provide them for you. I also ran a test on the Major forex Pairs (12) for the last 5 years, and All Forex Pairs (80) from 11/28/2007 - 6/09/2014, impressive results also.
The RSI-2 Strategy is designed to use on Daily Bars, however it is a short term trading strategy. The average length of time in a trade is just over 2 days. But the results CRUSH the general market averages.
Detailed Description of Indicators, Rules Below:
Link For PDF of Detailed Trade Results
d.pr
Original Post
RSI Overbought/Oversold [Overlay Highlighter]Indicator to show when the RSI is in oversold(Below 30) or overbought (Above 70) conditions. The background color of the chart changes colors in the areas where the above conditions are met.
Price can often reverse in these areas. However, this depends on the strength of the trend and price may continue higher or lower in the direction of the overall trend.
Divergence has been added to aid the user in timing reversals. Divergences are plotted by circles above or below the candles. Divergence is confirmed so there is a delay of one candle before the signal is given on the previous candle. Again, everything depends on the strength of the trend so use proper risk management.
Once the RSI has entered into oversold/overbought conditions, it is recommended to wait for divergence before entering into the trade near areas of support or resistance. It is recommended to utilize this strategy on the H4 timeframe, however, this particular strategy works on all timeframes.
This indicator is a modified version of seoco's RSI Overbought/Oversold + Divergence Indicator . The user interface has been refined, is now overlayed on the chart, and my own divergence code has been inserted.
RSI MTF Panel [xdecow]This indicator shows the RSI of up to 10 different timeframes with various customization options:
Panel position
Panel orientation (vertical/horizontal)
Border width and color
Choose up to 10 time frames with RSI length and source
Background and text colors
Thresholds of overbought, oversold, uptrend, downtrend and no-trend zones to change the color of the RSI
Color debug mode
RSI+ by Wilson (alt)Extension of the excellent RSI+ script by Wilsonlibero. I tweaked the parameters to better fit crypto markets, and I added a few more visuals, such as midline, overbought/oversold threshold lines and areas, background coloration depending on RSI trend above or below midline, and a few other tweaks especially colors (fixed the transp parameter deprecation for example). The color theme is by default more optimized for dark mode charts, but all colors can be configured, and all drawings can be enabled/disabled/tweaked in the parameters.
I'm just giving back to the community since I could modify this script only because it was open-source. If you like this script, please don't give me any credit, but please show some love to the original author Wilsonlibero: