RSI+BB -=[ CryptDude ]=-RSI+BB
RSI + Bollingerbands
Credits
First of all I'd like to credit my trading pal, Vitaly905 who is a fellow Whale Crew associate for discovering this approach via another FOREX YouTuber, and turned me onto the general strategy. I created my own style template of the combo with the transitional trend color changes. My scripting skill were a little rusty at the time, so spoke with another trading friend in Whale Crew, MartyMcFly, and he put the script together for it and I generally went through, changed some nomenclature and touched some of the code as well. My other Whale Crew partner, Sydnet helped configure the alerts.
We're proud of it and hope you enjoy it. Just wanted to give credit to the collaborative effort.
The Strategy
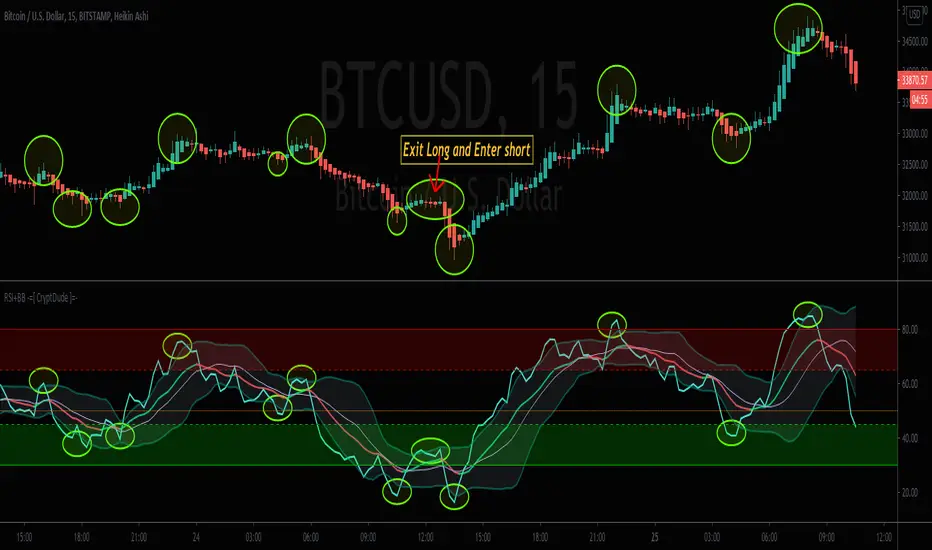
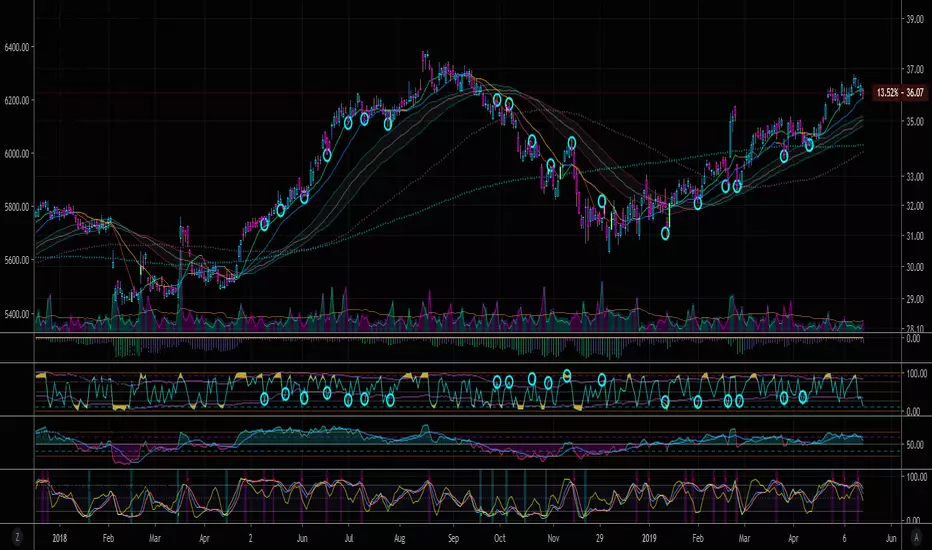
The key to this strategy is to look for when the RSI gets very close or crosses above or below the Bollinger bands as indications of potential pivot ranges. You can also set Alerts for when the Bollinger Bands are crossed
Things to be aware of
(1) During the RSI peaks, be aware that most of them have a double hump or double tops on the RSI when they are close to or have breached the BB. Sot that means there's likely going to be an interval of time after the firs peak or dip before it finally pivots. This takes a little adjustment, but after a while you start to recognize the pattern. They almost look like an "M" on the tops and a "W" shape on the bottom; tilted in one direction or the other.
(2) Also during those peaks or dips, the RSI may move some, but price can move quite a bit more. So it's up to you, the trader, to trust your own analysis, by checking other known confluent momentum indications as to WHEN you should execute your entry, accordingly.
(3) There is a lot of consistency in this strategy after you spend more time getting intimate with it.
(4) I may ad convergence indication to it later, but It may pollute the chart more than being useful, as I don't have issue finding convergence.
(5) Set your own rules as to what constitutes an entry confirmation, which can be a confluence of other momentum indicators along with the RSI+BB.
Below is an example of the strategy with the price action
Happy trading!!
Your trading pal,
~ CryptDude
Cari dalam skrip untuk "rsi"
RSI Shaded - MTF
Non-repainting multiple time frame RSI with shading of overbought and oversold levels.
Includes option for simple moving average smooth of the RSI (Larry Connors)
Includes option to plot the EMA of the RSI
Related to RSI Shaded .
For other multiple time frame indicators see:
Adaptive ATR-ADX Trend
Fisher Transform MTF
ADX-DI MTF
Laguerre RSI MTF
RSI HistogramThis an experiment to visualise the famous RSI indicator within a Histogram.
Opposed to regular RSI this RSI is plotted into a Histogram and uses different scales (100 to -100), in addition it has the ability to smooth the RSI with various moving averages like HMA, JMA and KAMA.
About RSI:
The RSI measures recent performance of a given stock against its own price history performance, by combining the average gain or loss a particular security owns over a predetermined time period.
Bars can be colored in Settings (Disabled by default)
Enjoy and like if you like :)

RSI Cross by uykusuzpenguenRSI Cross Explanation;
It's simple,
When short-term RSI crossover long-term RSI ; BUY ( Green Area )
When short-term RSI crossunder long-term RSI ; SELL ( Red Area )
You can change RSI lenghts or moving average lenght on settings.
If you knew that, you would sell all your bitcoins at a price of $13.500 and not look back on 8th January.
Happy trading.

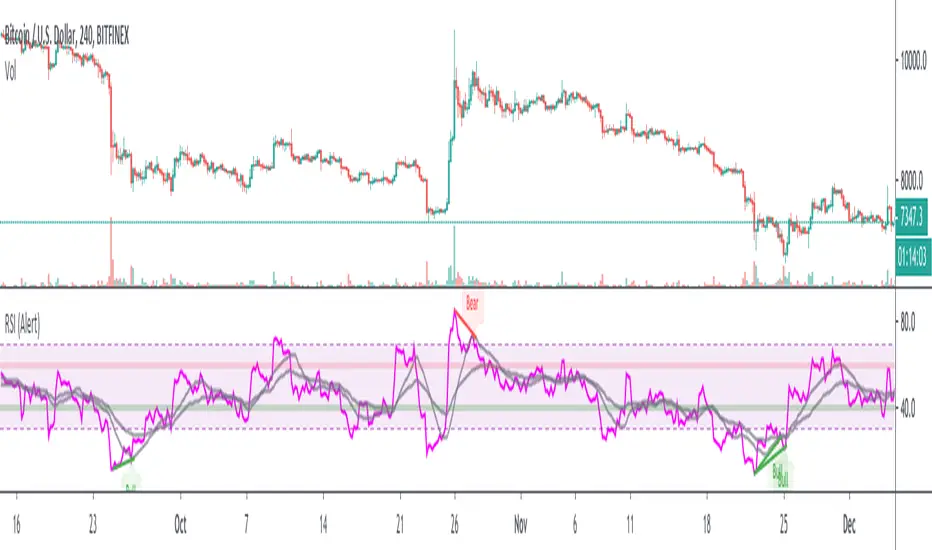
RSI w/ MAs & Divergences (Alert)This script fires off real-time RSI Divergence alerts.
To best use the RSI Divergence indicators, adjust the following settings accordingly.
• RSI Bullish Divergence Under: 20 – 45 (lower for larger volatility and more bearish markets)
• RSI Bearish Divergence Above: 55 – 80 (higher for larger volatility and more bullish markets)
Key Notes:
1. Set "Once Per Bar" instead of "Once Per Bar Close" alert.
The strategy already uses prior bar close (instead of current bar close) for calculation. This ensures that the signals will stay as they are after fired off, even when the current bar price is still changing.
2. It's OKAY to see the "alert may trigger differently than expected" warning.
Reason why you are seeing this warning is because we used a function called valuewhen() in our strategy. This function does not look at the entire history of data and has several limitations. For instance, on a 30min resolution, at the end of 2018, the function will be able to find past occurrences of BTC exceeding 16k. However, the function won't be able to find such occurrences at the end of 2019. Since our strategy is only concerned with very recent events, these limitations will not impact our results or cause repainting. You can find out more about this in the TradingView Wiki .
TEXAS 2 Step RSI-2 - Alerts Built-inBe sure to Add to Favorites (down below) and/or Like/Follow this script so that you will be alerted to UPDATES.
Adding to Favorites makes it available in your list of Indicators.
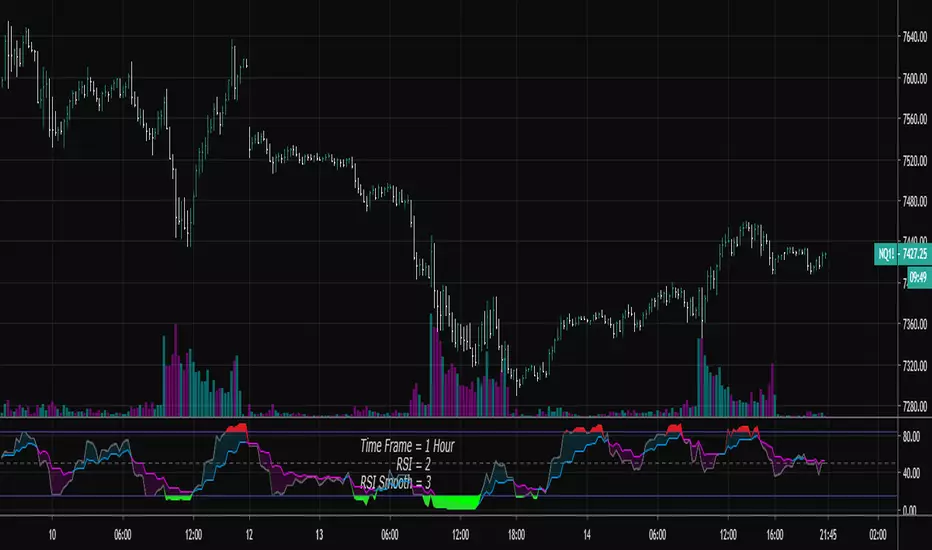
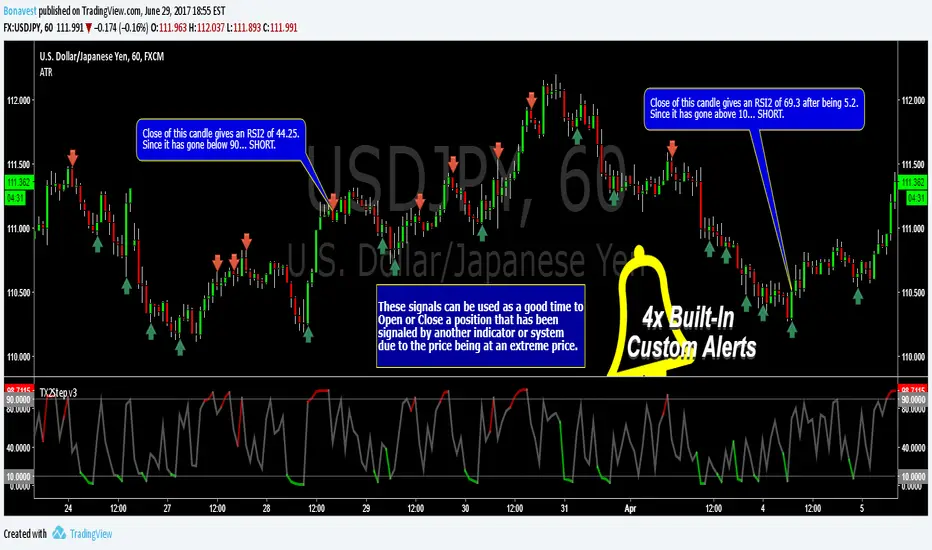
The Texas 2 Step is a lower indicator (arrows on candles added for reference) based on the RSI-2 Strategy made famous by Larry Connors.
I use this indicator for:
Timing Entries and Exits
Trading Between Up/Ddown Signals
Detecting Trends and Pull Backs
I use this indicator by looking for the RSI-2 number going back inside the 10-90 range(gray) after being outside (red/green). This tells me the price is no longer at an extreme. You never know how many candles will remain in the extreme areas so wait for a candle to close inside the range.
On longer time frames (daily/weekly) you will notice several candles will stay in the extreme areas resulting in 100 pips or more before returning to the inside range. In these cases you can go LONG/SHORT in the direction of the extreme area and close your position once it returns to the inside range.
There are 4 Built-In Notifications already created for you and are available by simply right clicking in the indicator area and selecting:
Condition: TX2Step v3 - RSI
Then 1 of the 4 Alerts:
Green Alert - RSI2 > 90 and line turns Green
Red Alert - RSI2 < 10 and line turns Red
Down - RSI2 < 90 after being in the top RSI2 > 90 area
Up - RSI2 > 10 after being in the bottom RSI2 < 10 area
I look forward to hearing your thoughts on the indicator and will definitely like to build upon this indicator and continue to update it.
This adaptation was based off of the original code from the talented Chris Moody.
Plenty of additional information about Larry Connors RSI-2 Strategy with PDFs and Backtests in the stock markets on the original Script.
RSI DINGUE - 3³ DivergenceThis is the updated version for PineScript V5
3x RSI indicator into 1. You can turn on or off all of them.
Each RSI has 2 individual Moving Averages that can also be changed to be "Full RSI" in the settings.
This makes 3x3 = 9 indicators on screen at the same time. (you can turn them on or off)
It has Bullish and Bearish divergence and hidden divergence as well.
Several visual options to show crosses between RSIs and or MAs fill in colors, background colors, midline. Overbought and Oversold levels with signals when entry and exit.
---------------------
In closing, no indicator can give perfect signals, you need to use them in conjunction with other information to make better decisions.
I hope you like my indicators and that they help your trading.
If you have any questions please ask.
Thank you.

RSI w/ MAs & DivergencesTo best use the RSI Divergence indicators, adjust the following settings accordingly.
• RSI Bullish Divergence Under: 20 – 45 (lower for larger volatility and more bearish markets)
• RSI Bearish Divergence Above: 55 – 80 (higher for larger volatility and more bullish markets)
THIS SCRIPT DOES NOT REPAINT AND IS COMPLETELY FREE.

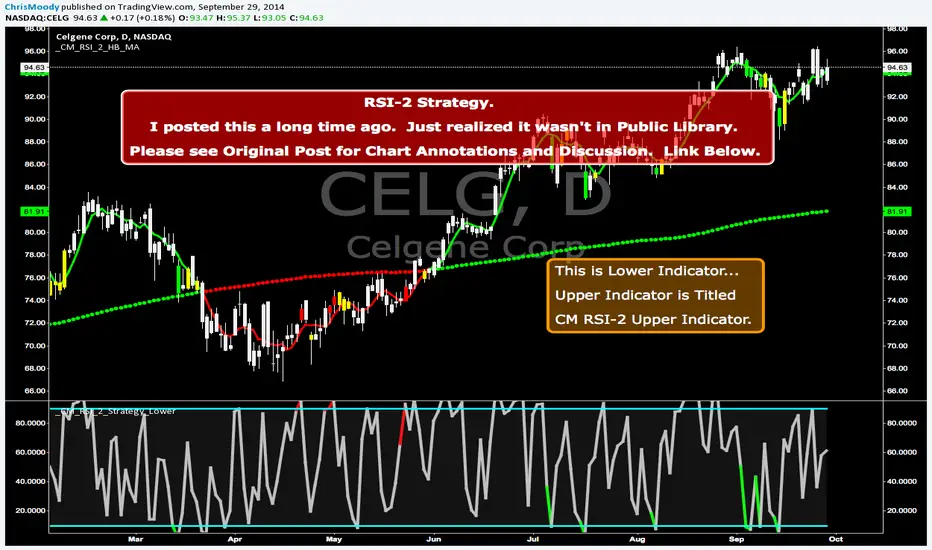
CM RSI-2 Strategy Lower IndicatorRSI-2 Strategy
***At the bottom of the page is a link where you can download the PDF of the Backtesting Results.
This year I am focusing on learning from two of the best mentors in the Industry with outstanding track records for Creating Systems, and learning the what methods actually work as far as back testing.
I came across the RSI-2 system that Larry Connors developed. Larry has become famous for his technical indicators, but his RSI-2 system is what actually put him “On The Map” per se. At first glance I didn’t think it would work well, but I decided to code it and ran backtests on the S&P 100 In Down Trending Markets, Up Trending Markets, and both combined. I was shocked by the results. So I thought I would provide them for you. I also ran a test on the Major forex Pairs (12) for the last 5 years, and All Forex Pairs (80) from 11/28/2007 - 6/09/2014, impressive results also.
The RSI-2 Strategy is designed to use on Daily Bars, however it is a short term trading strategy. The average length of time in a trade is just over 2 days. But the results CRUSH the general market averages.
Detailed Description of Indicators, Rules Below:
Link For PDF of Detailed Trade Results
d.pr
Original Post
CM RSI-2 Strategy - Upper Indicators.RSI-2 Strategy
***At the bottom of the page is a link where you can download the PDF of the Backtesting Results.
This year I am focusing on learning from two of the best mentors in the Industry with outstanding track records for Creating Systems, and learning the what methods actually work as far as back testing.
I came across the RSI-2 system that Larry Connors developed. Larry has become famous for his technical indicators, but his RSI-2 system is what actually put him “On The Map” per se. At first glance I didn’t think it would work well, but I decided to code it and ran backtests on the S&P 100 In Down Trending Markets, Up Trending Markets, and both combined. I was shocked by the results. So I thought I would provide them for you. I also ran a test on the Major forex Pairs (12) for the last 5 years, and All Forex Pairs (80) from 11/28/2007 - 6/09/2014, impressive results also.
The RSI-2 Strategy is designed to use on Daily Bars, however it is a short term trading strategy. The average length of time in a trade is just over 2 days. But the results CRUSH the general market averages.
Detailed Description of Indicators, Rules Below:
Link For PDF of Detailed Trade Results
d.pr
Original Post

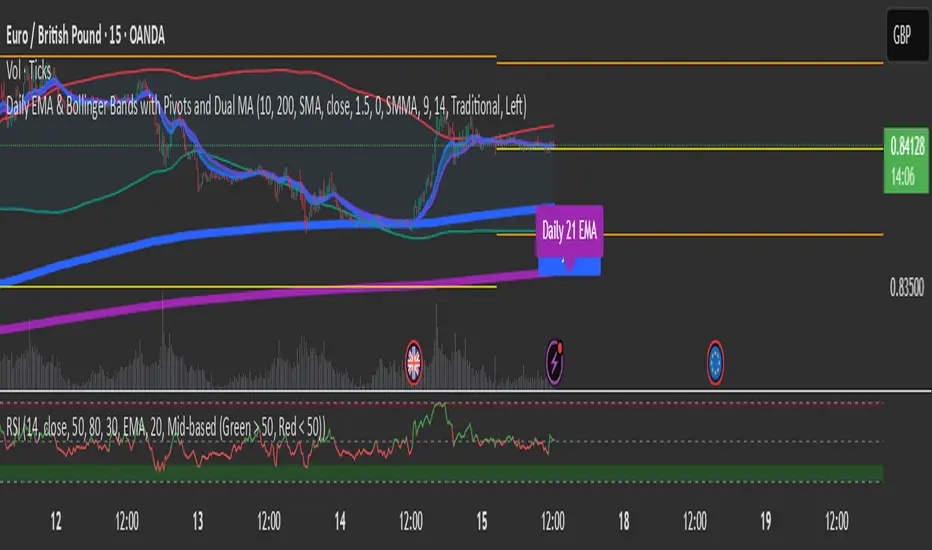
RSI Overbought/Oversold [Overlay Highlighter]Indicator to show when the RSI is in oversold(Below 30) or overbought (Above 70) conditions. The background color of the chart changes colors in the areas where the above conditions are met.
Price can often reverse in these areas. However, this depends on the strength of the trend and price may continue higher or lower in the direction of the overall trend.
Divergence has been added to aid the user in timing reversals. Divergences are plotted by circles above or below the candles. Divergence is confirmed so there is a delay of one candle before the signal is given on the previous candle. Again, everything depends on the strength of the trend so use proper risk management.
Once the RSI has entered into oversold/overbought conditions, it is recommended to wait for divergence before entering into the trade near areas of support or resistance. It is recommended to utilize this strategy on the H4 timeframe, however, this particular strategy works on all timeframes.
This indicator is a modified version of seoco's RSI Overbought/Oversold + Divergence Indicator . The user interface has been refined, is now overlayed on the chart, and my own divergence code has been inserted.

RSI MTF Panel [xdecow]This indicator shows the RSI of up to 10 different timeframes with various customization options:
Panel position
Panel orientation (vertical/horizontal)
Border width and color
Choose up to 10 time frames with RSI length and source
Background and text colors
Thresholds of overbought, oversold, uptrend, downtrend and no-trend zones to change the color of the RSI
Color debug mode

RSI+ by Wilson (alt)Extension of the excellent RSI+ script by Wilsonlibero. I tweaked the parameters to better fit crypto markets, and I added a few more visuals, such as midline, overbought/oversold threshold lines and areas, background coloration depending on RSI trend above or below midline, and a few other tweaks especially colors (fixed the transp parameter deprecation for example). The color theme is by default more optimized for dark mode charts, but all colors can be configured, and all drawings can be enabled/disabled/tweaked in the parameters.
I'm just giving back to the community since I could modify this script only because it was open-source. If you like this script, please don't give me any credit, but please show some love to the original author Wilsonlibero:

RSI with Divergences, Reverse Formulas, and Bull/Bear ZonesRegular RSI indicator that can underline divergences, turn green or red specifying user specified bull/bear zones, and with a label showing the price needed to turn bull/bear!
Specify the inputs:
+ RSI Length
+ Bull Threshold
+ Bear Threshold
+ Panel Position Offset
Also with toggle-able:
+ Bullish Divergence
+ Bearish Divergence
+ Hidden Bullish Divergence
+ Hidden Bearish Divergence
The zones included in the indicator are default and not meant to be used for all markets. The goal is to alter the bull/bear zones to find good breakout points and selloff points for your chosen security. Does not currently support automatic zone creation, or saving zones for each security (if that is even possible, may just need to create different layouts for each security).
Thanks!

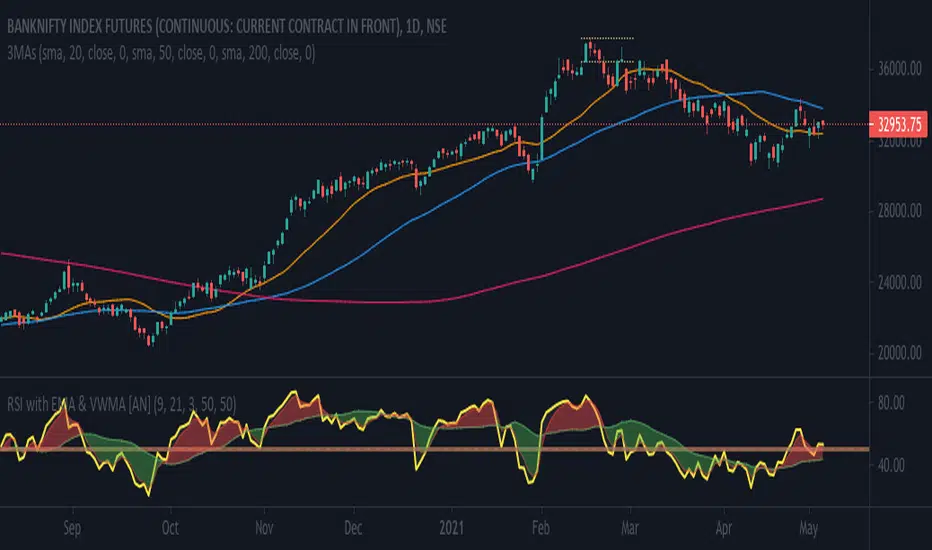
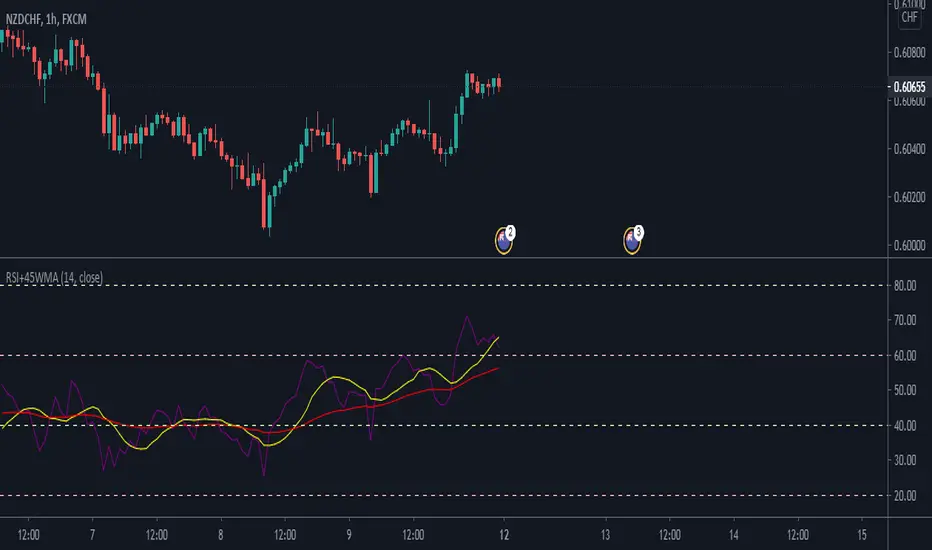
RSI with WMA & EMA [AN]Key Factors traced
- Price: EMA (Exponential Moving Average)
- Volume: WMA (Weighted Moving Avg.)
- Strength (Momentum): RSI (Relative Strength Indicator)
Default parameters
1. RSI at 9. Over brought & Under sold to 50 to be used as a median. This can be altered to the traditional 70:30 or 60:40
2. WMA at 21
3. EMA at 3, Exponential for Intraday trades
RSI with Moving Averages[UO]This RSI indicator is one of my favorite indicators. This powerful indicator is implemented by Phi-Deltalytics. I modified the drawing so that it is easier (at least for me) to see the signals and trends (it would not matter if you're doing algorithmic trading).
Trends and signals. For detailed instructions and tutorial see Phi-Deltalytics page

RSI+OBVthis strategy works on the basis of crossovers of RSI at different period and OBV at different periods (separately). I am using it for Nifty and Bank Nifty. Entry for long can be taken when green bar appears; and exit has to be done when it disappears. Entry for short has to be taken when red bar appears; and exit has to be done when it disappears.
With little help from price action good results can be achieved.

RSI mid partition color changeWhen RSI is above 50 our default bias is on buy side and when below 50 our bias is on sell side.
Therefore created 2 zones for easy identification.


RSI-2RSI-2 is an RSI indicator based on 2 periods.
It is used to locate pull back points within a major trend.
These points will generally offer the best risk/reward entry areas.
OB is >90
OS is <10
In an uptrend, long, when RSI-2 is OS
In a downtrend, short, when RSI-2 is OB
Start with 1D chart,
If RSI-2 gives too many signals (false signals) then use higher time frame, such as 3D
If RSi-2 gives not enough signals, then use a lower time frame, such as 3HR
For more information on RSI-2, read "Short term trading strategies that work"-by larry connors, chapter 9
RSI مع 5 متوسطات و5 مستوياتRSI with 5 Moving Averages and 5 Levels
This indicator combines the Relative Strength Index (RSI) with five customizable moving averages and five horizontal levels to help identify momentum, overbought/oversold zones, and trend strength.
• RSI: Measures the speed and change of price movements.
• Levels (10, 20, 50, 80, 90):
• 10 & 20 → Oversold zones (potential buy areas)
• 80 & 90 → Overbought zones (potential sell areas)
• 50 → Neutral midpoint (trend balance line)
• Moving Averages (5, 8, 13, 21, 200):
Smooth the RSI line to reveal short- and long-term momentum trends.
You can choose the type (SMA, EMA, WMA), color, and line thickness.
Optional alert signals can be triggered when the RSI crosses specific levels (e.g., above 80 or below 20).
