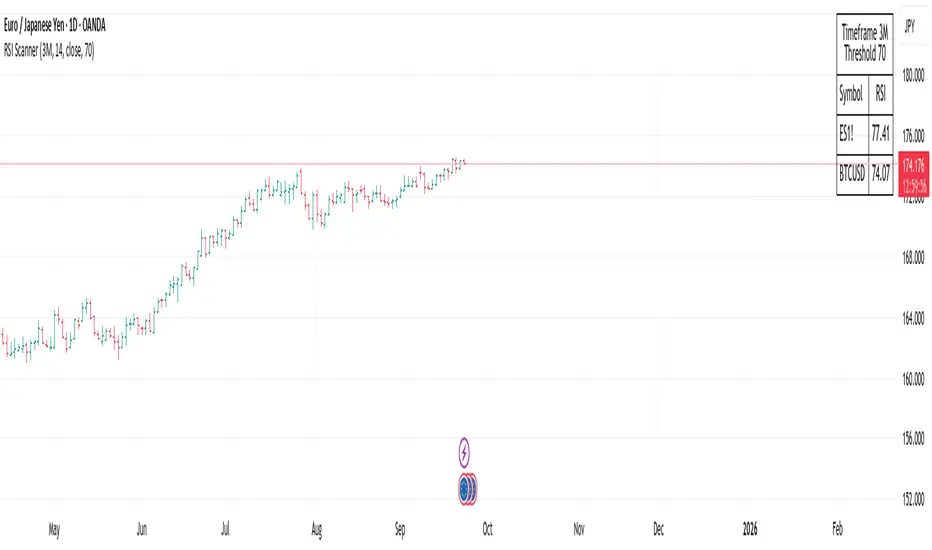
RSI with Self-Adjusting Linear Regression Bands (Expo)RSI with Self-Adjusting Linear Regression Bands (Expo) makes use of RSI and Linear Regression to create an RSI that follows the current trend. The indicator has an upper and lower self-adjusting Linear Regression Band that act as RSI boundaries.
HOW TO USE
The indicator can be used in multiple ways, for instance, to find overbought and oversold areas. Or to identify trends as well as pullbacks in trends.
INDICATOR IN ACTION
This indicator is a modification of RafaelZioni's work "Linear Regression Trend bands"
Credit to: RafaelZioni
I hope you find this indicator useful , and please comment or contact me if you like the script or have any questions/suggestions for future improvements. Thanks!
I will continually work on this indicator, so please share your experience and feedback as it will enable me to make even better improvements. Thanks to everyone that has already contacted me regarding my scripts. Your feedback is valuable for future developments!
-----------------
Disclaimer
Copyright by Zeiierman.
The information contained in my scripts/indicators/ideas does not constitute financial advice or a solicitation to buy or sell any securities of any type. I will not accept liability for any loss or damage, including without limitation any loss of profit, which may arise directly or indirectly from the use of or reliance on such information.
All investments involve risk, and the past performance of a security, industry, sector, market, financial product, trading strategy, or individual’s trading does not guarantee future results or returns. Investors are fully responsible for any investment decisions they make. Such decisions should be based solely on an evaluation of their financial circumstances, investment objectives, risk tolerance, and liquidity needs.
My scripts/indicators/ideas are only for educational purposes!
Cari dalam skrip untuk "rsi"
RSI, Stoch, DMI Stoch / By Mochero
With this indicator, we seek to find convergence of RSI, Stoch and DMI for purchases or sales.
Search Buy when,
-Rsi over sold
-Stoch over sold
-DMI Over sold
Search Sell when,
-Rsi oon purchased
-Stoch on purchased
-DMI on purchased
Suggested values
Rsi: 4
Stoch: 5.1.1
DMI: 10.3
Suggested time, 5M 15M
RSI (w/ Curve and Volatility)This is a centered triple oscillator which measures RSI, RVI (volatility), and Coppock Curve (trend). This is centered so it ranges from negative 50 to positive 50. This indicator is used most accurately when all 3 indicators show above/below 0.
RSI is the bright pink line. RSI determines strength in a direction. When it is above 20 or below -20, a pullback is likely - this could be a prime time to scale out of position. Remember do not enter a trade just because it is oversold, as the strength is still greatly against you.
RVI is the thin lighter line. RVI was created by Donald Dorsey to use in conjunction with other indicators. The instructions for using RVI is to sell/short when below -10 and buy/cover when above 10. Use this indicator to confirm your bias.
The purple area is the Coppock curve . This curve is used to analyze longer term trends in a chart. RSI and RVI struggle to indicate long term trends, use the Coppock curve to confirm your bias. The curve is bullish when above 0 and bearish when below 0. Be cautious when trying to buy or sell it early when its falling. If it is falling and pops back up without reaching 0, it is typically indicate of a big price movement in that direction.
RSI Oversold/Overbought IndicatorThis is a very simple but quite powerful indicator which looks at the RSI simultaneously over the 4h, Daily and Weekly timeframes, and places bands on the chart when one or more timeframes move into oversold/overbought territory. For further filtering I use the 200 day SMA to determine if we are in a Bull or Bear market, which puts a bias on the RSI (30/80 in a Bull market and 20/70 in a Bear market).
The deeper the colour, the more oversold the market is. The weekly RSI can be used as an early warning sign, with the Daily/ 4h RSI useful to identify local peaks.
RSI X-Factorel índice de fuerza relativa (RSI) es un indicador que nos determina la fuerza que está teniendo la moneda en sí, va en un rango de 0 a 100, si el RSI esta mayor al rango 70 se lo considera sobrecomprado, es decir, exceso de compras, el precio de la moneda esta alto. En ese momento el indicador costumizado por X-factor indicadores nos marcará una barra roja que significa momento de vender. Caso contrario cuando el RSI esta por debajo de la zona del 30 significa que el precio esta sobrevendido, exceso de ventas, es decir, el precio de la moneda esta barato, por ende hay una gran probabilidad de que cambie de tendencia para alcista. El RSI nos va a mostrar una barra verde para decirnos que es momento de comprar
RSI Based Automatic Supply and DemandA script that draws supply and demand zones based on the RSI indicator. For example if RSI is under 30 a supply zone is drawn on the chart and extended for as long as there isn't a new crossunder 30. Same goes for above 70. The threshold which by default is set to 30, which means 30 is added to 0 and subtracted from 100 to give us the classic 30/70 threshold on RSI, can be set in the indicator settings.
By only plotting the Demand Below Supply Above indicator you get automatic SD level that is updated every time RSI reaches either 30 or 70. If you plot the Resistance Zone / Support Zone you get an indicator that extends the zone instead of overwrite the earlier zone. Due to the zone being extended the chart can get a bit messy if there isn't a clear range going on.
There is also a "confirmation bars" setting where you can tell the script how many bars under over 30 / 70 you want before a zone is drawn.
Here is an image of only using the "Demand Below / Supply Above" plot.
As you can see, this could be useful "Price Flow" indicator, where we would only short if a zone appears below another zone, or long if two zones in a row are going up, like stairs.
RSI Swing Signal - ChartThis indicator is the chart version intended to accompany my custom RSI oscillator:
CLICK HERE TO SEE BASE INDICATOR
RSI AND SMOOTHED STOCH RSI TOGETHERi dont know pine script but here i used some free ones and merged them and modified some
especially smoothed stoch rsi is Good to decide when buy coz i modified it and when fast K value is over D value it changes color
visually better this way
also rsi is shown as area o histogram but if u dont like u can change to line
for stoch rsi i unclick xtrigger (d value) for better appearance
Rsi/Cci Overbought Oversold CandlesThis indicator will allow you to see overbought and oversold areas of the rsi or the cci, you must set yourself the upper and lower band of the rsi (70-30) or cci (100, -100). By default, it's Rsi
I have already posted the same indicator but only with the Rsi, I wanted to posted a more complete that offers the 2.
On the chart, it is the overbought / oversold area of the Cci that is displayed
RSI+Bollinger BandsThis is a simple RSI with applied Bollinger Bands. The BB may help spotting "hidden" divergences or "fake" divergences. For instance: in an uptrend we have a high followed by a higher high, the plain RSI shows a divergence, adding BB we see that the first (higher) RSI high is inside the BB, while the second (lower) RSI high is outside the bands, this would be a fake divergence.
The use of the indicator should be straightforward, for any questions feel free to write me a message
RSI-Histo-Entry_JDThis indicator shows a histogram of the RSI in relation to an ema of the RSI.
The histogram is then smoothed to give early reversal/entry signals.
The actual RSI line with oversold/overbought indication can be displayed or omitted, as preferred.
In addiction to the RSI line or as an alternative to it, the background colour can be set to change folowing the RSI signals.
JD.
RSI normalized by Bollinger BandsEnglish.
RSI indicator with Bollinger Bands in one. Forgot oversold and overbought!
With BB and RSI you can dinamically saw when RSI is in critical values. And when you can see figure 'M' or 'W' in oscillator it means that current movement of impulse is down.
Русский.
RSI и Ленты Боллинджера в одном. Забудьте о тупых линиях перекупленности и перепроданности!
При работе в связке вы можете определять эти зоны динамически. И при формировании фигуры 'M' или 'W' на осцилляторе будет четко показано, что текущий импульс умер, надо выходить из сделки.
Example of usage (exit points) / Пример использования (точки выхода)
RSI Donchian R1 Alerts by JustUncleLThis study is based on an idea by presented by RicardoSantos and JayRogers of using Donchian Channel (DC) on the RSI curve. The idea being that when RSI passes through the DC centre and touches the Highest/Lowest DC then price action tends to follow in the same direction and stay there until the RSI crosses DC centre line again.
This script expands on the original idea by including alert and exit signals based on the above rules. These alerts are also filtered by the rule: they must be within the Oversold and Overbought boundaries of the RSI.
There is also the option of applying MA smoothing to the RSI curve, the HullMA (8) is recommended (default).
Each Entry and Exit signal creates an Alertcondition that can be picked up by the TradingView Alarm system.
TIP: Remember this type of Trading technique only works well in a trending market. Do not try to trade this technique in a ranging/flat market.
KDJ & RSIRSI and KDJ indicator combined.
KDJ: Buy when J (purple) is going up and and crossing KD (orange) from below. Sell vise versa.
RSI: Overbought when RSI is over 70, oversold when RSI is under -10.
RSI comboTraditional RSI plus the adx and moment of rsi to show when rsi is exhausted (thick green and red line). Red and green circle indicate the swing (350 swing indicator) and the top and botton colored bars come from RSS (relative spread strength). When rsi is red or green and circles show up is a good signal. Do the last check at the bar color, better if wait until become silver
RSI-WMA + EMA Trend Filter | Signal OnlyThis is the specialized indicator representing the internal strategy created by RIO for the Trading Career 2025 Class.
Enjoy and have fun by using it if you feel the option being suitable for your trading!
RSI MACD Combined Color StrategyOverview
This indicator combines RSI and MACD signals to create a powerful visual trading system, inspired by TrendSpider's AI Strategy Coder examples. It colors candles based on the alignment of three key technical conditions, providing clear visual signals for potential trend strength and direction.
Technical Components
Core Conditions
RSI (Relative Strength Index) > 50
Indicates bullish momentum when price is trading above the centerline
Traditional indicator of trend strength
MACD Line > Signal Line
Shows positive momentum
Classic signal for potential upward movement
MACD Line > 0
Confirms bullish territory
Indicates overall positive momentum
Color Coding System
🟢 Green Candles: All three conditions are met
Strongest bullish signal
Suggests high probability trading opportunities
⚪ Grey Candles: One or two conditions are met
Neutral or transitioning market
Suggests caution or waiting for stronger confirmation
🔴 Red Candles: No conditions are met
Bearish signal
Suggests potential downward pressure
How to Use This Indicator
For Entry Signals
Look for transitions from red or grey to green candles
Green candles suggest strong bullish alignment
Consider entering long positions when candles turn green
For Exit Signals
Watch for color transitions from green to grey or red
Consider taking profits when candles change from green to grey
Consider stop losses when candles turn red
Risk Management
Use color transitions as part of your broader strategy
Don't rely solely on color changes for trading decisions
Combine with other technical analysis tools and risk management practices
Customizable Parameters
RSI Length (default: 14)
MACD Fast Length (default: 12)
MACD Slow Length (default: 26)
MACD Signal Length (default: 9)
Best Practices
Use multiple timeframes for confirmation
Look for confluences with support/resistance levels
Consider volume and market context
Start with default settings and adjust based on your trading style
Backtest different parameter combinations
Notes
This indicator works best in trending markets
Grey candles can indicate transition periods
Consider market conditions and volatility when interpreting signals
Credits
Inspired by TrendSpider's AI Strategy Coder examples and adapted for TradingView using Pine Script v5.
Disclaimer
This technical indicator is for informational purposes only. Always conduct your own analysis and consider risk management principles before making trading decisions. Past performance does not guarantee future results.
RSI/MFI Ultimate MAHello!
Today, I want to discuss a special indicator that I've developed. centers around a weighted moving average based on RSI/MFI.
1. Development Purpose
The primary goal of this indicator is to provide clearer insights into bullish and bearish signals in the market. It applies a weight to the RSI (Relative Strength Index) and MFI (Money Flow Index) values to offer more sensitive and predictive trend signals than traditional moving averages.
2. Usefulness
This indicator aids traders in identifying market volatility and bullish or bearish trends more easily. It is particularly responsive to market volatility, providing more accurate information for trading decisions.
3. Real-World Usage Examples
When applied to actual market data, this indicator clearly delineates bullish or bearish sections with its weighted moving average line. For instance, an upward trending moving average line indicates a bullish signal, while a downward trend suggests bearish momentum.
4. Meaning of Parameter Values
option: Allows choosing between RSI or MFI, each analyzing different market signals.
osc_len: Adjusting the oscillator length alters sensitivity.
ma_len: Setting the moving average length helps to modulate responsiveness to market fluctuations.
weight: Changing the weight fine-tunes the sensitivity of the moving average line.
By adjusting these parameters, the indicator can be customized to suit various market conditions.
Wishing you a successful trading day. Thank you!
RSI Box Strategy (pseudo- Grid Bot)This is a strategy intended primarily for algorithmic traders. It's a pseudo-grid bot that uses a dynamic, volume-weighted grid that only updates when the RSI meets certain conditions. It's also a breakout strategy, whereas normal grid bots are not (typical grid bots sell when a higher grid is reached, whereas this strategy sells when a lower grid is breached under specific conditions). This strategy also sells 100% of pyramiding orders on close.
In a nutshell, the strategy updates its grid to the volume-weighted highest/lowest values of your given source ("src" in the settings) each time that there is a RSI crossunder/crossover. From this range it produces an evenly-spaced grid of five lines, and uses the current source to determine which grid line is closest to the source. Then, if the source crosses over the line directly above the current line, it enters a buy order. If the source crosses under the line directly below the current line, it enters a sell order.
You can configure shorts, source, RSI length, and overbought/oversold levels in the settings.
For the strategy results below: fees are at 0.1% per trade, with order size 1% of equity and a max pyramiding value of 33. For a greater R/R profile, you can increase the order size, which will increase drawdown but potentially yield better results.
RSI + Fibonacci HH LL Support Resistance I have integrated my past scripts and brushed them up further.
This tool allows for support/resistance, stop loss, take profit, and trend analysis using RSI and Fibonacci ratios.
For example, the Fibonacci ratio is used as follows
l1 = m - dist * 0.618
l2 = m - dist * 1.618
l3 = m - dist * 2.618
l4 = m - dist * 4.235
l5 = m - dist * 6.857
l6 = m - dist * 11.089
When the Fibonacci ratio reaches 2.618 or higher and the RSI smoothed by the 5-day EMA is oversold/overbought, the bar color is changed by a gradation.
We have tried to make the design as beautiful and good-looking as possible. You can also hide the lines to suit your own preference.
Example usages are here:
BTCUSDT 1Hour Chart
Using Fibonacci numbers
BTCUSDT 15min Chart, for Scalping
Here, to set the highest and lowest prices one hour ago, "4" is substituted as the calculation: 15 minutes x 4 = 60
BTCUSDT 15min Chart, for Scalping
To set the highest and lowest prices 4 hours ago , "4" is substituted as the calculation: 15 minutes x 16 = 240
BTCUSDT 15min Chart, for Scalping
To draw yesterday's high and low as support/resistance lines, I substituted the number "96" as 1440/15=96.
BTCUSDT 1min Chart, for Scalping
Substituted "60" to trail the highest and lowest prices over a 60-minute period on a 1-minute chart, and removed lines to beautify
BTCUSDT 1day Chart, for Long-Term Investers
This is an example of using "90" because it is a 1-day chart and assumes that 3 months = 90 days in order to trail the highest and lowest prices over a 3-month period and no lines.
My past scripts are here:
RSI + FIB HH LL StopLoss Finder/Contrarian Trades
Fibonacci HH LL TRAMA Band
RSI Momentum Trend ScreenerIntroducing The RSI Momentum Trend Screener, to have the ability to scan 40 symbols at once
The screener is based on RSI Momentum Trend Indicator
It will show Positive Or Negative based on the symbol condition.
You can change the values on the screener, symbols, activate/disable symbols and change table position and color
RSI Divergence Screener by zdmreThis screener tracks the following for up to 20 assets:
-All selected tickers will be screened in same timeframes (as in the chart).
-Values in table indicate that how many days passed after the last Bullish or Bearish of RSI Divergence.
For example, when BTCUSDT appears Bullish-Days Ago (15) , Bitcoin has switched to a Bullish Divergence signal 15 days ago.
Thanks to @QuantNomad and @MUQWISHI for building the base for this screener.
*Use it at your own risk
Note:
Screener shows the information about the RSI Divergence Scanner by zdmre with default settings.
Based indicator:
RSI with Keltner Channel (+EMA Ribbon)Note that the EMA Ribbon is not embedded into the custom RSI with KC. In the future I plan to embed it. The EMA Ribbon I use is the following:
This is my very first attempt at modifying an indicator. I basically attempted to add a Keltner Channel around RSI.
This was used as an alternative channel to the standard Bollinger Band. KC goes hand-in-hand with the EMA Ribbon. KC also helps to better pinpoint relative-overbought/oversold conditions.
In my belief, the 20-80 levels don't behave as overbought/oversold levels. An exponential chart would always be overbought. So a Keltner Channel could in theory (and in practice) give us greater understanding on chart analysis.
This custom indicator is a bodge . It has lots of extra calculations that can be removed. I post this rough indicator for the community to give feedback on how I can improve it, or perhaps give an idea to some of you. Please don't judge me, I wouldn't post it but lately some have asked me about it.
In the future I would like to embed an EMA ribbon in this RSI indicator, just like I did in the following idea.
During this period, I don't really have the time to fix this indicator to my standards. So I will leave it as is for the foreseeable future.
If you have the will and knowledge however, feel free to built upon this indicator and share it!
Tread lightly, for this is hallowed ground.
-Father Grigori
PS. In this indicator, I would replace all the moving averages with an EMA Ribbon "average".