Penunjuk Pine Script®
Cari dalam skrip untuk "screener"
Divergence Screener [Trendoscope®]🎲Overview
The Divergence Screener is a powerful TradingView indicator designed to detect and visualize bullish and bearish divergences, including hidden divergences, between price action and a user-selected oscillator. Built with flexibility in mind, it allows traders to customize the oscillator type, trend detection method, and other parameters to suit various trading strategies. The indicator is non-overlay, displaying divergence signals directly on the oscillator plot, with visual cues such as lines and labels on the chart for easy identification.
This indicator is ideal for traders seeking to identify potential reversal or continuation signals based on price-oscillator divergences. It supports multiple oscillators, trend detection methods, and alert configurations, making it versatile for different markets and timeframes.
🎲Features
🎯Customizable Oscillator Selection
Built-in Oscillators : Choose from a variety of oscillators including RSI, CCI, CMO, COG, MFI, ROC, Stochastic, and WPR.
External Oscillator Support : Users can input an external oscillator source, allowing integration with custom or third-party indicators.
Configurable Length : Adjust the oscillator’s period (e.g., 14 for RSI) to fine-tune sensitivity.
🎯Divergence Detection
The screener identifies four types of divergences:
Bullish Divergence : Price forms a lower low, but the oscillator forms a higher low, signaling potential upward reversal.
Bearish Divergence : Price forms a higher high, but the oscillator forms a lower high, indicating potential downward reversal.
Bullish Hidden Divergence : Price forms a higher low, but the oscillator forms a lower low, suggesting trend continuation in an uptrend.
Bearish Hidden Divergence : Price forms a lower high, but the oscillator forms a higher high, suggesting trend continuation in a downtrend.
🎯Flexible Trend Detection
The indicator offers three methods to determine the trend context for divergence detection:
Zigzag : Uses zigzag pivots to identify trends based on higher highs (HH), higher lows (HL), lower highs (LH), and lower lows (LL).
MA Difference : Calculates the trend based on the difference in a moving average (e.g., SMA, EMA) between divergence pivots.
External Trend Signal : Allows users to input an external trend signal (positive for uptrend, negative for downtrend) for custom trend analysis.
🎯Zigzag-Based Pivot Analysis
Customizable Zigzag Length : Adjust the zigzag length (default: 13) to control the sensitivity of pivot detection.
Repaint Option : Choose whether divergence lines repaint based on the latest data or wait for confirmed pivots, balancing responsiveness and reliability.
🎯Visual and Alert Features
Divergence Visualization : Divergence lines are drawn between price pivots and oscillator pivots, color-coded for easy identification:
Bullish Divergence : Green
Bearish Divergence : Red
Bullish Hidden Divergence : Lime
Bearish Hidden Divergence : Orange
Labels and Tooltips : Labels (e.g., “D” for divergence, “H” for hidden) appear on price and oscillator pivots, with tooltips providing detailed information such as price/oscillator values, ratios, and pivot directions.
Alerts : Configurable alerts for each divergence type (bullish, bearish, bullish hidden, bearish hidden) trigger on bar close, ensuring timely notifications.
🎲 How It Works
🎯Oscillator Calculation
The indicator calculates the selected oscillator (or uses an external source) and plots it on the chart.
Oscillator values are stored in a map for reference during divergence calculations.
🎯Pivot Detection
A zigzag algorithm identifies pivots in the oscillator data, with configurable length and repainting options.
Price and oscillator pivots are compared to detect divergences based on their direction and ratio.
🎯Divergence Identification
The indicator compares price and oscillator pivot directions (HH, HL, LH, LL) to identify divergences.
Trend context is determined using the selected method (Zigzag, MA Difference, or External).
Divergences are classified as bullish, bearish, bullish hidden, or bearish hidden based on price-oscillator relationships and trend direction.
🎯Visualization and Alerts
Valid divergences are drawn as lines connecting price and oscillator pivots, with corresponding labels.
Alerts are triggered for allowed divergence types, providing detailed information via tooltips.
🎯Validation
Divergence lines are validated to ensure no intermediate bars violate the divergence condition, enhancing signal reliability.
🎲 Usage Instructions as Indicator
🎯Add to Chart:
Add the “Divergence Screener ” to your TradingView chart.
The indicator appears in a separate pane below the price chart, plotting the oscillator and divergence signals.
🎯Configure Settings:
Adjust the oscillator type and length to match your trading style.
Select a trend detection method and configure related parameters (e.g., MA type/length or external signal).
Set the zigzag length and repainting preference.
Enable/disable alerts for specific divergence types.
I🎯nterpret Signals:
Bullish Divergence (Green) : Look for potential buy opportunities in a downtrend.
Bearish Divergence (Red) : Consider sell opportunities in an uptrend.
Bullish Hidden Divergence (Lime) : Confirm continuation in an uptrend.
Bearish Hidden Divergence (Orange): Confirm continuation in a downtrend.
Use tooltips on labels to review detailed pivot and divergence information.
🎯Set Alerts:
Create alerts for each divergence type to receive notifications via TradingView’s alert system.
Alerts include detailed text with price, oscillator, and divergence information.
🎲 Example Scenarios as Indicator
🎯 With External Oscillator (Use MACD Histogram as Oscillator)
In order to use MACD as an oscillator for divergence signal instead of the built in options, follow these steps.
Load MACD Indicator from Indicator library
From Indicator settings of Divergence Screener, set Use External Oscillator and select MACD Histograme from the dropdown
You can now see that the oscillator pane shows the data of selected MACD histogram and divergence signals are generated based on the external MACD histogram data.
🎯 With External Trend Signal (Supertrend Ladder ATR)
Now let's demonstrate how to use external direction signals using Supertrend Ladder ATR indicator. Please note that in order to use the indicator as trend source, the indicator should return positive integer for uptrend and negative integer for downtrend. Steps are as follows:
Load the desired trend indicator. In this example, we are using Supertrend Ladder ATR
From the settings of Divergence Screener, select "External" as Trend Detection Method
Select the trend detection plot Direction from the dropdown. You can now see that the divergence signals will rely on the new trend settings rather than the built in options.
🎲 Using the Script with Pine Screener
The primary purpose of the Divergence Screener is to enable traders to scan multiple instruments (e.g., stocks, ETFs, forex pairs) for divergence signals using TradingView’s Pine Screener, facilitating efficient comparison and identification of trading opportunities.
To use the Divergence Screener as a screener, follow these steps:
Add to Favorites : Add the Divergence Screener to your TradingView favorites to make it available in the Pine Screener.
Create a Watchlist : Build a watchlist containing the instruments (e.g., stocks, ETFs, or forex pairs) you want to scan for divergences.
Access Pine Screener : Navigate to the Pine Screener via TradingView’s main menu: Products -> Screeners -> Pine, or directly visit tradingview.com/pine-screener/.
Select Watchlist : Choose the watchlist you created from the Watchlist dropdown in the Pine Screener interface.
Choose Indicator : Select Divergence Screener from the Choose Indicator dropdown.
Configure Settings : Set the desired timeframe (e.g., 1 hour, 1 day) and adjust indicator settings such as oscillator type, zigzag length, or trend detection method as needed.
Select Filter Criteria : Select the condition on which the watchlist items needs to be filtered. Filtering can only be done on the plots defined in the script.
Run Scan : Press the Scan button to display divergence signals across the selected instruments. The screener will show which instruments exhibit bullish, bearish, bullish hidden, or bearish hidden divergences based on the configured settings.
🎲 Limitations and Possible Future Enhancements
Limitations are
Custom input for oscillator and trend detection cannot be used in pine screener.
Pine screener has max 500 bars available.
Repaint option is by default enabled. When in repaint mode expect the early signal but the signals are prone to repaint.
Possible future enhancements
Add more built-in options for oscillators and trend detection methods so that dependency on external indicators is limited
Multi level zigzag support
Penunjuk Pine Script®

SIP Evaluator and Screener [Trendoscope®]The SIP Evaluator and Screener is a Pine Script indicator designed for TradingView to calculate and visualize Systematic Investment Plan (SIP) returns across multiple investment instruments. It is tailored for use in TradingView's screener, enabling users to evaluate SIP performance for various assets efficiently.
🎲 How SIP Works
A Systematic Investment Plan (SIP) is an investment strategy where a fixed amount is invested at regular intervals (e.g., monthly or weekly) into a financial instrument, such as stocks, mutual funds, or ETFs. The goal is to build wealth over time by leveraging the power of compounding and mitigating the impact of market volatility through disciplined, consistent investing. Here’s a breakdown of how SIPs function:
Regular Investments : In an SIP, an investor commits to investing a fixed sum at predefined intervals, regardless of market conditions. This consistency helps inculcate a habit of saving and investing.
Cost Averaging : By investing a fixed amount regularly, investors purchase more units when prices are low and fewer units when prices are high. This approach, known as dollar-cost averaging, reduces the average cost per unit over time and mitigates the risk of investing a large amount at a peak price.
Compounding Benefits : Returns generated from the invested amount (e.g., capital gains or dividends) are reinvested, leading to exponential growth over the long term. The longer the investment horizon, the greater the potential for compounding to amplify returns.
Dividend Reinvestment : In some SIPs, dividends received from the underlying asset can be reinvested to purchase additional units, further enhancing returns. Taxes on dividends, if applicable, may reduce the reinvested amount.
Flexibility and Accessibility : SIPs allow investors to start with small amounts, making them accessible to a wide range of individuals. They also offer flexibility in terms of investment frequency and the ability to adjust or pause contributions.
In the context of the SIP Evaluator and Screener , the script simulates an SIP by calculating the number of units purchased with each fixed investment, factoring in commissions, dividends, taxes and the chosen price reference (e.g., open, close, or average prices). It tracks the cumulative investment, equity value, and dividends over time, providing a clear picture of how an SIP would perform for a given instrument. This helps users understand the impact of regular investing and make informed decisions when comparing different assets in TradingView’s screener. It offers insights into key metrics such as total invested amount, dividends received, equity value, and the number of installments, making it a valuable resource for investors and traders interested in understanding long-term investment outcomes.
🎲 Key Features
Customizable Investment Parameters: Users can define the recurring investment amount, price reference (e.g., open, close, HL2, HLC3, OHLC4), and whether fractional quantities are allowed.
Commission Handling: Supports both fixed and percentage-based commission types, adjusting calculations accordingly.
Dividend Reinvestment: Optionally reinvests dividends after a user-specified period, with the ability to apply tax on dividends.
Time-Bound Analysis: Allows users to set a start year for the analysis, enabling historical performance evaluation.
Flexible Dividend Periods: Dividends can be evaluated based on bars, days, weeks, or months.
Visual Outputs: Plots key metrics like total invested amount, dividends, equity value, and remainder, with customizable display options for clarity in the data window and chart.
🎲 Using the script as an indicator on Tradingview Supercharts
In order to use the indicator on charts, do the following.
Load the instrument of your choice - Preferably a stable stocks, ETFs.
Chose monthly timeframe as lower timeframes are insignificant in this type of investment strategy
Load the indicator SIP Evaluator and Screener and set the input parameters as per your preference.
Indicator plots, investment value, dividends and equity on the chart.
🎲 Visualizations
Installments : Displays the number of SIP installments (gray line, visible in the data window).
Invested Amount : Shows the cumulative amount invested, excluding reinvested dividends (blue area plot).
Dividends : Tracks total dividends received (green area plot).
Equity : Represents the current market value of the investment based on the closing price (purple area plot).
Remainder : Indicates any uninvested cash after each installment (gray line, visible in the data window).
🎲 Deep dive into the settings
The SIP Evaluator and Screener offers a range of customizable settings to tailor the Systematic Investment Plan (SIP) simulation to your preferences. Below is an explanation of each setting, its purpose, and how it impacts the analysis:
🎯 Duration
Start Year (Default: 2020) : Specifies the year from which the SIP calculations begin. When Start Year is enabled via the timebound option, the script only considers data from the specified year onward. This is useful for analyzing historical SIP performance over a defined period. If disabled, the script uses all available data.
Timebound (Default: False) : A toggle to enable or disable the Start Year restriction. When set to False, the SIP calculation starts from the earliest available data for the instrument.
🎯 Investment
Recurring Investment (Default: 1000.0) : The fixed amount invested in each SIP installment (e.g., $1000 per period). This represents the regular contribution to the SIP and directly influences the total invested amount and quantity purchased.
Allow Fractional Qty (Default: True) : When enabled, the script allows the purchase of fractional units (e.g., 2.35 shares). If disabled, only whole units are purchased (e.g., 2 shares), with any remaining funds carried forward as Remainder. This setting impacts the precision of investment allocation.
Price Reference (Default: OPEN): Determines the price used for purchasing units in each SIP installment. Options include:
OPEN : Uses the opening price of the bar.
CLOSE : Uses the closing price of the bar.
HL2 : Uses the average of the high and low prices.
HLC3 : Uses the average of the high, low, and close prices.
OHLC4 : Uses the average of the open, high, low, and close prices. This setting affects the cost basis of each purchase and, consequently, the total quantity and equity value.
🎯 Commission
Commission (Default: 3) : The commission charged per SIP installment, expressed as either a fixed amount (e.g., $3) or a percentage (e.g., 3% of the investment). This reduces the amount available for purchasing units.
Commission Type (Default: Fixed) : Specifies how the commission is calculated:
Fixed ($) : A flat fee is deducted per installment (e.g., $3).
Percentage (%) : A percentage of the investment amount is deducted as commission (e.g., 3% of $1000 = $30). This setting affects the net amount invested and the overall cost of the SIP.
🎯 Dividends
Apply Tax On Dividends (Default: False) : When enabled, a tax is applied to dividends before they are reinvested or recorded. The tax rate is set via the Dividend Tax setting.
Dividend Tax (Default: 47) : The percentage of tax deducted from dividends if Apply Tax On Dividends is enabled (e.g., 47% tax reduces a $100 dividend to $53). This reduces the amount available for reinvestment or accumulation.
Reinvest Dividends After (Default: True, 2) : When enabled, dividends received are reinvested to purchase additional units after a specified period (e.g., 2 units of time, defined by Dividends Availability). If disabled, dividends are tracked but not reinvested. Reinvestment increases the total quantity and equity over time.
Dividends Availability (Default: Bars) : Defines the time unit for evaluating when dividends are available for reinvestment. Options include:
Bars : Based on the number of chart bars.
Weeks : Based on weeks.
Months : Based on months (approximated as 30.5 days). This setting determines the timing of dividend reinvestment relative to the Reinvest Dividends After period.
🎯 How Settings Interact
These settings work together to simulate a realistic SIP. For example, a $1000 recurring investment with a 3% commission and fractional quantities enabled will calculate the number of units purchased at the chosen price reference after deducting the commission. If dividends are reinvested after 2 months with a 47% tax, the script fetches dividend data, applies the tax, and adds the net dividend to the investment amount for that period. The Start Year and Timebound settings ensure the analysis aligns with the desired timeframe, while the Dividends Availability setting fine-tunes dividend reinvestment timing.
By adjusting these settings, users can model different SIP scenarios, compare performance across instruments in TradingView’s screener, and gain insights into how commissions, dividends, and price references impact long-term returns.
🎲 Using the script with Pine Screener
The main purpose of developing this script is to use it with Tradingview Pine Screener so that multiple ETFs/Funds can be compared.
In order to use this as a screener, the following things needs to be done.
Add SIP Evaluator and Screener to your favourites (Required for it to be added in pine screener)
Create a watch list containing required instruments to compare
Open pine screener from Tradingview main menu Products -> Screeners -> Pine or simply load the URL - www.tradingview.com
Select the watchlist created from Watchlist dropdown.
Chose the SIP Evaluator and Screener from the "Choose Indicator" dropdown
Set timeframe to 1 month and update settings as required.
Press scan to display collected data on the screener.
🎲 Use Case
This indicator is ideal for educational purposes, allowing users to experiment with SIP strategies across different instruments. It can be applied in TradingView’s screener to compare SIP performance for stocks, ETFs, or other assets, helping users understand how factors like commissions, dividends, and price references impact returns over time.
Penunjuk Pine Script®

Waterfall ScreenerHow to Use This to Screen Stocks: A Step-by-Step Guide
Save the Screener Script: Open the Pine Editor, paste the code above, and save it with a clear name like "Waterfall Screener".
Open the Stock Screener: Go to the TradingView homepage or any chart page and click the "Screener" tab at the bottom. Make sure you are on the "Stock" screener.
Set Your Market: Choose the market you want to scan (e.g., NASDAQ, NYSE).
Add Your Custom Filter (The Magic Step):
Click the "Filters" button on the right side of the screener panel.
In the search box that appears, type the name of your new script: "Waterfall Screener".
It will appear as a selectable filter. Click it.
Configure the Filter:
A new filter will appear in your screener list named "Waterfall Screener".
You can now set conditions for the "ScreenerSignal" value we plotted.
To find stocks with a new, actionable trade plan, set the filter to:
Waterfall Screener | Equal | 1
Refine and Scan:
Add other essential filters to reduce noise, such as:
Volume > 1M (to find liquid stocks)
Market Cap > 1B (to find established companies)
The screener will now automatically update and show you a list of all stocks that currently have a "PENDING_ENTRY" setup according to the indicator's logic and your chosen timeframe (e.g., Daily).
Penunjuk Pine Script®
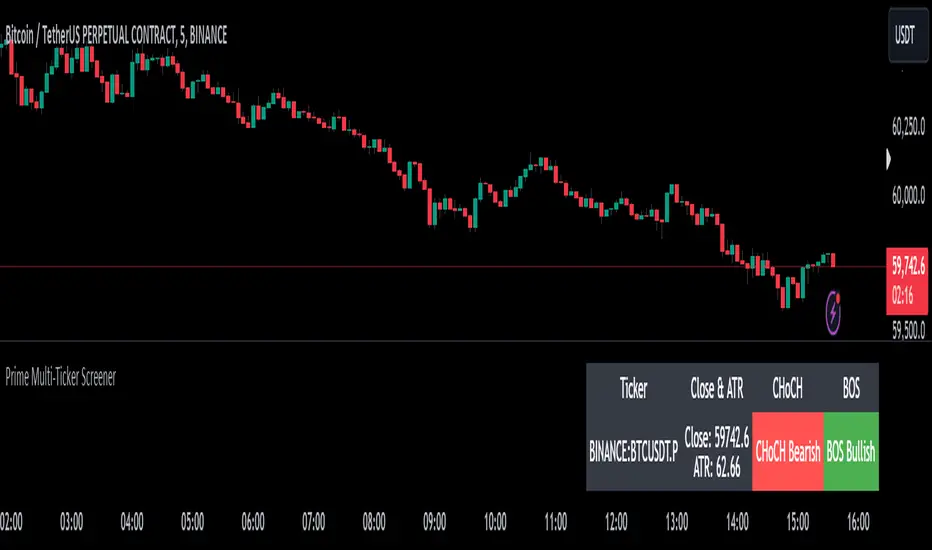
Prime Multi-Ticker Screener: Real-Time Market StructurePrime Multi-Ticker Screener: Real-Time Market Structure and Trend Detection Tool
Prime Multi-Ticker Screener is designed to track multiple tickers simultaneously, providing real-time insights into market trends and structure changes such as CHoCH (Change of Character) and BOS (Break of Structure). This tool is perfect for traders looking to monitor multiple assets across different timeframes while receiving clear signals that highlight critical market shifts. The indicator delivers instant visual feedback with color-coded backgrounds to make interpreting signals easy and efficient.
Core Features of Prime Multi-Ticker Screener
Multi-Ticker Monitoring: Track up to 5 tickers across multiple timeframes in a single dashboard. This makes it easy to watch several assets at once without cluttering your chart.
CHoCH and BOS Detection: The screener automatically detects and highlights significant market structure shifts. CHoCH signals are shown when a trend reverses or consolidates, while BOS signals indicate a break in previous highs or lows, helping traders catch potential trend reversals early.
Color-Coded Visuals: The background of each signal cell dynamically changes color to represent bullish or bearish signals. Green indicates bullish activity, while red highlights bearish market shifts, making it easy for traders to identify key movements at a glance.
Close Price and ATR Data: For each ticker, the screener displays both the current close price and the 14-period Average True Range (ATR), providing important volatility information to support decision-making.
Detailed Explanation of How Prime Multi-Ticker Screener Works
Prime Multi-Ticker Screener combines trend detection with real-time market structure analysis to deliver comprehensive market insights. It analyzes the following components:
CHoCH Detection: Change of Character occurs when the market switches from trending to ranging or vice versa. This indicator catches these moments by identifying when prices cross pivot levels, providing traders with a valuable signal of potential market phase changes.
BOS Detection: The Break of Structure function highlights moments when the price breaks a significant high or low, often indicating the start of a new trend or the continuation of an existing one.
Close Price & ATR Monitoring: Alongside market structure signals, the screener provides real-time data on the close price and the Average True Range (ATR), ensuring traders have a complete picture of the price and volatility landscape for each asset they are tracking.
Why It's Useful for Traders
Prime Multi-Ticker Screener is a versatile tool that offers substantial benefits to traders who want to stay informed about multiple assets and trends simultaneously:
Comprehensive Monitoring: Track multiple assets in real time, all from a single indicator. Whether you trade crypto, forex, or stocks, this tool helps you stay on top of market movements across different assets and timeframes.
Market Structure Analysis: The automatic detection of CHoCH and BOS signals gives traders an edge by identifying potential reversals and trend continuations as they happen, allowing for more timely and informed trading decisions.
Efficient and Intuitive Design: The screener is designed with simplicity in mind. The color-coded backgrounds quickly alert traders to market structure shifts without overwhelming them with data, making it ideal for those who need to act fast.
How It Works: Practical Usage
Prime Multi-Ticker Screener is ideal for:
Day traders: The real-time tracking of multiple assets allows day traders to quickly spot trading opportunities across different markets.
Swing traders: CHoCH and BOS detection help swing traders catch key market structure shifts, helping them align trades with emerging trends.
Trend followers: The screener provides instant feedback on when a trend is continuing or breaking, helping trend-following traders maintain their positions or exit early when needed.
By combining multiple key metrics—price, volatility, and market structure—Prime Multi-Ticker Screener ensures traders are well-equipped to manage their positions across a variety of assets.
Risk Disclaimer
While Prime Multi-Ticker Screener provides valuable market insights, it's important to remember:
Past performance is not indicative of future results: This screener provides analysis based on historical data, and no indicator can predict future market movements with certainty.
Market Conditions: The effectiveness of Prime Multi-Ticker Screener may vary in different market conditions, so traders should always use proper risk management when trading.
Trading Risks: Like any trading tool, Prime Multi-Ticker Screener should be used as part of a comprehensive trading strategy, including risk management techniques such as stop-loss orders and position sizing.
Penunjuk Pine Script®
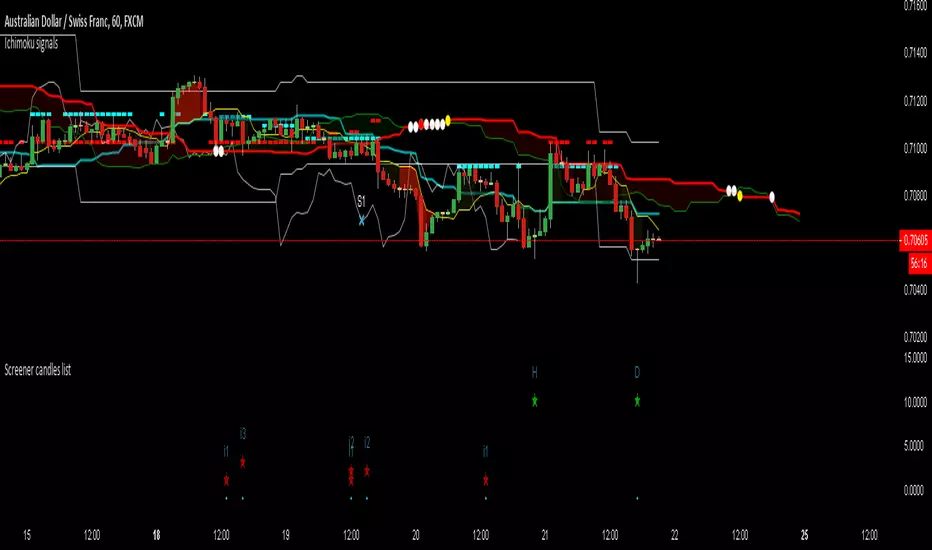
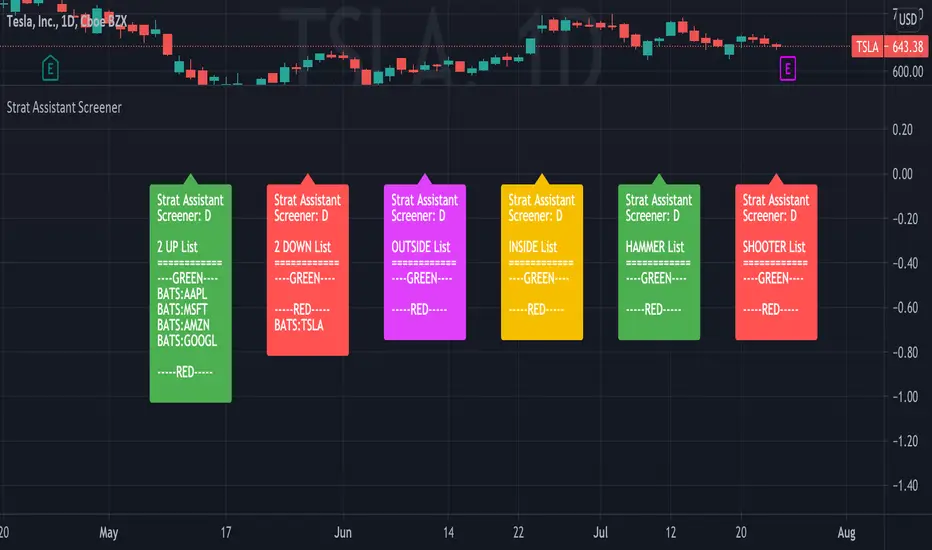
Strat Assistant Screener MiniStrat Assistant Screener Mini
----------------------------
█ OVERVIEW
This script is intended to provide screening/scanning functionality for the strat for the time period provided in the input (Day is the default).
When added, the script provides a chart with labels separated for each type of candle (2 up, 2 down, outside, inside) as well as actionable signals (inside already provided, hammer, shooter). This script functions the same way as the other strat assistant screener however is limited to 5 tickers and is used more for intraday trading and speed.
█ DETAIL
Inputs
----------
Security/Screener Time Frame: The screener will only run for one time frame, the time frame selected and this can be changed
Actionable Wick Percentage: The percentage of the WICK to determine a hammer or a shooter. For example, the default is .75 or 75%, which means 75% of the candle must be a WICK (top wick 75% for shooter, bottom wick 75% for hammer). If you wish to be more conservative scale it down or more aggressive scale it up
Label Index Offset Factor: There are 6 separate labels that will appear at the bottom separated by this indicator. If you feel like things are too tight or too narrow you can adjust this to spread things out further, or push them closer together.
Security/SXX: The various securities that can be input to track. If you find this is a pain, you can always copy the source code, put it in the pine editor yourself, and manually modify them there. This is the mini version limited to 5 stocks for performance and intraday trading.
Outputs
----------
The screener will provide a second chart at the bottom of the primary chart with labels for the types of candles and actionable signals
Each label will be present even if no results are found.
The label will display the time frame selected toward the end of the header - Strat Assistant Screener:
Each label is colored for quick reference to indicate the various bull/bear/inside/outside "patterns"
Best Practices
----------
While it's limited, it's still not instant. So give it time.
This screener is best used for intraday. If you want something with more data, try the the non mini versino.
The bottom chart can be scaled and moved just like the top one, play around with it to determine what works best for you. I recommend decreasing the scale and then moving it up so you can see it better.
When the time frame is changed, it will take a minute, you can verify the results by seeing the time frame change in the label - Strat Assistant Screener:
I have not played with this thoroughly intraday yet. So it may be buggy/slower.
Penunjuk Pine Script®
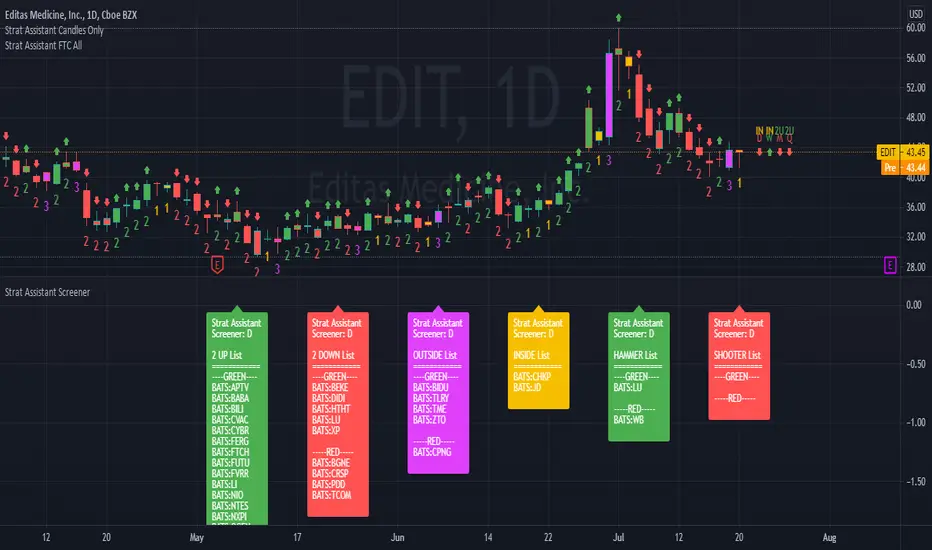
Strat Assistant ScreenerStrat Assistant Screener
----------------------------
█ OVERVIEW
This script is intended to provide screening/scanning functionality for the strat for the time period provided in the input (Day is the default).
When added, the script provides a chart with labels separated for each type of candle (2 up, 2 down, outside, inside) as well as actionable signals (inside already provided, hammer, shooter). Trading view is limited to 40 "security/ticker/symbol" calls so only 40 at a time are available. It's best to run this on higher time frames as it will occasionally push peak trading view memory limits and throw an error. Various inputs are provided a detailed below. It's not FAST so be patient please.
█ DETAIL
Inputs
----------
Security/Screener Time Frame: The screener will only run for one time frame, the time frame selected and this can be changed
Actionable Wick Percentage: The percentage of the WICK to determine a hammer or a shooter. For example, the default is .75 or 75%, which means 75% of the candle must be a WICK (top wick 75% for shooter, bottom wick 75% for hammer). If you wish to be more conservative scale it down or more aggressive scale it up
Label Index Offset Factor: There are 6 separate labels that will appear at the bottom separated by this indicator. If you feel like things are too tight or too narrow you can adjust this to spread things out further, or push them closer together.
Security/SXX: The various securities that can be input to track. If you find this is a pain, you can always copy the source code, put it in the pine editor yourself, and manually modify them there. Trading view limits you to 40 securities/symbols/tickers so I've pushed the limit as far as I can with this script.
Outputs
----------
The screener will provide a second chart at the bottom of the primary chart with labels for the types of candles and actionable signals
Each label will be present even if no results are found.
The label will display the time frame selected toward the end of the header - Strat Assistant Screener:
Each label is colored for quick reference to indicate the various bull/bear/inside/outside "patterns"
Best Practices
----------
It is not fast, so please be patient and let it run.
This screener is best used as a utility a few times a day, not recommended for intraday. I will create a scaled down version of this will only 5 securities/symbols/tickers that can be used intraday.
The screener pushes the limits of training views provided memory, so you may occasionally see errors, please try a higher time frame.
The bottom chart can be scaled and moved just like the top one, play around with it to determine what works best for you. I recommend decreasing the scale and then moving it up so you can see it better.
When the time frame is changed, it will take a minute, you can verify the results by seeing the time frame change in the label - Strat Assistant Screener:
I have not played with this thoroughly intraday yet. So it may be buggy/slower.
Penunjuk Pine Script®
ICT Market Structure Screener (Zeiierman)█ Overview
The ICT Market Structure Screener (Zeiierman) is designed to identify and display key market structure levels and patterns based on Smart Money Concepts. It highlights bullish and bearish structures, premium and discount levels, and generates alerts for significant market structure changes, making it a valuable tool for traders looking to understand institutional trading behaviors and market trends. A key feature of this indicator is its screener function, which allows traders to monitor multiple symbols simultaneously. This feature provides a consolidated view of the market structure for various assets, making it easier to identify trading opportunities across a diverse portfolio.
█ How It Works
The ICT Market Structure Screener operates by identifying high and low pivot points within a specified period, then analyzing these pivots to determine changes in market structure. The indicator tracks price movements and categorizes them into bullish or bearish structures, indicating potential trend reversals or continuations. By plotting premium and discount levels, it helps traders identify overbought and oversold conditions. The indicator also provides real-time updates and alerts for significant changes in the market structure.
█ Terminology
ChoCH (Change of Character): Indicates a potential reversal in market direction. It is identified when the price breaks a significant high or low, suggesting a shift from a bullish to bearish trend or vice versa.
SMS (Smart Money Shift): Represents the transition phase in market structure where smart money begins accumulating or distributing assets. It typically follows a BMS and indicates the start of a new trend.
BMS (Bullish/Bearish Market Structure): Confirms the trend direction. Bullish Market Structure (BMS) confirms an uptrend, while Bearish Market Structure (BMS) confirms a downtrend. It is characterized by a series of higher highs and higher lows (bullish) or lower highs and lower lows (bearish).
Premium: A zone where the price is considered overbought. It is calculated as the upper range of the current market structure and indicates a potential area for selling or shorting.
Mid Range: The midpoint between the high and low of the market structure. It often acts as a support or resistance level, helping traders identify potential reversal or continuation points.
Discount: A zone where the price is considered oversold. It is calculated as the lower range of the current market structure and indicates a potential area for buying or going long.
█ How to Use
The ICT Market Structure Screener allows traders to follow smart money moves in the market more effectively. By identifying key market levels and monitoring bullish and bearish structures, traders can easily spot trend changes and strong trends. The indicator's premium and discount levels help identify overbought and oversold conditions, providing valuable entry and exit points. Alerts for ChoCH, SMS, and BMS keep traders informed about significant market changes, enabling real-time adjustments to trading strategies.
The screener functionality is particularly valuable for monitoring multiple markets simultaneously. The screener table displays critical information such as current price, trend direction, signal type, and premium/discount levels for each symbol. This makes it easier to track the market structure of various assets at a glance and quickly identify trading opportunities across different markets.
Example Strategies:
⚪ Trend Following: Use the indicator to identify the current market trend (bullish or bearish) and trade in the direction of the trend. Enter trades on pullbacks to premium (for shorts) or discount (for longs) levels.
⚪ Reversal Trading: Look for ChoCH signals to identify potential trend reversals. Enter trades when the price breaks a significant high or low and confirms a change in market structure, or wait for a retest of the nearest Orderblock that was formed.
⚪ Support and Resistance: Utilize the mid-range, premium, and discount levels as support and resistance zones. Enter trades when the price approaches these levels and shows signs of reversal or continuation.
⚪ Multi-Symbol Analysis: Use the screener table to monitor multiple symbols and quickly assess their market structure. This helps in diversifying trading opportunities and managing a portfolio of assets efficiently.
█ Settings
Period: The pivot period for calculating the structure. Increasing the period captures broader trends, making the structure more representative of long-term movements. Decreasing the period focuses on shorter-term trends, increasing sensitivity.
Response: Enabling this option uses the response period instead of the pivot period, providing more flexibility in capturing short-term or long-term structures. The period for the response, which determines the structure's sensitivity. Increasing the response period smoothens the structure, making it less reactive to short-term fluctuations. Decreasing the response period makes the structure more responsive to short-term changes.
Structure Display: Choose between displaying the active range or the previous range. 'Active Range' shows real-time premium, discount, and mid-range levels based on the current structure. 'Previous Range' displays past ranges, useful for analyzing historical support/resistance levels.
Ticker Symbols: List of symbols to include in the screener. Enabling the option includes the symbol in the screener, allowing the user to track its structure. Disabling it excludes the symbol from the screener, reducing the number of tracked symbols.
-----------------
Disclaimer
The information contained in my Scripts/Indicators/Ideas/Algos/Systems does not constitute financial advice or a solicitation to buy or sell any securities of any type. I will not accept liability for any loss or damage, including without limitation any loss of profit, which may arise directly or indirectly from the use of or reliance on such information.
All investments involve risk, and the past performance of a security, industry, sector, market, financial product, trading strategy, backtest, or individual's trading does not guarantee future results or returns. Investors are fully responsible for any investment decisions they make. Such decisions should be based solely on an evaluation of their financial circumstances, investment objectives, risk tolerance, and liquidity needs.
My Scripts/Indicators/Ideas/Algos/Systems are only for educational purposes!
Penunjuk Pine Script®

NLS - 52W High Screener (3, 5, 7 Days)This indicator automatically detects stocks that have reached a new 52-week high within the last 3, 5, or 7 days. Perfect for traders looking for breakouts and strong momentum stocks!
📊 Features:
✅ Identifies new 52-week highs within the last 3, 5, or 7 days
✅ Fully Screener-compatible – Easily filter stocks in the TradingView Screener
✅ Plots the 52-week high as a blue line in the chart for better visualization
✅ Built-in alerts to notify you when a new 52W high is reached
✅ Optimized for the 1D (daily) timeframe
🛠️ How to Use in the Screener:
1️⃣ Add & activate the indicator
2️⃣ Open the TradingView Screener
3️⃣ Filter using one of these columns:
Screener 52W High Last 3 Days
Screener 52W High Last 5 Days
Screener 52W High Last 7 Days
4️⃣ Set the filter to "is true" to see relevant stocks
📢 Alerts:
Get notified when a stock reaches a new 52-week high in the last 3, 5, or 7 days!
🔍 Ideal for:
✔ Trend-following & breakout traders 🚀
✔ Swing traders looking for strong stocks 📈
✔ Screener users searching for momentum setups
Penunjuk Pine Script®

Breaker Blocks Screener | Flux Charts💎 GENERAL OVERVIEW
Introducing our new Breaker Blocks Screener! This screener can provide information about the latest breaker blocks in up to 5 tickers. You can also customize the algorithm that finds the breaker blocks and the styling of the screener.
Features of the new Breaker Blocks Screener :
Find Latest Breaker Blocks Accross 5 Tickers
Latest Status, Restests & Volume
Customizable Algoritm / Styling
📌 HOW DOES IT WORK ?
Breaker blocks form when an order block fails, or "breaks". It is often associated with market going in the opposite direction of the broken order block, and they can be spotted by following order blocks and finding the point they get broken, ie. price goes below a bullish order block.
The volume of a breaker block is simply the total volume of the bar that the original order block is broken. Often the higher the breaking bar's volume, the stronger the breaker block is.
This screener then finds breaker blocks accross 5 different tickers, and shows the latest information about them.
Status ->
Far -> The current price is far away from the breaker block.
Approaching ⬆️/⬇️ -> The current price is approaching the breaker block, and the direction it's approaching from.
Inside -> The price is currently inside the breaker block.
Retests -> Retest means the price to invalidate the breaker block, but failed to do so. Here you can see how many times the price retested the breaker block.
For the volume, check the top of the "How Does It Work" section.
🚩UNIQUENESS
This screener can detect latest breaker blocks and give information about them for up to 5 tickers. This saves the user time by showing them all in a dashboard at the same time. The screener shows the number of the retests of the breaker block as an unique trait. Another unique ability of the screener is that it shows the latest valid breaker block's volume in the dashboard.
⚙️SETTINGS
1. Tickers
You can set up to 5 tickers for the screener to scan breaker blocks here. You can also enable / disable them and set their individual timeframes.
2. General Configuration
Zone Invalidations -> Select between Wick & Close price for Order & Breaker Block Invalidation.
Swing Length -> Swing length is used when finding order block formations. Smaller values will result in finding smaller order blocks.
Penunjuk Pine Script®

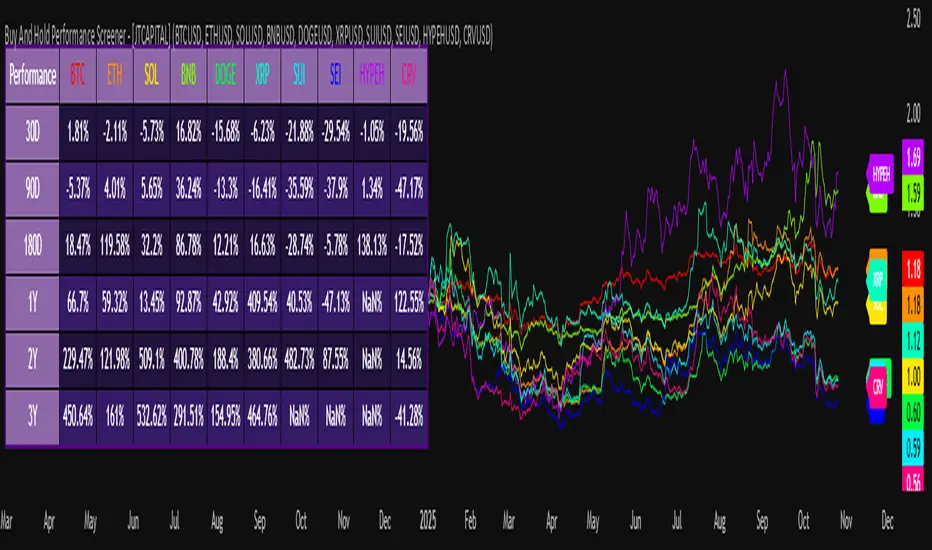
ATR OSC and Volume Screener (ATROSCVS)In today's world of trading, having the right tools and indicators can make all the difference. With the vast number of cryptocurrencies available, I've found it challenging to keep track of the market's overall direction and make informed decisions. That's where the ATR OSC and Volume Screener comes in, a powerful Pine Script that I use to identify potential trading opportunities across multiple cryptocurrencies, all in one convenient place.
This script combines two essential components: the ATR Oscillator (ATR OSC) and a Volume Screener. It is designed to work with the TradingView platform. Let me explain how this script works and how it benefits my trading.
Firstly, the ATR Oscillator is an RSI-like oscillator that performs better under longer lookback periods. Unlike traditional RSI, the ATR OSC doesn't lose its min and max ranges with a long lookback period, as the scale remains intact. It calculates the true range by considering the high, low, open, and close prices of a financial instrument, and uses this true range instead of the standard deviation in a modified z-score calculation. This unique approach helps provide a more precise assessment of the market's volatility.
The Volume Screener, on the other hand, helps me identify unusual trading volumes across various cryptocurrencies. It employs a normalized volume calculation method, effectively filtering out outliers and highlighting potentially significant trading opportunities.
One feature I find particularly impressive about the ATR OSC and Volume Screener is its versatility and the way it displays information using color gradients. With support for over 30 different cryptocurrencies, including popular options like Bitcoin (BTC), Ethereum (ETH), Ripple (XRP), and Dogecoin (DOGE), I can monitor a wide range of markets simultaneously. The color gradient on the grid is visually appealing and makes it easy to identify the strength of the indicators for each cryptocurrency, allowing me to make quick comparisons and spot potential trading opportunities.
The customizable input options allow me to fine-tune the script to suit my individual trading preferences and strategies. In summary, the ATR OSC and Volume Screener has been an invaluable tool for me as I navigate the ever-evolving world of cryptocurrencies. By combining the power of the ATR Oscillator with a robust Volume Screener, this Pine Script makes it easier than ever to identify promising trading opportunities and stay ahead of the game.
The color gradient in the ATR OSC and Volume Screener is essential for visually representing the data on the heatmap. It uses a range of colors to indicate the strength of the indicators for each cryptocurrency, making it easier to understand the market dynamics at a glance.
In the heatmap, the color gradient typically starts from a cooler color, such as blue or green, at the lower extremes (low ATR OSC values) and progresses towards warmer colors, like yellow, orange, or red, as the ATR OSC values approach the upper extremes (high ATR OSC values). This color-coding system enables me to quickly identify and interpret the data without having to examine individual numerical values.
For example, cooler colors (blue or green) might represent lower values of the ATR Oscillator, suggesting oversold conditions in the respective cryptocurrencies. On the other hand, warmer colors (yellow, orange, or red) indicate higher ATR OSC values, signaling overbought market conditions. This visual representation allows me to make rapid comparisons between different cryptocurrencies and spot potential trading opportunities more efficiently.
By utilizing the color gradient in the heatmap, the ATR OSC and Volume Screener simplifies the analysis of multiple cryptocurrencies, helping me to quickly identify market trends and make better-informed trading decisions.
I highly recommend testing the ATR OSC and Volume Screener and seeing the difference it can make in your trading decisions. Happy trading!
Penunjuk Pine Script®

PEAD ScreenerPEAD Screener - Post-Earnings Announcement Drift Scanner
═══════════════════════════════════════════════════════════════
WHY EARNINGS ANNOUNCEMENTS CREATE OPPORTUNITY
═══════════════════════════════════════════════════════════════
The days immediately following an earnings announcement are among the noisiest periods for any stock. Within hours, the market must digest new information about a company's profits, revenue, and future outlook. Analysts scramble to update their models. Institutions rebalance positions. Retail traders react to headlines.
This chaos creates a well-documented phenomenon called Post-Earnings Announcement Drift (PEAD): stocks that beat expectations tend to keep rising, while those that miss tend to keep falling - often for weeks after the initial announcement. Academic research has confirmed this pattern persists across decades and markets.
But not every earnings surprise is equal. A company that beats estimates by 5 cents might move very differently than one that beats by 5 cents with unusually high volume, or one where both earnings AND revenue exceeded expectations. Raw numbers alone don't tell the full story.
═══════════════════════════════════════════════════════════════
HOW "STANDARDIZED UNEXPECTED" METRICS CUT THROUGH THE NOISE
═══════════════════════════════════════════════════════════════
This screener uses a statistical technique to measure how "surprising" a result truly is - not just whether it beat or missed, but how unusual that beat or miss was compared to the company's own history.
The core idea: convert raw surprises into Z-scores.
A Z-score answers the question: "How many standard deviations away from normal is this result?"
- A Z-score of 0 means the result was exactly average
- A Z-score of +2 means the result was unusually high (better than ~95% of historical results)
- A Z-score of -2 means the result was unusually low
By standardizing surprises this way, we can compare apples to apples. A small-cap biotech's $0.02 beat might actually be more significant than a mega-cap's $0.50 beat, once we account for each company's typical variability.
This screener applies this standardization to three dimensions: earnings (SUE), revenue (SURGE), and volume (SUV).
═══════════════════════════════════════════════════════════════
THE 9 SCREENING CRITERIA
═══════════════════════════════════════════════════════════════
─────────────────────────────────────────
1. SUE (Standardized Unexpected Earnings)
─────────────────────────────────────────
WHAT IT IS:
SUE measures how surprising an earnings result was, adjusted for the company's historical forecast accuracy.
Calculation: Take the earnings surprise (actual EPS minus analyst estimate), then divide by the standard deviation of past forecast errors. This uses a rolling window of the last 8 quarters by default.
Formula: SUE = (Actual EPS - Estimated EPS) / Standard Deviation of Past Errors
HOW TO INTERPRET:
- SUE > +2.0: Strongly positive surprise - earnings beat expectations by an unusually large margin. These stocks often continue drifting higher.
- SUE between 0 and +2.0: Modest positive surprise - beat expectations, but within normal range.
- SUE between -2.0 and 0: Modest negative surprise - missed expectations, but within normal range.
- SUE < -2.0: Strongly negative surprise - significant miss. These stocks often continue drifting lower.
For long positions, look for SUE values above +2.0, ideally combined with positive SURGE.
─────────────────────────────────────────
2. SURGE (Standardized Unexpected Revenue)
─────────────────────────────────────────
WHAT IT IS:
SURGE applies the same standardization technique to revenue surprises. While earnings can be manipulated through accounting choices, revenue is harder to fake - it represents actual sales.
Calculation: Take the revenue surprise (actual revenue minus analyst estimate), then divide by the standard deviation of past revenue forecast errors.
Formula: SURGE = (Actual Revenue - Estimated Revenue) / Standard Deviation of Past Errors
HOW TO INTERPRET:
- SURGE > +1.5: Strongly positive revenue surprise - the company sold significantly more than expected.
- SURGE between 0 and +1.5: Modest positive surprise.
- SURGE < 0: Revenue missed expectations.
The most powerful signals occur when BOTH SUE and SURGE are positive and elevated (ideally SUE > 2.0 AND SURGE > 1.5). This indicates the company beat on both profitability AND top-line growth - a much stronger signal than either alone.
When SUE and SURGE diverge significantly (e.g., high SUE but negative SURGE), treat with caution - the earnings beat may have come from cost-cutting rather than genuine growth.
─────────────────────────────────────────
3. SUV (Standardized Unexpected Volume)
─────────────────────────────────────────
WHAT IT IS:
SUV detects unusual trading volume after accounting for how volatile the stock is. More volatile stocks naturally have higher volume, so raw volume comparisons can be misleading.
Calculation: This uses regression analysis to model the expected relationship between price volatility and volume. The "unexpected" volume is the residual - how much actual volume deviated from what the model predicted. This residual is then standardized into a Z-score.
In plain terms: SUV asks "Given how much this stock typically moves, is today's volume unusually high or low?"
HOW TO INTERPRET:
- SUV > +2.0: Exceptionally high volume relative to the stock's volatility. This often signals institutional activity - big players moving in or out.
- SUV between +1.0 and +2.0: Elevated volume - above normal interest.
- SUV between -1.0 and +1.0: Normal volume range.
- SUV < -1.0: Unusually quiet - less activity than expected.
High SUV combined with positive price movement suggests accumulation (buying). High SUV combined with negative price movement suggests distribution (selling).
─────────────────────────────────────────
4. % From D0 Close
─────────────────────────────────────────
WHAT IT IS:
This measures how far the current price has moved from the closing price on its initial earnings reaction day (D0). The "reaction day" is the first trading day that fully reflects the earnings news - typically the day after an after-hours announcement, or the announcement day itself for pre-market releases.
Calculation: ((Current Price - D0 Close) / D0 Close) × 100
HOW TO INTERPRET:
- Positive values: Stock has gained ground since earnings. The higher the percentage, the stronger the post-earnings drift.
- 0% to +5%: Modest positive drift - earnings were received well but momentum is limited.
- +5% to +15%: Strong drift - buyers continue accumulating.
- > +15%: Exceptional drift - significant institutional interest likely.
- Negative values: Stock has given back gains or extended losses since earnings. May indicate the initial reaction was overdone, or that sentiment is deteriorating.
This metric is most meaningful within the first 5-20 trading days after earnings. Extended drift (maintaining gains over 2+ weeks) is a stronger signal than a quick spike that fades.
─────────────────────────────────────────
5. # Pocket Pivots
─────────────────────────────────────────
WHAT IT IS:
Pocket Pivots are a volume-based pattern developed by Chris Kacher and Gil Morales. They identify days where institutional buyers are likely accumulating shares without causing obvious breakouts.
Calculation: A Pocket Pivot occurs when:
- The stock closes higher than it opened (up day)
- The stock closes higher than the previous day's close
- Today's volume exceeds the highest down-day volume of the prior 10 trading sessions
The screener counts how many Pocket Pivots have occurred since the earnings announcement.
HOW TO INTERPRET:
- 0 Pocket Pivots: No detected institutional accumulation patterns since earnings.
- 1-2 Pocket Pivots: Some institutional buying interest - worth monitoring.
- 3+ Pocket Pivots: Strong accumulation signal - institutions appear to be building positions.
Pocket Pivots are most significant when they occur:
- Immediately following earnings announcements
- Near moving average support (10-day, 21-day, or 50-day)
- On above-average volume
- After a period of price consolidation
Multiple Pocket Pivots in a short period suggest sustained institutional demand, not just a one-day event.
─────────────────────────────────────────
6. ADX/DI (Trend Strength and Direction)
─────────────────────────────────────────
WHAT IT IS:
ADX (Average Directional Index) measures trend strength regardless of direction. DI (Directional Indicator) shows whether the trend is bullish or bearish.
Calculation: ADX uses a 14-period lookback to measure how directional (trending) price movement is. Values range from 0 to 100. The +DI and -DI components compare upward and downward movement.
The screener shows:
- ADX value (trend strength)
- Direction indicator: "+" for bullish (price trending up), "-" for bearish (price trending down)
HOW TO INTERPRET:
- ADX < 20: Weak trend - the stock is moving sideways, choppy. Not ideal for momentum trading.
- ADX 20-25: Trend is emerging - potentially starting a directional move.
- ADX 25-40: Strong trend - clear directional movement. Good for momentum plays.
- ADX > 40: Very strong trend - powerful move in progress, but may be extended.
The direction indicator (+/-) tells you which way:
- "25+" means ADX of 25 with bullish direction (uptrend)
- "25-" means ADX of 25 with bearish direction (downtrend)
For post-earnings plays, ideal setups show ADX rising above 25 with positive direction, confirming the earnings reaction is developing into a sustained trend rather than a one-day spike.
─────────────────────────────────────────
7. Institutional Buying PASS
─────────────────────────────────────────
WHAT IT IS:
This proprietary composite indicator detects patterns consistent with institutional accumulation at three stages after earnings:
EARLY (Days 0-4): Looks for "large block" buying on the earnings reaction day (exceptionally high volume with a close in the upper half of the day's range) combined with follow-through buying on the next day.
MID (Days 5-9): Checks for sustained elevated volume (averaging 1.5x the 20-day average) combined with positive drift and consistent upward price movement (more up days than down days).
LATE (Days 10+): Detects either visible accumulation (positive drift with high volume) OR stealth accumulation (positive drift with unusually LOW volume - suggesting smart money is quietly building positions without attracting attention).
HOW TO INTERPRET:
- Check mark/value of '1': Institutional buying pattern detected. The stock shows characteristics consistent with large players accumulating shares.
- X mark/value of '0': No institutional buying pattern detected. This doesn't mean institutions aren't buying - just that the typical footprints aren't visible.
A passing grade here adds conviction to other bullish signals. Institutions have research teams, information advantages, and long time horizons. When their footprints appear in the data, it often precedes sustained moves.
Important: This is a pattern detection tool, not a guarantee. Always combine with other analysis.
─────────────────────────────────────────
8. Strong ATR Drift PASS
─────────────────────────────────────────
WHAT IT IS:
This measures whether the stock has drifted significantly relative to its own volatility. Instead of asking "did it move 10%?", it asks "did it move more than 1.5 ATRs?"
ATR (Average True Range) measures a stock's typical daily movement. A volatile stock might move 5% daily, while a stable stock might move 0.5%. Using ATR normalizes for this difference.
Calculation:
ATR Drift = (Current Close - D0 Close) / D0 ATR in dollars
The indicator passes when ATR Drift exceeds 1.5 AND at least 5 days have passed since earnings.
HOW TO INTERPRET:
- Check mark/value of '1': The stock has drifted more than 1.5 times its average daily range since earnings - a statistically significant move that suggests genuine momentum, not just noise.
- X mark/value of '0': The drift (if any) is within normal volatility bounds - could just be random fluctuation.
Why wait 5 days? The immediate post-earnings reaction (days 0-2) often includes gap fills and noise. By day 5, if the stock is still extended beyond 1.5 ATRs from the earnings close, it suggests real buying pressure, not just a reflexive gap.
A passing grade here helps filter out stocks that "beat earnings" but haven't actually moved meaningfully. It focuses attention on stocks where the market is voting with real capital.
─────────────────────────────────────────
9. Days Since D0
─────────────────────────────────────────
WHAT IT IS:
Simply counts the number of trading days since the earnings reaction day (D0).
HOW TO INTERPRET:
- Days 0-5 (Green): Fresh earnings - the information is new, institutional repositioning is active, and momentum trades are most potent. This is the "sweet spot" for PEAD strategies.
- Days 6-10 (Neutral): Mid-period - some edge remains but diminishing. Good for adding to winning positions, less ideal for new entries.
- Days 11+ (Red): Extended period - most of the post-earnings drift has typically played out. Higher risk that momentum fades or reverses.
Research shows PEAD effects are strongest in the first 5-10 days after earnings, then decay. Beyond 20-30 days, the informational advantage of the earnings surprise is largely priced in.
Use this to prioritize: focus on stocks with strong signals that are still in the early window, and be more selective about entries as days accumulate.
═══════════════════════════════════════════════════════════════
PUTTING IT ALL TOGETHER
═══════════════════════════════════════════════════════════════
You can use this screener in the chart view or in the Screener.
One combination of the above filters to develop a shortlist of positive drift candidates may be:
- SUE > 2.0 (significant earnings beat)
- SURGE > 1.5 (significant revenue beat)
- Positive % From D0 Close (price confirming the good news)
- Institutional Buying PASS (big players accumulating)
- Strong ATR Drift PASS (statistically significant movement)
- Days Since D0 < 10 (still in the active drift window)
No single indicator is sufficient. The power comes from convergence - when multiple independent measures all point the same direction.
═══════════════════════════════════════════════════════════════
SETTINGS
═══════════════════════════════════════════════════════════════
Key adjustable parameters:
- SUE Method: "Analyst-based" uses consensus estimates; "Time-series" uses year-over-year comparison
- Window Size: Number of quarters used for standardization (default: 8)
- ATR Drift Threshold: Minimum ATR multiple for "strong" classification (default: 1.5)
- Institutional Buying thresholds: Adjustable volume and CLV parameters
═══════════════════════════════════════════════════════════════
DISCLAIMER
═══════════════════════════════════════════════════════════════
This screener is a research tool, not financial advice. Past patterns do not guarantee future results. Always conduct your own due diligence and manage risk appropriately. Post-earnings trading involves significant uncertainty and volatility. The 'SUE' in this indicator does not represent a real person; any similarity to actual Sue's (or Susans for that matter) living or dead is quite frankly ridiculous, not to mention coincidental.
Penunjuk Pine Script®

Inversion Fair Value Gap Screener | Flux Charts💎 GENERAL OVERVIEW
Introducing our new Inverse Fair Value Gap Screener! This screener can provide information about the latest Inverse Fair Value Gaps in up to 5 tickers. You can also customize the algorithm that finds the Inverse Fair Value Gaps and the styling of the screener.
Features of the new Inverse Fair Value Gap (IFVG) Screener :
Find Latest Inverse Fair Value Gaps Across 5 Tickers
Shows Their Information Of :
Latest Status
Number Of Retests
Consumption Percent
Volume
Customizable Algorithm / Styling
📌 HOW DOES IT WORK ?
A Fair Value Gap generally occur when there is an imbalance in the market. They can be detected by specific formations within the chart. An Inverse Fair Value Gap is when a FVG becomes invalidated, thus reversing the direction of the FVG.
IFVGs get consumed when a Close / Wick enters the IFVG zone. Check this example:
This screener then finds Fair Value Gaps across 5 different tickers, and shows the latest information about them.
Status ->
Far -> The current price is far away from the IFVG.
Approaching ⬆️/⬇️ -> The current price is approaching the IFVG, and the direction it's approaching from.
Inside -> The price is currently inside the IFVG.
Retests -> Retest means the price tried to invalidate the IFVG, but failed to do so. Here you can see how many times the price retested the IFVG.
Consumed -> IFVGs get consumed when a Close / Wick enters the IFVG zone. For example, if the price hits the middle of the IFVG zone, the zone is considered 50% consumed.
Volume -> Volume of a IFVG is essentially the volume of the bar that broke the original FVG that formed it.
🚩UNIQUENESS
This screener can detect latest Inverse Fair Value Gaps and give information about them for up to 5 tickers. This saves the user time by showing them all in a dashboard at the same time. The screener also uniquely shows information about the number of retests and the consumed percent of the IFVG, as well as it's volume. We believe that this extra information will help you spot reliable IFVGs easier.
⚙️SETTINGS
1. Tickers
You can set up to 5 tickers for the screener to scan Fair Value Gaps here. You can also enable / disable them and set their individual timeframes.
2. General Configuration
FVG Zone Invalidation -> Select between Wick & Close price for FVG Zone Invalidation.
IFVG Zone Invalidation -> Select between Wick & Close price for IFVG Zone Invalidation. This setting also switches the type for IFVG consumption.
Zone Filtering -> With "Average Range" selected, algorithm will find FVG zones in comparison with average range of last bars in the chart. With the "Volume Threshold" option, you may select a Volume Threshold % to spot FVGs with a larger total volume than average.
FVG Detection -> With the "Same Type" option, all 3 bars that formed the FVG should be the same type. (Bullish / Bearish). If the "All" option is selected, bar types may vary between Bullish / Bearish.
Detection Sensitivity -> You may select between Low, Normal or High FVG detection sensitivity. This will essentially determine the size of the spotted FVGs, with lower sensitivities resulting in spotting bigger FVGs, and higher sensitivities resulting in spotting all sizes of FVGs.
Penunjuk Pine Script®

Institutional MA Bounce & Support Screener. Description
The Philosophy
Top-tier traders don’t just buy stocks because they are up; they buy them because they show signs of institutional accumulation. This indicator is designed to find "High-Quality Support" signals—instances where a stock in a primary uptrend pulls back to a key moving average (10 SMA, 21 EMA, or 50 SMA) and is met with aggressive buying that drives the price to close near the daily highs.
Key Components
* Trend Alignment: Automatically filters out "laggards" by only flagging setups when price is above the 50 SMA.
* Proximity-Based Bouncing: Unlike rigid indicators that require a "perfect" touch, this uses an editable Buffer %. It catches those high-conviction "front-runs" where price reverses just before hitting the line.
* Volume Conviction: Integrates Relative Volume (RVOL). It ensures you aren't looking at a dead-cat bounce, but a high-volume reversal backed by institutional participation.
* Daily Closing Range (DCR): The final confirmation. It measures the finishing position of the day. A high DCR (>85%) at an MA is a primary signal of "support found."
How to Use with the TradingView Screener (Beta)
This script is optimized with "bundled security calls" to avoid errors in the new TradingView Screener.
* Add the script to your chart.
* Open the Stock Screener (Beta).
* Add columns for Bounce 10SMA, Bounce 21EMA, or Bounce 50SMA.
* Filter for Equals 1 to find stocks currently tagging those levels.
* Combine with the Daily Closing Range filter (> 90) for the ultimate "Power Setup."
Technical Settings
* RelVol Lookback: Compare today's volume against the 20, 50, or 200-day average.
* RelVol Threshold: Set the multiplier (e.g., 1.5x) to find true volume surges.
* Bounce Buffer: Adjust from 0.5% (strict) to 2.0% (loose) depending on market volatility.
A Pro-Tip for your users:
The best setups often occur when the Relative Volume is > 1.2 and the Daily Closing Range is > 90% on the day of the bounce. This indicates that institutions didn't just defend the level—they overwhelmed the sellers by the closing bell.
Would you like me to help you draft the "Release Notes" for when you update this script with the Gemini Confluence Trigger features we discussed?
Penunjuk Pine Script®

Multi-Timeframe TTM Squeeze Pro with alerts and screenersBased of John Carters TTM Squeeze. Must open the settings and select wether you want to match the timeframe in your chart. This must be done in the pinescreener as well otherwise results will not be correct.
---
# **Squeeze Momentum Pro – Enhanced Screener + EMA Cross Alerts**
This custom version of the Squeeze Momentum indicator expands the standard TTM-style squeeze with screening and automated alert logic so you can quickly find high-quality setups across many tickers.
---
## **What This Script Does**
This indicator plots a three-level squeeze visual similar to TTM Squeeze:
Dot meanings in this indicator
Orange dot:
Strongest squeeze – Bollinger Bands are inside the tightest Keltner level (highest volatility compression).
Red dot:
Medium squeeze – still compressed, but not as tight as orange.
Black dot:
Weak squeeze / lowest level of volatility compression.
Price is coiling, but not as tight as the higher levels.
Green dot (“Fired”):
Squeeze has released — Bollinger Bands have expanded out of the channels and momentum is moving.
A momentum histogram is plotted to show directional pressure during the squeeze.
---
## **Major Improvements Added**
### **① Screenable Conditions for Stock Scanners**
This version includes multiple `alertcondition()` flags so the script can be used as a **Pine Screener inside TradingView**.
Currently it can screen for:
✔ Price closing above the 50-SMA
✔ Presence of an **orange (strong) squeeze dot**
✔ 6/20 EMA crossover signals inside a squeeze
These can be used inside the TradingView Screener or in watchlists to automatically highlight qualifying tickers.
---
### **② 6/20 EMA Trend Signals (Filtered by Squeeze)**
A crossover system was added:
* **Bullish Signal:** 6 EMA crosses above 20 EMA
* **Bearish Signal:** 6 EMA crosses below 20 EMA
But **these signals only trigger if the market is in a red or orange squeeze**, which helps remove noise and focus on valid setups.
---
### **③ Visual Markers Under the Histogram**
Whenever an EMA crossover occurs during a squeeze:
* A **green up-triangle** is plotted for a bullish cross
* A **red down-triangle** for a bearish cross
These markers are drawn **below the histogram**, keeping the display clean while still providing quick visual cues.
---
### **④ Fully Non-Repainting Logic**
All signals and squeeze calculations are based on standard fully-resolved `ta.*` functions, making the results stable both in backtesting and real-time.
---
## **Who This Script Helps**
This version is ideal for:
* Traders who use TradingView’s screener and want automated breakout/continuation filtering
* Traders who scan large watchlists for squeeze setups
* Users who want trend confirmation during volatility compression
---
## **How to Use It**
1. Add the script to your chart
2. Open TradingView Alerts or Screener
3. Select the conditions you want, for example:
* *“Orange Squeeze Detected”*
* *“Squeeze Fire after 3 squeeze dots*
* *“4 REd Dots in a row.”*
* *“Buy Alert”*
* *“EMA 6/20 Bullish Crossover (Squeeze Only)”*
* *“Close Above 50 SMA”*
Once active, TradingView will automatically flag symbols that meet the criteria.
---
## **Summary**
This enhanced Squeeze Momentum indicator turns the standard TTM-style visual into a **true screening and alert system** by adding:
* Multi-level squeezes
* EMA trend signals
* Screener-compatible alert conditions
* Clean visual signals
* Non-repainting logic
It helps traders quickly locate high-probability setups across any watchlist or market.
Penunjuk Pine Script®

All SMAs Bullish/Bearish Screener (Enhanced)All SMAs Bullish/Bearish Screener Enhanced: Uncover High-Conviction Trend Alignments with Confidence
Description:
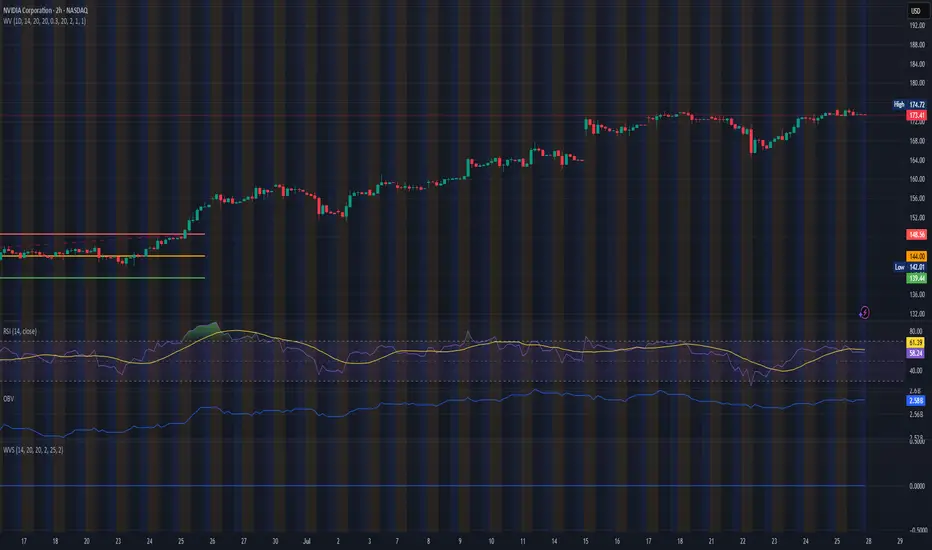
Are you ready to elevate your trading from mere guesswork to precise, data-driven decisions? The "All SMAs Bullish/Bearish Screener Enhanced" is not just another indicator; it's a sophisticated, yet user-friendly, trend-following powerhouse designed to cut through market noise and pinpoint high-probability trading opportunities. Built on the foundational strength of comprehensive Moving Average confluence and fortified with critical confirmation signals from Momentum, Volume, and Relative Strength, this script empowers you to identify truly robust trends and manage your trades with unparalleled clarity.
The Power of Multi-Factor Confluence: Beyond Simple Averages
In the unpredictable world of financial markets, true strength or weakness is rarely an isolated event. It's the harmonious alignment of multiple technical factors that signals a high-conviction move. While our original "All SMAs Bullish/Bearish Screener" intelligently identified stocks where price was consistently above or below a full spectrum of Simple Moving Averages (5, 10, 20, 50, 100, 200), this Enhanced version takes it a crucial step further.
We've integrated a powerful three-pronged confirmation system to filter out weaker signals and highlight only the most compelling setups:
Momentum (Rate of Change - ROC): A strong trend isn't just about price direction; it's about the speed and intensity of that movement. Positive momentum confirms that buyers are still aggressively pushing price higher (for bullish signals), while negative momentum validates selling pressure (for bearish signals).
Volume: No trend is truly trustworthy without the backing of smart money. Above-average volume accompanying an "All SMAs" alignment signifies strong institutional participation and conviction behind the move. It separates genuine trend starts from speculative whims.
Relative Strength Index (RSI): This versatile oscillator ensures the trend isn't just "there," but that it's developing healthily. We use RSI to confirm a bullish bias (above 50) or a bearish bias (below 50), adding another layer of confidence to the direction.
When the price aligns above ALL six critical SMAs, and is simultaneously confirmed by robust positive momentum, healthy volume, and a bullish RSI bias, you have an exceptionally strong "STRONGLY BULLISH" signal. This confluence often precedes sustained upward moves, signaling prime accumulation phases. Conversely, a "STRONGLY BEARISH" signal, where price is below ALL SMAs with negative momentum, confirming volume, and a bearish RSI bias, indicates powerful distribution and potential for significant downside.
How to Use This Enhanced Screener:
Add to Chart: Go to TradingView's Pine Editor, paste the script, and click "Add to Chart."
Customize Parameters: Fine-tune the lengths of your SMAs, RSI, Momentum, and Volume averages via the indicator's settings. Experiment to find what best suits your trading style and the assets you trade.
Choose Your Timeframe Wisely:
Daily (1D) and 4-Hour (240 min) are highly recommended. These timeframes cut through intraday noise and provide more reliable, actionable signals for swing and position trading.
Shorter timeframes (e.g., 15min, 60min) can be used by advanced day traders for very short-term entries, but be aware of increased volatility and noise.
Visual Confirmation:
Green/Red Triangles: Appear on your chart, indicating confirmed bullish or bearish signals.
Background Color: The chart background will subtly turn lime green for "STRONGLY BULLISH" and red for "STRONGLY BEARISH" conditions.
On-Chart Status Table: A clear table displays the current signal status ("STRONGLY BULLISH/BEARISH," or "SMAs Mixed") for immediate feedback.
Set Up Alerts (Your Primary Screener Tool): This is the game-changer! Create custom alerts on TradingView based on the "Confirmed Bullish Trade" and "Confirmed Bearish Trade" conditions. Receive instant notifications (email, pop-up, mobile) for any stock in your watchlist that meets these stringent criteria. This allows you to scan the entire market effortlessly and act decisively.
Strategic Stop-Loss Placement: The Trader's Lifeline
Even the most robust signals can fail. Protecting your capital is paramount. For this trend-following strategy, your stop-loss should be placed where the underlying trend structure is broken.
For a "STRONGLY BULLISH" Trade: Place your stop-loss just below the most recent significant swing low (higher low). This is the last point where buyers stepped in to support the price. If price breaks below this, your bullish thesis is invalidated.
For a "STRONGLY BEARISH" Trade: Place your stop-loss just above the most recent significant swing high (lower high). If price breaks above this, your bearish thesis is invalidated.
Alternatively, consider placing your stop-loss just below the 20-period SMA (for bullish trades) or above the 20-period SMA (for bearish trades). A significant close beyond this intermediate-term average often indicates a critical shift in momentum. Always ensure your chosen stop-loss adheres to your pre-defined risk per trade (e.g., 1-2% of capital).
Disciplined Profit Booking: Maximizing Gains
Just as important as knowing when you're wrong is knowing when to take profits.
Trailing Stop-Loss: As your trade moves into profit, trail your stop-loss upwards (for longs) or downwards (for shorts). You can trail it using:
Previous Swing Lows/Highs: Move your stop to just below each new higher low (for longs) or just above each new lower high (for shorts).
A Moving Average (e.g., 10-period or 20-period SMA): If price closes below your chosen trailing SMA, exit. This allows you to ride the trend while protecting accumulated profits.
Target Levels: Identify potential resistance levels (for longs) or support levels (for shorts) using pivot points, previous highs/lows, or Fibonacci extensions. Consider taking partial profits at these levels and letting the rest run with a trailing stop.
Loss of Confluence: If the "STRONGLY BULLISH/BEARISH" condition ceases to be met (e.g., RSI crosses below 50, or volume drops significantly), this can be a signal to reduce or exit your position, even if your stop-loss hasn't been hit.
The "All SMAs Bullish/Bearish Screener Enhanced" is your comprehensive partner in navigating the markets. By combining robust trend identification with critical confirmation signals and disciplined risk management, you're equipped to make smarter, more confident trading decisions. Add it to your favorites and unlock a new level of precision in your trading journey!
#PineScript #TradingView #SMA #MovingAverage #TrendFollowing #StockScreener #TechnicalAnalysis #Bullish #Bearish #QQQ #Momentum #Volume #RSI #SPY #TradingStrategy #Enhanced #Signals #Analysis #DayTrading #SwingTrading
Penunjuk Pine Script®

ORB Screener with Trailing SLThis is an extension to our already published script ORB with ATR Trailing SL indicator
Many people requested to add screener to the existing indicator but since it's slowing down the performance heavily, we decided to add this as a separate screener.
Note: This screener does NOT plot the chart and so you want to have both plotting and screener, use both scripts together.
Overview:
The ORB Screener is a TradingView indicator designed to assist traders in identifying breakout opportunities based on the Opening Range Breakout (ORB) strategy. It features multi-symbol screening, customizable session timeframes, and a detailed table for quick visual reference and stock scanning.
The ORB Screener utilizes the ORB strategy to calculate breakout levels for multiple symbols. It identifies the high and low during a specified session (e.g., first 5 minutes after market open) and provides insights on whether the price is above the high (bullish), below the low (bearish), or between the range (neutral).
Additionally, the script calculates and displays the RSI values for each symbol, aiding traders in assessing momentum alongside breakout status.
Note: One can add up to 40 symbols for screening the stocks.
Key Features and Inputs:
ORB Session Time: Define a specific timeframe (e.g., "0915-0920") during which the ORB high and low are calculated. This serves as the foundation for identifying breakouts.
Multi-Symbol Screening: Screen up to 40 symbols at once, enabling you to monitor multiple opportunities without switching charts.
Breakout Validation:
Select from two methods for confirming a breakout: Close (based on closing prices) or Touch (based on intraday highs/lows).
Breakout Status Indicators:
Above High: Indicates a current bullish breakout when the price exceeds the ORB high.
Below Low: Indicates a current bearish breakout when the price falls below the ORB low.
Between Range: Indicates no breakout (price remains within the range).
RSI Integration : Calculates the RSI for each symbol to help traders evaluate momentum alongside breakout signals.
Customizable Table Display:
Position: Place the data table at the top, middle, or bottom of the chart and align it left, center, or right.
Size: Choose from multiple table size options for optimal visibility (Auto, Huge, Large, Normal, Small, Tiny).
Visual Feedback:
Green Background: Indicates a breakout happened at least once above the ORB high.
Red Background: Indicates a breakout happened at least once below the ORB low.
Gray Background: Indicates price is within the ORB range.
Penunjuk Pine Script®
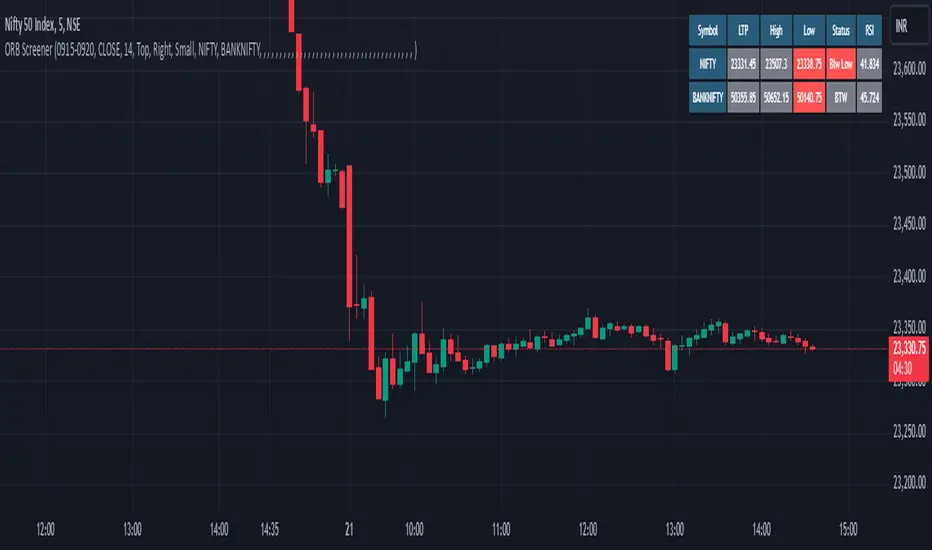
Custom Multi-Timeframe IndicatorIt's a pretty simple example of a nice custom screener you can run for multiple timeframes. This is an RSI screener, but you can easily change the function for your own Indicator.
Screener displays:
Last value of the instrument
RSI value for up to 10 instruments / 4 timeframes.
In Parameters you can change:
4 timeframes
10 instruments
Parameters for RSI
Styling parameters for table
If the selected timeframe will be lower than the current one you will receive a warning message in a table.
Thanks to @MUQWISHI to help me code it.
Disclaimer
Please remember that past performance may not be indicative of future results.
Due to various factors, including changing market conditions, the strategy may no longer perform as well as in historical backtesting.
This post and the script don’t provide any financial advice.
Penunjuk Pine Script®

RSI Screener Multi Timeframe [5ema]This indicator is the simple version of my indicator: RSI Screener and Divergence .
Only show table with values, signals at 5 custom timeframes.
-----
I reused some functions, made by (i believe that):
©paaax: The table position function.
@kingthies: The RSI divergence function.
@QuantNomad: The function calculated value and array screener for 40+ instruments.
I have commented in my code. Thanks so much!
-----
How it works:
1. Input :
Length of RSI => calculate RSI.
Upper/lower => checking RSI overbought/oversold.
Right bars / left bars => returns price of the pivot low & high point => checking divergence.
Range upper / lower bars => compare the low & high point => checking divergence.
Timeframe => request.security another time frame.
Table position => display screener table.
2. Input bool:
Regular Bearish divergence.
Hidden Bullish divergence .
Hidden Bearish divergence.
3. Basic calculated:
Make function for RSI , pivot low & high point of RSI and price.
Request.security that function for earch time frame.
Result RSI, Divergence.
4. Condition of signal:
Buy condition:
RSI oversold (1)
Bullish divergence (2).
=> Buy if (1) and (2), review buy (1) or (2).
Sell condition:
RSI overbought (3).
Bearish divergence (4).
=> Sell if (3) and (4), review sell (3) or (4).
-----
Table screener:
Time frame.
RSI (green - oversold, red - overbought)
Divergence (>> - regular bullish , << regular bearish , > - hidden bullish , < - hidden bearish ).
Signal (green ⦿ - Buy, red ⦿ - Sell, green 〇 - review buy, red 〇 - review sell).
- Regular Bearish divergence:
- Regular Bullish divergence:
- Regular Bullish divergence + RSI overSold
- Regular Bearish divergence + RSI overBought
-----
This indicator is for reference only, you need your own method and strategy.
If you have any questions, please let me know in the comments.
Penunjuk Pine Script®

Scalping Screener - 15minSCALPING SCREENER - 15 mins (Indicator Tool)
TIME FRAME to use - 15 mins
DURATION OF TRADE - Using this indicator, Trade must be taken only during market hours and must be closed before market close (must not be carried forrward for next day).
SCALPING - This is a scalping strategy that is intended to make small profits in intraday trading
ENTRY CONCEPT -
- There must be 2 bulish candles and the 2nd candle's high should be greater than first candle's high.
- And If the latest candle high breaks high of the 2nd candle (prev candle), BUY signal is generated.
- Additional filters are added to reduce non-performaing trades.
- visa versa for SHORT signal
EXIT CONCEPT -
- 2nd candles low is the stop loss.
- Difference between 2nd candle high and 2nd candle low is target.
- The script will indicate when to BUY / SHORT and when to EXIT the trade.
INSTRUMENTS TO TRADE -
- High volatility instruments are best to be traded
- Nifty 50 stocks have been added to this indicator for the sake of screener. User can change these stocks with high volatility ones
- There is a limitation to add upto 40 scripts.
SCREENER FUNCTION -
- Right side of the chart has screener section which shows the list of stocks that qualify as per the BUY / SELL signal
NOTE -
The purpose of the scipt is for self learning / improvement and analysis.
Trading is a risky business and a trader must take any trade at their own RISK.
The author shall not be held responsible for Losses / Profits
Penunjuk Pine Script®
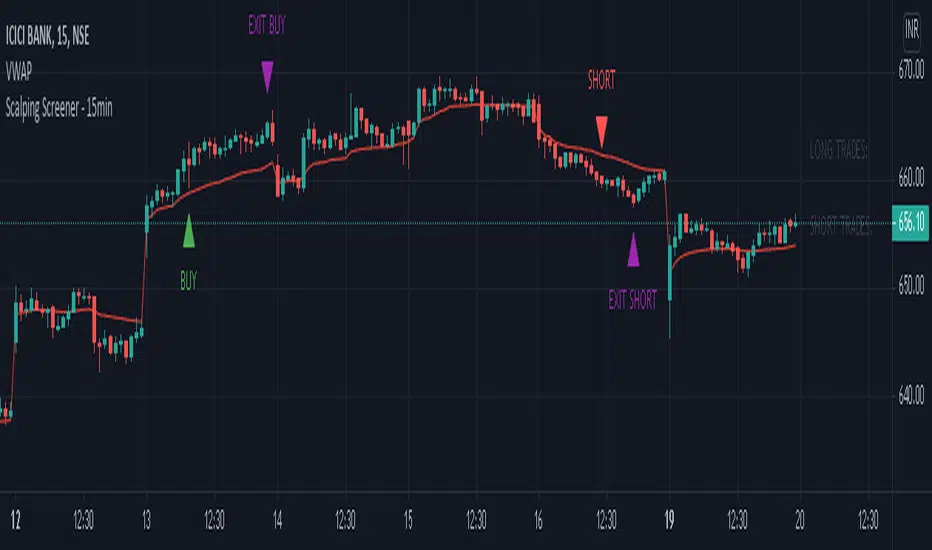
Top 40 Best Performing Nasdaq Stocks with Advanced Stats ScreenWelcome to the CustomQuantLabs Advanced Stats Screener. This dashboard is designed for traders who need more than just price action—it provides a comprehensive, institutional-grade view of the "Top 40" performing assets in the Nasdaq (or any watchlist of your choice) at a single glance.
Instead of flipping through 40 different charts, this screener aggregates Performance Metrics and Advanced Statistical Risk Models into one clean, heatmap-style dashboard. It helps you instantly identify outliers, trend leaders, and potential mean-reversion setups.
Key Features
1. Multi-Timeframe Performance Heatmap Instantly spot momentum. The dashboard tracks returns across 5 key timeframes, color-coded with a dynamic heatmap (Bright Green for leaders, Bright Red for laggards):
Week% (Short-term momentum)
Month% & Quarter% (Medium-term trend)
6M% & 12M% (Long-term secular trend)
2. Institutional Risk Metrics (Advanced Stats) We go beyond simple percentage changes. This screener calculates complex statistical formulas for every single ticker in real-time:
Kelly Criterion (%): A money management formula used to determine optimal position size based on win probability and return ratio. A higher Kelly % suggests a statistically stronger "edge" based on recent history.
Sharpe Ratio: Measures risk-adjusted return. How much return are you getting for every unit of risk? (Values > 1.0 are generally considered good).
Sortino Ratio: Similar to Sharpe, but only penalizes downside volatility. This is crucial for distinguishing between "good volatility" (upside pumps) and "bad volatility" (crashes).
Z-Score: A mean-reversion metric. It measures how many standard deviations the current price is from its 20-day mean.
High Positive Z-Score (>2): Price may be overextended to the upside.
Low Negative Z-Score (<-2): Price may be oversold.
Volatility (%): A dynamic measure of the asset's daily range, helping you gauge the "personality" of the stock before entering.
Customization & Settings
Fully Customizable Watchlist: While pre-loaded with top Nasdaq performers (like NVDA, AMD, PLTR, MU), you can easily edit the "Symbols" input in the settings to track Crypto, Forex, or your own custom stock portfolio.
Smart Theme Detection: Includes a toggle for Dark Mode (ProjectSyndicate style) and Light Mode (Clean white style).
Compact Mode: You can toggle specific columns on or off to fit the table on smaller screens.
How to Use
Add the script to your chart.
Open Settings (Gear Icon).
Paste your list of 40 tickers into the "Ticker List" text area (separated by commas).
Use the Z-Score to find overbought/oversold setups and the Relative Strength (Week/Month) to find breakout candidates.
Disclaimer: This tool is for informational purposes only. The "Top 40" list requires manual updating if the market leaders change. All statistical metrics (Kelly, Sharpe, etc.) are based on historical data and do not guarantee future performance.
Built by CustomQuantLabs.
Penunjuk Pine Script®

cd_VW_CxOverview
The cd_VW_Cx is a sophisticated trend analysis tool designed to quantify market momentum using Multi-Period VWAP (Volume Weighted Average Price). Unlike standard indicators, this script evaluates the current price relationship across multiple historical VWAP anchors to generate a real-time "Confidence Score" ranging from -100 to +100.
💡 Key Features
• Dynamic Anchoring: Seamlessly switch between Daily, Weekly, or Monthly open anchors to align with your trading style (Scalping, Day Trading, or Swing).
• Algorithmic Scoring (The Score Box): The indicator compares the current VWAP against historical periods.
o Score > +70: Strong Bullish Momentum.
o Score < -70: Strong Bearish Momentum.
• Polyline Rendering: Utilizes Pine Script v6’s advanced polyline architecture for high-performance, sleek visual plotting that doesn't clutter your chart.
• Institutional Support/Resistance: Historical VWAP levels are color-coded, often acting as "invisible" magnetic zones where institutional orders are clustered.
🛠 How to Trade with cd_VW_Cx
1. Momentum Confirmation: Look for the Score Box to turn Teal (Bullish) or Red (Bearish). This indicates that the current trend has statistical backing from multiple previous sessions.
2. The Breakout Signal: The script tracks price crossovers of the current VWAP. A "Bullish Breakout" combined with a high score is a high-probability entry signal.
3. Visual Guidance: Use the custom labels to identify which specific day/week/month’s VWAP is currently being tested as support or resistance.
⚙️ Customizable Settings
• Anchor Selection: Choose the calculation basis (Daily, Weekly, Monthly).
• Thresholds: Adjust the sensitivity of the Bullish/Bearish alerts (Default is +/- 70).
• Visuals: Full control over table positioning, font sizes, and color palettes to match your chart theme.
📢 cd_VW_Cx: Multi-Period VWAP Scoring & Analysis Guide
🔍 Overview & Visual Logic
The labels next to the VWAP levels dynamically change based on your Anchor selection:
• Daily Open: Displays the Day Name (e.g., Monday, Tuesday).
• Weekly Open: Displays the Week Number (1 – 52).
• Monthly Open: Displays the Month Number (1 – 12).
•
General View:
________________________________________
🚦 How to Filter & Track Your Assets
You can monitor your favorite assets using two powerful methods:
1. Real-Time Alerts
Stay updated with TradingView notifications:
• Per Asset: Track a single pair.
• Watchlist Basis: Monitor your entire list at once. Alert Setup Guide:
2. Pine Screener Integration
Filter the market effortlessly using the Pine Screener. Pine Screener View:
________________________________________
⚙️ Settings & Configuration
• Timeframe Selection: Your chart timeframe must be lower than the selected Anchor timeframe. (e.g., If "Daily Open" is selected, the timeframe should be lower than 1D).
• Anchor Choice: Select Daily, Weekly, or Monthly opens.
• Source Selection: Default value is set to ohlc4. Source Settings:
Filtering Criteria Examples:
• Bullish Filtering: Find assets with high momentum scores.
• Bullish Breakout (Single Criteria): Filters assets that have closed above the current VWAP level.
• Combined Strength (Score + Breakout): Filters assets that have a Score > 70 AND a fresh VWAP Breakout simultaneously.
________________________________________
⚠️ Important Notes & Warnings
• Calculation Logic: The indicator calculates levels and scores on timeframes lower than the anchor. It is best used on timeframes that are close to but lower than the anchor.
• Avoid Extreme Gaps: Using a very low timeframe (e.g., 1m) with a very high anchor (e.g., Monthly) increases the risk of erroneous results.
• Optimization: The default score threshold of 70 is a starting point; I recommend adjusting it based on your own trading experience.
• The Power of Confluence: VWAP levels are naturally strong. Their significance increases when they coincide with institutional levels like PDH (Previous Day High), Session H/L, or HTF FVG.
• Experience Matters: A high score alone is not enough for an entry. Always combine this data with your personal strategy.
________________________________________
💬 Community & Feedback
I would love to hear your suggestions regarding the scoring logic or visual improvements! Feel free to share your thoughts in the comments.
Happy Trading! 🚀
Penunjuk Pine Script®

Buy And Hold Performance Screener - [JTCAPITAL]Buy And Hold Performance Screener – is a script designed to track and display multi-asset “buy and hold” performance curves and performance statistics over defined timeframes for selected symbols. It doesn’t attempt to time entries or exits; rather, it shows what would happen if one simply bought the asset at the defined start date and held it.
The indicator works by calculating in the following steps:
Start Date Definition
The script begins by reading an input for the start date. This defines the bar from which the equity curves begin.
Symbol Definitions & Close Price Retrieval
The script allows the user to specify up to ten tickers. For each ticker it uses request.security() on the “1D” timeframe to retrieve the daily close price of that symbol.
Plot Enable Inputs
For each ticker there is an input boolean controlling whether the equity curve for that ticker should be plotted.
Asset Name Cleaning
The helper function clean_name(string asset) => … takes the asset string (e.g., “CRYPTO:SOLUSD”) and manipulates it (via string splitting and replacements) to derive a cleaned short name (e.g., “SOL”). This name is used for visuals (labels, table headers).
Equity Curve Calculation (“HODL”)
The helper function f_HODL(closez) defines a variable equity that assumes a starting equity of 1 unit at the start date and then multiplies by the ratio of each bar’s close to the prior bar’s close: i.e. daily compounding of returns.
Performance Metrics Calculation
The helper function f_performance(closez) calculates, for each symbol’s close series, the percentage change of the current close relative to its close 30 days ago, 90 days ago, 180 days ago, 1 year ago (365 days), 2 years ago (730 days) and 3 years ago (1095 days).
Equity Curve Plots
For each ticker, if the corresponding plot input is true, the script assigns a plotted variable equal to the equity curve value. Its then drawing each selected equity curve on the chart, each in a distinct color.
Table Construction
If the plottable input is true, the script constructs a table and populates it with rows and column corresponding to the assigned tickers and the set 6 timeframes used for display.
Buy and Sell Conditions:
Since this is strictly a “buy-and-hold” performance screener, there are no explicit buy or sell signals generated or plotted. The script assumes: buy at the defined start_date, hold continuously to present. There are no filters, no exit logic, no take-profit or stop-loss. The benefit of this approach is to provide a clean benchmark of how selected assets would have performed if one simply adopted a passive “buy & hold” approach from a given start date.
Features and Parameters:
start_date (input.time) : Defines the date from which performance and equity curves begin.
ticker1 … ticker10 (input.symbol) : User-selectable asset symbols to include in the screener.
plot1 … plot10 (input.bool) : Boolean flags to enable/disable plotting of each asset’s equity curve.
plottable (input.bool) : Flag to enable/disable drawing the performance table.
Colored plotting + Labels for identifying each asset curve on the chart.
Specifications:
Here is a detailed breakdown of every calculation/variable/function used in the script and what each part means:
start_date
This is defined via input.time(timestamp("1 Jan 2025"), title = "Start Date"). It allows the user to pick a specific calendar date from which the equity curves and performance calculations will start.
ticker1 … ticker10
These inputs allow the user to select up to ten different assets (symbols) to monitor. The script uses each of these to fetch daily close prices.
plot1 … plot10
Boolean inputs controlling which of the ten asset equity curves are plotted. If plotX is true, the equity curve for ticker X will be visible; otherwise it will be not plotted. This gives the user flexibility to include or exclude specific assets on the chart.
Returns the cleaned asset short name.
This provides friendly text labels like “BTC”, “ETH”, “SOL”, etc., instead of full symbol codes.
The choice of distinct colours for each asset helps differentiate curves visually when multiple assets are overlaid.
Colour definitions
Variables color1…color10 are explicitly defined via color.rgb(r,g,b) to give each asset a unique colour (e.g., red, orange, yellow, green, cyan, blue, purple, pink, etc.).
What are the benefits of combining these calculations?
By computing equity curves for multiple assets from the same start date and overlaying them, you can visualise comparative performance of different assets under a uniform “buy & hold” assumption.
The performance table adds multi-horizon returns (30 D, 90 D, 180 D, 1 Y, 2 Y, 3 Y) which helps the user see both short-term and longer-term performance without having to manually compute returns.
The use of daily close data via request.security(..., "1D") removes dependency on the chart’s timeframe, thereby standardising the comparison across assets.
The equity curve and table together provide both visual (curve) and numerical (table) summaries of performance, making it easier to spot trends, divergences, and cross-asset comparisons at a glance.
Because it uses compounding (equity := equity * (closez / closez )), the curves reflect the real growth of a 1-unit investment held over time, rather than only simple returns.
The labelling of curves and the color-coding make the multi-asset overlay easier to interpret.
Using a clean start date ensures that all curves begin at the same point (1 unit at start_date), making relative performance intuitive.
Because of this, the script is useful as a benchmarking tool: rather than trying to pick entries or exit points, you can simply compare “what if I had held these assets since Jan 1 2025” (or your chosen date), and see which assets out-/under-performed in that period. It helps an investor or trader evaluate the long-term benefits of passive vs. active management, or of allocation decisions.
Please note:
The script assumes continuous daily data and does not account for dividends, fees, slippage, or tax implications.
It does not attempt to optimise timing or provide trading signals.
Returns prior to the start date are ignored (equity only begins once time >= start_date).
For newly listed assets with fewer than 365 or 730 or 1095 days of history, the longer-horizon returns may return na or misleading values.
Because it uses request.security() without specifying lookahead, and on “1D” timeframe, it complies with standard usage but you should verify there is no look-ahead bias in your particular setup.
ENJOY!
Penunjuk Pine Script®