Session Opening Bar RangeSession Opening Bar Range (OBR) - Advanced Opening Range Indicator with Statistical Analysis
Overview
The Session First Bar Range (FBR) indicator is a comprehensive tool that captures and projects key levels based on the first bar of a user-defined trading session. Unlike traditional daily opening range indicators, this script allows traders to focus on specific session windows (New York RTH, London, Asia, etc.) and analyze price behavior relative to the initial momentum established in that session's opening bar.
What makes this indicator unique is its combination of three distinct projection methodologies: statistical analysis based on historical range data, Fibonacci extensions, and fixed-point rotation levels commonly used by institutional traders. To our knowledge, this is the only opening range indicator that incorporates statistical standard deviation levels calculated from historical first bar ranges, making it both a technical and probabilistic tool.
Core Concept
The opening range concept is based on the principle that the initial price action of a trading session often sets the tone for the remainder of that session.
Professional traders have long observed that:
The first bar's high and low act as key reference points
Price often respects or breaks these levels with significance
Expansion beyond the opening range tends to occur in measurable increments
This indicator takes these observations and enhances them with:
Historical probability analysis - "Based on the last 60 sessions, price typically extends X standard deviations beyond the opening range"
Proportional projections - Fibonacci-based extensions showing where measured moves typically target
Fixed-point rotations - Institutional rotation levels (e.g., 65 points for NQ, 15 points for ES)
How It Works
Session Detection & First Bar Capture
The indicator uses Pine Script's time() function with timezone support to precisely detect when a trading session begins. When the first bar of the selected timeframe occurs within the session window, the script captures:
High (H): The high of the first bar
Low (L): The low of the first bar
Mid (M): The midpoint (hl2) of the first bar
Critical Detail: These levels are fixed from the first bar only - they do not update as the session progresses. This differs from many "opening range" indicators that use a time period (e.g., first 30 minutes). Here, you select the bar timeframe (default 5-minute), and only that single first bar's range is captured.
Statistical Level Calculation
The indicator maintains a rolling array of the last N session's first bar ranges (default: 60 sessions). For each new session, it calculates:
Average Range: Mean of historical first bar ranges
Standard Deviation: Volatility of those ranges
Projection Levels: High/Low ± (Average Range + Std Dev × Multiplier)
This provides probability-based levels. For example, a +2σ level suggests: "Historically, price extending this far beyond the opening range is a 2-standard-deviation event (approximately 95th percentile)."
Fibonacci Extensions
Using the first bar range as the base unit (100%), the indicator projects Fibonacci levels:
100% extension: One full range above the high / below the low
1.618x extension: (Default) Golden ratio projection
2.618x, 3.618x extensions: Additional Fibonacci levels
Calculation: Range = H - L, then Target = H + (Range × Multiplier) for upside projections.
OR Rotation Levels
These are fixed-point increments from the first bar's high and low. Unlike percentage-based methods, rotations use absolute point values:
NQ traders often use 65-point increments
ES traders often use 15-point increments
Gold/bonds use different values
The indicator draws 5 levels above the high (R+1 through R+5) and 5 below the low (R-1 through R-5), each separated by your specified point increment.
Features:
Session Options
Pre-configured Sessions:
New York RTH (9:30am - 4:00pm)
New York Futures (8:00am - 5:00pm)
London (2:00am - 8:00am)
Asia (7:00pm - 2:00am)
Midnight to 5pm
ZB/Gold/Silver OR (8:20am - 4:00pm)
CL OR (9:00am - 4:00pm)
Custom Session: Define your own start/end times in HHMM format
Timezone Support: All sessions respect the selected timezone (default: America/New_York)
Customizable Timeframe
Select any timeframe for the first bar (1min, 5min, 15min, etc.)
Default: 5-minute bars
Important: This is the timeframe for the first bar capture, independent of your chart's timeframe
Display Options
Historical Ranges: Show/hide past session ranges (with configurable limit to manage performance)
Line Styles: Choose between Solid, Dashed, or Dotted for range lines and midline
Label Position: Left or Right side of range
Show Prices: Optionally display actual price values on labels
Custom Colors: Fully customizable colors for all components
Statistical Levels
Lookback Period: Number of historical sessions to analyze (default: 60)
Two Multiplier Levels: Default 1σ and 2σ, fully adjustable
Separate styling: Different line styles (dashed vs dotted) for each sigma level
Optional Labels: Show/hide sigma notation labels
Fibonacci Extensions
Four Extension Levels: 100%, 1.618x, 2.618x, 3.618x (all customizable)
Bidirectional: Projections both above and below the opening range
Optional Labels: Toggle percentage/multiplier labels
OR Rotation Levels
Configurable Increment: Set the point value for your instrument
Five Levels Each Direction: R±1 through R±5
Dynamic Labels: Show both rotation number and point value (e.g., "R+1 (65)")
Three Line Styles: Solid, Dashed, or Dotted
How to Use
Setup
Add the indicator to your chart
Select your trading session from the dropdown
Set the timeframe for first bar capture (typically 5-15 minutes)
Configure which projection methods you want to see (Statistical, Fibonacci, and/or Rotations)
For Day Traders
Scenario: Trading NQ during New York RTH
Session: Select "New York RTH (9:30am - 4:00pm)"
Timeframe: 5-minute (captures 9:30-9:35 bar)
Enable: OR Rotations with 65-point increments
Strategy:
Watch for acceptance/rejection at rotation levels
Use R+1/R-1 as initial profit targets
R+2/R-2 as extended targets
Statistical levels show when price is in "outlier" territory
and rotation levels
Performance Notes
The indicator limits objects to stay within TradingView's constraints (500 max)
If you enable all features, reduce "Maximum Historical Ranges" to prevent slowdown
Typical configuration: 10-20 historical ranges with all features enabled works well
Settings Guide
Session Settings
Session: Choose from pre-configured sessions or "Custom"
Custom Session Start/End: HHMM format (e.g., "0930" for 9:30am)
Timezone: Critical for accurate session detection
Opening Bar Format
Timeframe: The bar size for capturing the first bar's range
Show Midline: Toggle the mid-point line
Show Historical Ranges: Display previous sessions (recommended: leave ON)
Maximum Historical Ranges: Limit history to manage performance (1-500)
Range Style / MidLine Style: Solid, Dashed, or Dotted
Position: Label placement (Left or Right)
Show Prices: Include actual price values on labels
Statistical Levels
Lookback Periods: How many historical first bar ranges to analyze (default: 60)
Std Dev Multiplier 1/2: The sigma levels to project (default: 1.0 and 2.0)
All visual settings (colors, line width, label size)
Fibonacci Extensions
Show Fib Extensions: Enable/disable Fibonacci projections
Measured Move Extensions 1-4: The multipliers (default: 1.618, 2.618, 3.618, 4.618)
Visual customization options
OR Rotations
Rotation Increment: The point value for your instrument
NQ: 65 points
ES: 15 points
Adjust for other instruments based on their typical rotation behavior
Show Rotation Labels: Display level numbers and point values
Visual customization options
Use Cases
Gap Trading: When price gaps away from previous day's close, the first bar range shows the initial gap acceptance/rejection zone
Breakout Confirmation: Price breaking and holding above the first bar high with volume suggests trend day potential. Rotation levels provide measured targets.
Reversal Identification: Price reaching +2σ statistical level = rare event, potential exhaustion
Range Bound Days: Price oscillating between first bar high/low suggests range-bound session; trade reversals at extremes
Institutional Level Awareness: OR Rotations at 65 points (NQ) align with levels professional traders watch
Technical Notes
The indicator uses request.security() with lookahead=barmerge.lookahead_on to ensure the first bar levels are captured correctly
All drawing objects (lines, labels, fills) are managed in arrays with automatic cleanup to prevent memory issues
The statistical calculations use array.avg() and array.stdev() for accurate probability estimates
Rotation levels use individual line variables (like Fibonacci) rather than loops for reliability
Summary
This indicator is original in its combination of three distinct methodologies for projecting levels from a session's opening range:
Statistical Analysis - No other opening range indicator (to our knowledge) calculates standard deviation projections from historical first bar ranges
Time-Based Session Flexibility - Most OR indicators use only daily or fixed time periods; this allows any custom session window
Multiple Projection Methods - Traders can use statistical, Fibonacci, AND rotation levels together or separately
Cari dalam skrip untuk "session"

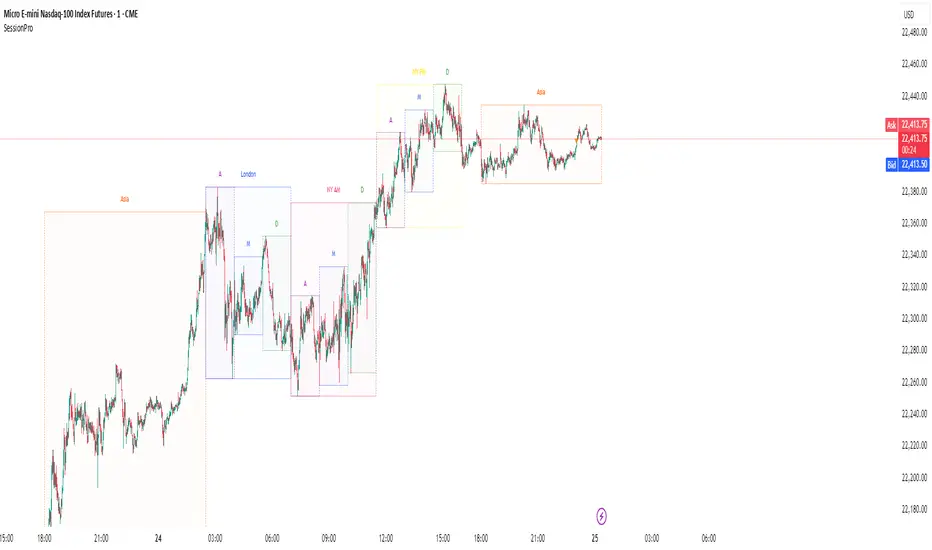
Session [PRO]Session Pro is a powerful and highly customizable indicator designed to visualize key trading sessions and their internal phases directly on your chart. It's built for traders who base their strategies on time-of-day dynamics, market opens, and specific session profiles.
This tool moves beyond simple session boxes by allowing you to map out detailed sub-sessions (e.g., Accumulation, Manipulation, Distribution phases) within the main trading windows, giving you a clearer view of the market's structure throughout the day.
Key Features
Customizable Main Sessions: Visualize Asia, London, and New York (AM/PM) sessions with distinct high/low ranges.
Detailed Sub-Sessions: Break down the London and New York sessions into three distinct profiles (A, M, D) to analyze intraday market movements.
Advanced Display Control: For every single session and sub-session, use a dropdown menu to choose your preferred display style:
Outline & Fill: The default view with a transparent colored background.
Outline Only: A minimalist view showing only the session's high/low border.
Off: Hide any session completely to declutter your chart.
Granular Color Customization: Every session and sub-session has its own individual color picker, giving you full control over your chart's aesthetics.
Custom Alerts: Never miss a session start again. Enable alerts for any specific main or sub-session you want to track.
Full Timezone Support: Easily sync the indicator to your local time using a UTC offset (defaulting to NY time, UTC-4) or your exchange's timezone.
How to Use
Go into the indicator Settings.
For each session, configure the Time, Color, and Display Style to your preference.
Check the Alert box for any session you wish to receive a notification for when it begins.
Adjust the global UTC Timezone Offset in the final settings tab to match your trading clock.
How to Set Alerts
First, go into the indicator's Settings and check the "Alert" box for each session you want to be notified about.
Click the "Alert" button on the TradingView toolbar (the alarm clock icon).
In the Condition dropdown, select "Session Pro".
In the dropdown directly below it, choose the option "Any alert() function call".
Select your preferred notification method (e.g., Pop-up, Email, App Notification) and click "Create".
Hope this tool helps you better visualize market structure and time your trades more effectively. Happy trading!
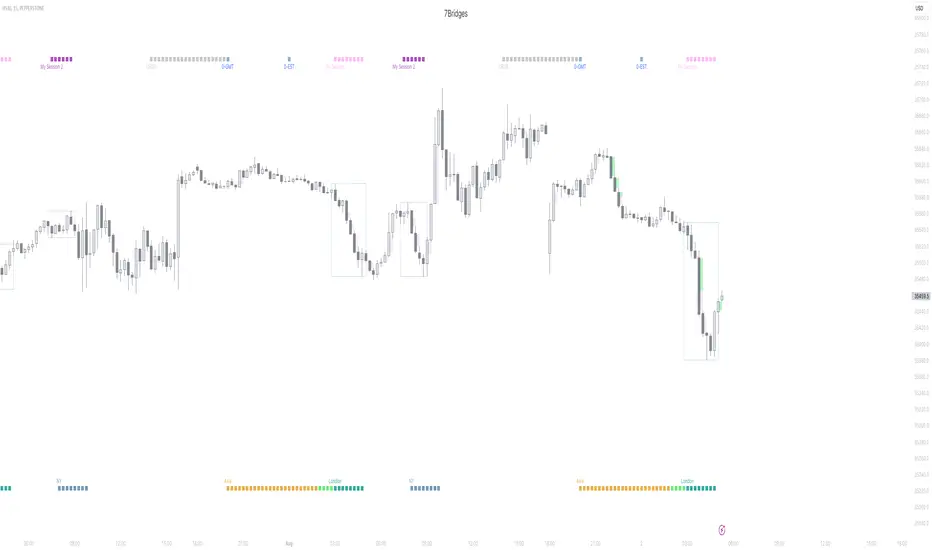
Session KillZones [7Bridges]Session Killzones by 7Bridges indicator display the killzones of asian, LND and NY sessions. There is also a custom session of your choice.
The times of each killzone are GMT time and you can adjust it in the settings.
You have also the beginning of the day, GMT and EST timezones.
By default the killzones are set like that on the GMT/UTC timezone :
-> Asia : 00:00 - 06:00
-> Pre London : 06:00 - 07:00
-> London : 07:00 - 10:00
-> New York : 12:00 - 15:00
-> Custom session : choose your own time
What makes the indicator very different is that the session is not overlapping the price but you have bars below and above the price.
Settings:
-> you can chose to display the Killzones (Asia, pre LND, LND and NY)
-> you can manages the time of the sessions
-> you can chose to display the start of the day (GMT/UTC and EST )
The indicator is displayed by default only for all the timeframes below 60min.
Session Liquidity [TakingProphets]Session Liquidity
Session Liquidity maps the intraday landscape that ICT/SMC traders care about: each session’s high/low prints, key opens (Midnight, True Day/6PM, 8:30), and prior period reference levels (Previous Week/Day and optional Mon/Tue/Wed). It auto-draws and extends clean horizontal levels, updates them live, and optionally preserves “mitigated” tags so you can review what price consumed. To keep charts readable, overlapping labels at the same price are merged into a single combined label (e.g., LON.H + PDH + PWH) with smart anti-overlap placement.
What it does (at a glance)
– Tracks Asia, London, NY AM, NY Lunch, and NY PM session highs/lows in your chosen timezone (default America/New_York).
– Draws key opens: Midnight Open, True Day Open (6 PM), and 8:30 Open.
– Plots Previous Week High/Low (PWH/PWL) and Previous Day High/Low (PDH/PDL) with optional Mon/Tue/Wed references.
– Live extension: lines extend to the current bar; when a level is traded through you can either remove it or keep a left-anchored “mitigated” label.
– Combined labels: when multiple levels share the same price, the script shows one label listing all tokens (e.g., LON.L + PWL).
– Timeframe governor: a Timeframe Limit hides drawings on higher resolutions to avoid clutter (e.g., show on ≤ 30 min only).
– Styling controls: per-feature colors, dotted/dashed/solid styles, and label size/position (session labels left/center/right logic handled via label types and offsets).
How it works:
– Sessions are defined with TradingView’s session input strings. While you are “in session,” the script updates running highs/lows and stores their bar indices. When the session closes, it freezes the prints and draws two horizontal lines: one at the session high (token “ASIA.H”, “LON.H”, “NYAM.H”, “NYLU.H”, “NYPM.H”) and one at the session low (“…L”).
– Prior period levels come from higher-timeframe requests: Previous Week’s High/Low from W, Previous Day from D (plus Mon/Tue/Wed using simple daily offsets). New periods wipe and redraw lines/labels cleanly.
– Key opens are stamped exactly when they occur (00:00 for Midnight, 18:00 for True Day, 08:30 for the print), then extended forward.
– Mitigation logic: if price trades beyond a level, either remove it entirely (Show Mitigated Levels = off) or stop extending the line and drop a small, persistent left-justified label where mitigation occurred (Show Mitigated Levels = on).
– Label combining: on each update, per-level labels are optionally cleared and replaced with one combined label per price level. The script groups by tick index, merges tokens (e.g., LON.H + PDH), and uses a small vertical offset loop to avoid label collisions at the same x-position.
Inputs you control
– Timeframe Limit: drawings will not appear on charts greater than or equal to this resolution.
– Timezone: default America/New_York.
– Label Settings
– Show Labels / Show Session High/Low Levels.
– Show Mitigated Levels: keep a small label where a level was traded through.
– Combine overlapping level labels: merge tokens into one label if prices match.
– Label sizes for levels and for session start/end text (sizes: Tiny/Small/Normal/Large).
– Visual Settings
– Colors for level lines and label text.
– Styles (Solid/Dashed/Dotted) for Previous Week and Previous Day blocks.
– Custom Labels
– Rename tokens for each session print (e.g., ASIA.H, LON.L, NYAM.H, etc.) to match your playbook.
– Key Opens
– Toggle Midnight Open, True Day Open (6 PM), and 8:30 Open lines; customize colors.
– Previous Week / Previous Day
– Toggle PWH/PWL and PDH/PDL; optionally plot Mon/Tue/Wed reference prints.
– Macro Sessions (toodegrees-style bracket)
– Toggle two macro windows (9:45–10:15 and 10:45–11:15).
– Choose bracket height in ticks, line style, label size/text, and optional price projection.
– The bracket is dynamic during its window (extends across the window; top adapts to new highs + chosen height; label centers on completion).
How to use it:
Pick your Timeframe Limit (e.g., 30) so the map only shows where you execute.
Enable the sessions you trade and keep the timezone aligned to your venue.
Turn on the prior period levels you care about (PWH/PWL, PDH/PDL, Mon/Tue/Wed).
Choose whether to preserve mitigated levels. If you journal, keeping mitigated tags helps with post-session review.
Enable combined labels to reduce clutter and spotlight confluence (e.g., LON.H aligning with PDH).
Use Macro windows for playbook timing (9:45–10:15, 10:45–11:15) to visualize typical volatility brackets.
Practical notes
– The indicator is a context and mapping tool; it does not produce signals. Use with your own bias, PD arrays, and execution model.
– Very long lookbacks or many toggles can push object limits on lower-powered machines. Use Timeframe Limit and feature toggles to keep things light.
– If you use custom sessions, ensure they do not overlap unexpectedly in your timezone.
– “Combine labels” intentionally removes per-level labels in favor of one merged label per price level; mitigated labels are preserved by design.
What’s unique here
– A full intraday “session print” system (Asia/London/NY AM/NY Lunch/NY PM) with clean freezing at session close and live line extension.
– True Day/Midnight/8:30 opens integrated into the same framework for a single, coherent liquidity map.
– Prior period structure (week/day + optional Mon/Tue/Wed) and toodegrees-style macro windows in one tool.
– Robust label merging by tick level with anti-overlap logic so multi-signal confluence is readable at a glance.


Sessions Pro+ (@JP7FX)Sessions Pro Plus (JP7FX)
Sessions Pro Plus marks key trading sessions and gives real time session information. It helps traders track session behaviour without manual work.
Session Info Panel
Shows live updates for Tokyo, Frankfurt, London and New York.
Displays if session highs or lows are intact or taken.
Includes a countdown to the next session start.
Range High and Low Alerts
Alerts trigger when a session high or low is breached.
Useful for monitoring breaks, sweeps and changes in behaviour.
Daily Open Bias
Shows whether price is above or below the daily open.
Helps traders understand directional conditions quickly.
Custom Session Settings
Session times can be adjusted to fit personal trading hours.
Sessions can be renamed and recoloured for clarity.
Webhook and Real Time Alerts
Alerts support webhook integrations for external platforms, including Discord.
Countdown Timers
Displays countdowns to the next session open to help plan ahead.
This indicator is designed for traders who follow session timing, session highs and lows, and daily open behaviour. It aims to simplify chart preparation and reduce the need to track session information manually.

Session Visualizer by Timezone (Fixed)Session Visualizer by Timezone (Asia, London, New York)
This indicator highlights the Asian, London, and New York trading sessions directly on your chart — adjusted to your local timezone (via UTC offset).
🔧 Key Features:
Session times automatically adjust based on your chosen UTC offset
Toggle each session on/off individually
Custom background colors for each session
Designed for all intraday timeframes (1m – 4H)
📍 Sessions Covered:
Asian Session – Generally lower volatility and slower price movement; ideal for range traders and pre-positioning
London Session – Marked increase in volatility as European markets open
New York Session – Highest volume and volatility, especially during the London-New York overlap
🕓 Time Offset Setting:
Input your local UTC offset (e.g., UTC+10 for Sydney, UTC+1 for Berlin, UTC-5 for New York). The indicator adjusts session display accordingly.

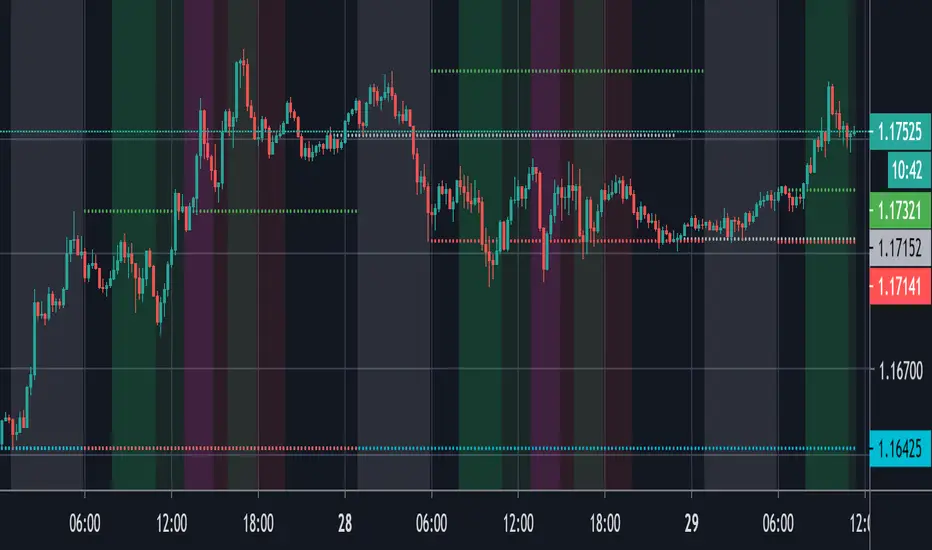
Session Range ProjectionsSession Range Projections
Purpose & Concept:
Session Range Projections is a comprehensive trading tool that identifies and analyzes price ranges during user-defined time periods. The indicator visualizes high-probability reversal zones and profit targets by projecting Fibonacci levels from custom session ranges, making it ideal for traders who focus on time-based market structure analysis.
Key Features & Calculations:
1. Custom Time Range Analysis
- Define any time period for range calculation - from traditional sessions (Asian, London, NY) to custom periods like opening ranges, hourly ranges, or 4-hour blocks
- Automatically captures the highest and lowest prices within your specified timeframe
- Supports multiple timezone selections for global market analysis
- Flexible enough for intraday scalping ranges or longer-term swing trading setups
2. Premium & Discount Zones
- Automatically divides the range into premium (above 50%) and discount (below 50%) zones
- Visual differentiation helps identify institutional buying and selling areas
- Color-coded boxes clearly mark these critical price zones
3. Optimal Trade Entry (OTE) Zones
- Highlights the 79-89% retracement zone in premium territory
- Highlights the 11-21% retracement zone in discount territory
- These zones represent high-probability reversal areas based on institutional order flow concepts
4. Fibonacci Projections
- Projects 11 customizable Fibonacci extension levels from the range extremes
- Levels extend both above and below the range for symmetrical analysis
- Each level can be individually toggled and color-customized
- Default levels include common retracement ratios: -0.5, -1.0, -2.0, -2.33, -2.5, -3.0, -4.0, -4.5, -6.0, -7.0, -8.0
How to Use:
Set Your Time Range: Input your desired session start and end times (24-hour format)
Select Timezone: Choose the appropriate timezone for your trading session
Customize Display: Toggle various visual elements based on your preferences
Monitor Price Action: Watch for reactions at projected levels and OTE zones
Set Alerts: Configure sweep alerts for when price breaks above/below range extremes
Input Parameters Explained:
Time Range Settings
Range Start/End Hour & Minute: Define your analysis period
Time Zone: Ensure accurate session timing across different markets
Visual Settings
Range Box: Toggle the premium/discount zone visualization
Horizontal Lines: Customize high/low line appearance
Internal Range Levels: Show/hide equilibrium and OTE zones
Labels: Configure text display for key levels
Fibonacci Projections: Enable/disable extension levels
Display Settings
Historical Ranges: Show up to 10 previous session ranges
Alert Type: Choose between high sweep, low sweep, or both
Trading Applications:
Session-Based Trading: Analyze specific market sessions (Asian, London, New York, opening ranges, hourly ranges)
Reversal Trading: Identify high-probability reversal zones at OTE levels
Breakout/Reversal Trading: Monitor range breaks/reversals with built-in sweep alerts
Risk Management: Use Fibonacci projections as profit targets or rejection areas
Multi-Timeframe Analysis: Apply to any timeframe for various trading styles
Important Notes:
This indicator is for educational purposes only and should not be considered financial advice
Past performance does not guarantee future results
Always use proper risk management when trading
The indicator automatically manages historical data to maintain chart performance

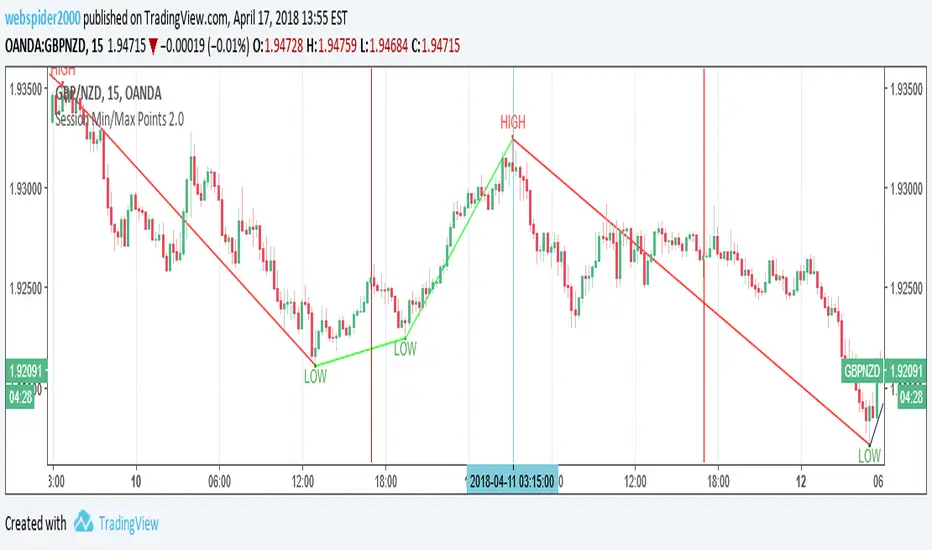
Session High/Low indicator Session High/Low – London & Asia” is a TradingView indicator that automatically identifies and marks the single highest high and lowest low of each London and Asia trading session. At the close of each session, it draws clean horizontal rays extending to the right—one at the exact bar where the session’s peak price occurred and one where the trough occurred—so you can instantly spot key support and resistance levels without cluttering your chart.

Session Range by Black Dragon (Timezone + Days + Weekend)Session Range by Black Dragon (Timezone + Days + Weekend)

SessionsOverview of the "Sessions" Indicator
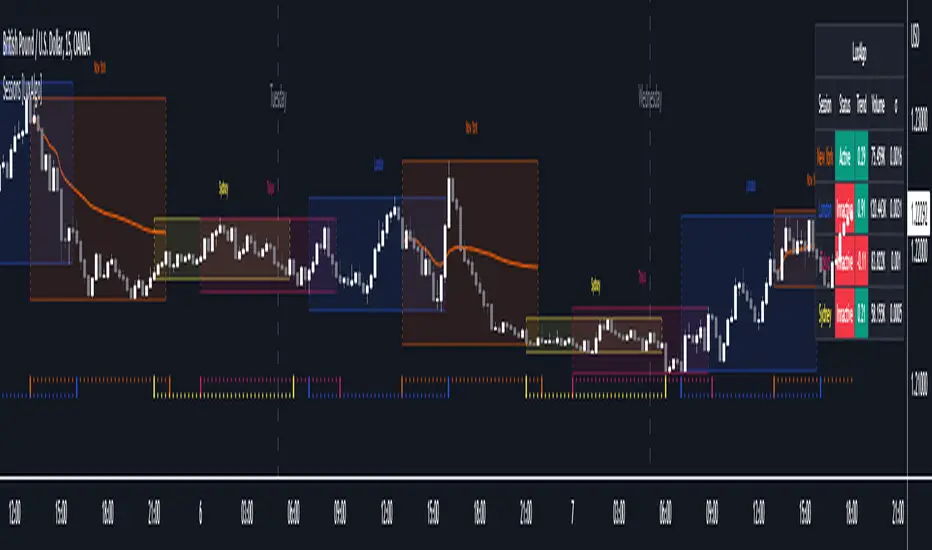
The "Sessions" indicator is a powerful tool designed for traders who want to visualize and analyze the market activity during different global trading sessions directly on their charts. This indicator highlights the London, New York, Tokyo, and Sydney sessions with distinct background colors, making it easy to see when each market is open.
Key Features
Session Visualization: The indicator provides clear visual cues for the active trading sessions, allowing traders to quickly identify periods of high market activity.
Customizable Timeframes: Users can set their preferred resolution for viewing session data, making it adaptable to any trading strategy.
Automatic Session Detection: The indicator automatically detects the start and end of each session based on specified times, updating in real-time as the market progresses.
Practical Applications
Trend Identification: By observing how prices move during specific sessions, traders can identify trends and make informed predictions about future price movements.
Volatility Analysis: Different sessions often exhibit varying levels of volatility. This indicator helps traders anticipate potential price spikes or lulls during these times.
Strategy Optimization: Traders can optimize their strategies by focusing on sessions that align with their trading style, whether it's the high volatility of the London session or the quieter Sydney session.
Market Overlap: The indicator makes it easy to see when sessions overlap, which is typically when the market experiences increased liquidity and volatility.
Conclusion
The "Sessions" indicator is an essential tool for traders looking to enhance their market analysis by visualizing global trading sessions. Whether you're a day trader seeking to capitalize on volatile market conditions or a swing trader looking for optimal entry and exit points, this indicator provides valuable insights into market dynamics.


SessionsHighlighting Asia, London, NY session
Showing Asia range for the day
Highlighting London open, NY open, London close range
Showing daily, weekly, monthy open
The grey range is the Asia open, then the asia range is build for the day (red & green dots).
Then I put in 2 hours of London opening - during London session.
Then NY open is adding with the overlap of London & NY.
Then 2h of London close is shown.
Finally the day is done by end of NY session.
The make use of good entries, the open quotes for the day (white dots), week (blue dots) and month (yellow dots) are shown, too.
You can disable any of the elements above within the settings.
To make is more meaningful, the sessions are highlighted only in lower timeframes below 1h.
Session Bar Color (US Time)This script is designed to change the color of bars on a trading chart based on different trading sessions in Eastern Time (ET). It is different from currently published scripts in that it specifically focuses on US time sessions and provides a customizable approach to defining and coloring each session.
To use this script, you can apply it to a chart by selecting it from the list of available indicators or overlays.
The script is meant for traders who are interested in visualizing different trading sessions on their charts. By coloring the bars based on session boundaries, it can help traders quickly identify session changes and potentially adjust their trading strategies accordingly. Mostly it's used to draw the high and low zones of each session.
The markets this script is suitable for are those that operate within the US time zones, as it specifically focuses on Eastern Time (ET) sessions. It can be used for various types of markets, including stocks, futures, and forex.
The conditions for each session are defined using the input. session function, which allows you to specify the start and end times for each session. The script includes four sessions: Asian, London, USA, and New York. By modifying the defval parameter for each session input, you can customize the session times to fit your specific trading preferences or time zone.
The script uses the time function to check if the current bar falls within a particular session. If the condition is met, it sets the color of the bar using the bar color function. Each session is assigned a different color: black for the Asian session, teal for the London session, a custom RGB color (dark red) for the USA session, and red for the New York session.
It's important to note that this script assumes the time zone of the trading platform is set to "Etc/GMT+4" to align with Eastern Time (ET). If your platform uses a different time zone, you may need to adjust the time function calls to match your desired time zone.

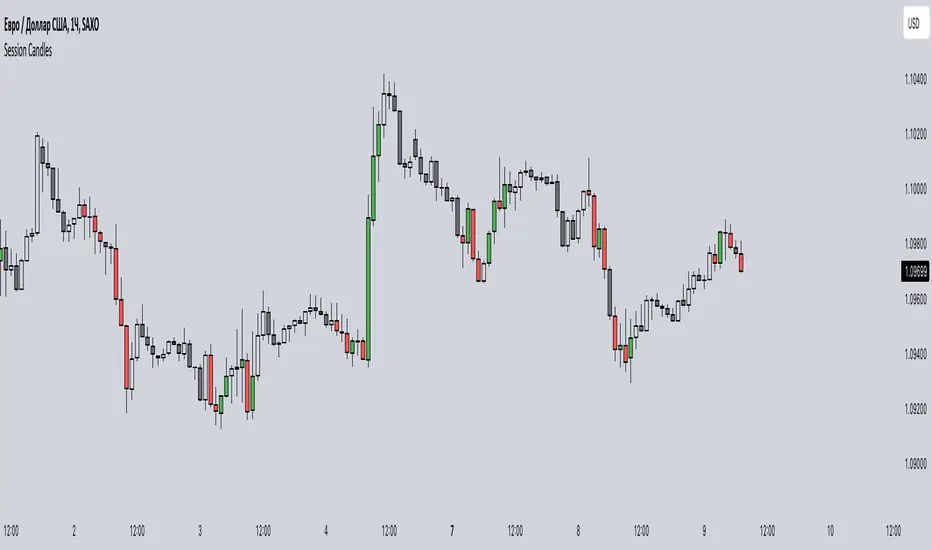
Session CandlesThis indicator is designed to visually represent different trading sessions on a price chart, highlighting candlestick colors to distinguish between bullish (upward movement) and bearish (downward movement) trends during various market sessions. Here's an overview of how the indicator works:
1. Session Definition: The indicator defines four distinct trading sessions:
- London Session: Typically covering the European trading hours.
- New York AM Session: Representing the morning hours of the New York trading session.
- New York PM Session: Representing the afternoon hours of the New York trading session.
- Asia Session: Encompassing the trading hours of the Asian markets.
2. Configuration Options: Users can customize the behavior of the indicator through input options. For each session, users can enable or disable the display of session-specific candles.
3. Candle Coloring: The indicator determines the color of candles based on the following criteria:
- For each session, it checks whether the current candle's closing price is higher than its opening price.
- If the closing price is higher, the candle is considered bullish, and a user-defined green color is used for the candle.
- If the closing price is lower, the candle is considered bearish, and a user-defined red color is applied.
4. Display: The indicator then applies the calculated candle colors to the respective candles of each trading session on the price chart. This visual distinction helps traders quickly identify the prevailing trend during different market sessions.
To use the indicator, traders can overlay it on their price charts in TradingView. By enabling or disabling specific trading sessions, they can focus on the trends and price movements during those specific time periods.
Please note that the actual appearance of the indicator on the chart depends on the user's chosen settings for session enablement and color preferences.
Session Sweeps [LuxAlgo]The Session Sweeps indicator combines ICT-based features for a complete trading methodology involving market sessions, market structure, and fair value gaps to find optimal entry conditions for trading price action.
Traders frequently tend to place stop/limit orders at the high and low points of major trading sessions such as Asian (Tokyo), European (London), and North American (New York), resulting in the establishment of liquidity pools at those particular levels. The Session Sweeps indicator is crafted to recognize and underscore occurrences of session sweeps or liquidity sweeps during these major trading sessions.
🔶 USAGE
Default settings utilize major forex trading sessions, yet users can select their preferred opening and closing times, rename the sessions, or adjust the colors. It's important to note that the specified times for each session align with the respective local timezones: Asian (Tokyo) UTC+9, European (London) UTC, and North American (New York) UTC-5.
If the price briefly crosses either the highest or lowest point of a market session. These movements, aiming at triggering stop losses, suggest potential shifts in the market direction. Detecting such movements is the fundamental purpose and core functionality of the script.
🔹Market Structure Shifts
A Market Structure Shift refers to a change in market direction, either from an uptrend to a downtrend or vice versa. A part of a common entry model when using session sweeps is waiting for the formation of a CHoCH after a session sweep.
🔹Fair Value Gaps
A Fair Value Gap (FVG) holds particular appeal for price action traders, emerging when there are inefficiencies or imbalances in the market, often a result of uneven buying and selling activity. The underlying concept of FVGs is that the market tends to revisit these inefficiencies before resuming its trajectory in alignment with the initial impulsive move.
After the formation of a CHoCH traders can enter a position when the price enters the area of a Fair Value Gap (FVG).
🔹Setup Examples
This entry setup is commonly used by ICT traders and is shared for informational & educational purposes only.
Long Positions (5-Minute Timeframe):
Wait for the previous session's low to be swept.
Look for a Bullish Choch.
Find a Bullish FVG formed by or before the Choch.
Entry Point: At the FVG.
Take Profit (TP): At the session high or aim for a 1:2 Risk-Reward Ratio.
Stop Loss (SL): At the session low or nearest Swing Low.
Take partial profits at intermediate swings, but don’t shift SL prematurely.
Short Positions (5-Minute Timeframe):
Wait for the previous session's high to be swept.
Look for a Bearish Choch.
Find a FVG formed by or before the Choch.
Entry Point: At the FVG.
Take Profit (TP): At the previous session's low or aim for a 1:2 RR.
Stop Loss (SL): At the session high or nearest Swing High.
Take partial profits at intermediate swings, but don’t shift SL prematurely.
🔶 SETTINGS
🔹Session Sweeps
Buyside Sweep Zones, Color, and Margin: toggles the visibility of bullside sweep zones, customizes the associated color, and sets the margin value defining the range of a bullside sweep zone.
Sellside Sweep Zones, Color, and Margin: toggles the visibility of sell-side sweep zones, customizes the associated color, and sets the margin value defining the range of a sell-side sweep zone.
Sweep Margin Length: specifies the maximum allowed length of a sweep zone invalidation, the length over which the price slightly invalidated the margin range.
Detect Sweeps Once per Session: if enabled will detect only once a sweep zone within a session.
Hide Fake Sweep Zones, and Color: controls the visibility and color of the fake sweep zones.
🔹Sessions
Session (Asia, London, New York AM, and New York PM), Start Time, and End Time: enables or disables the visibility of the named market session range, and customization of the session hours.
Color: color customization option of the named session.
Extend Max/Min: extends the highest and lowest price levels of the named session until the end of the next enabled session. This option is recommended to be enabled when sweep zone detection is activated to observe the relationship between the sweep zone and previous session extreme levels.
Extend Mid: extends the mean price levels of the named session until the end of the next enabled session. The extended line may serve as potential support and resistance levels.
Fill: enables/disables background coloring of the named session.
New York DST | London DST: enabling this option initiates Daylight Saving Time (DST) for New York or London. Note: Daylight Saving Time is not applied to the Asian (Tokyo) session.
Sessions Extreme Lines | Sessions Names: toggles the visibility of the highest and lowest price levels, as well as the names, for all market sessions.
Session Lines Width: sets the width of the lines for all sessions.
Session Fill Transparency: sets the background color transparency of the range for all sessions.
🔹Market Structure Shifts
Market Structure Shifts: toggles the visibility of market structure shifts, also known as change of character (CHoCH).
Detection Length: specifies the detection length.
Market Structure Shifts; Bull & Bear: color customization options.
🔹Fair Value Gaps
Fair Value Gaps: toggles the visibility of the fair value gaps.
Fair Value Gap Width Filter: specifies the filtering multiplier; additional details can be found in the tooltip of the respective input option.
Bullish & Bearish Imbalance: color customization options.
🔹Sessions Tabular View
Sessions Tabular View: toggles the visibility of the tabular view of the sessions, displaying date &time, status, and countdown counter.
Hide if not Forex Market Instrument: checks the market and automatically enables/disables the option based on the market instrument.
Table Text Size & Position: size and placement customization options
🔶 LIMITATIONS
Please be aware that fair value gap filtering cannot be applied to the initial 144 candles (with a fixed-length ATR) as the ATR value necessary for filtering won't be available during this period.
🔶 RELATED SCRIPTS
Buyside-Sellside-Liquidity
Sessions
Liquidity-Voids-FVG
Thank you to our community for the recommendation of this script. To explore additional conceptual scripts and related content, we invite you to visit >>> LuxAlgo-Scripts .

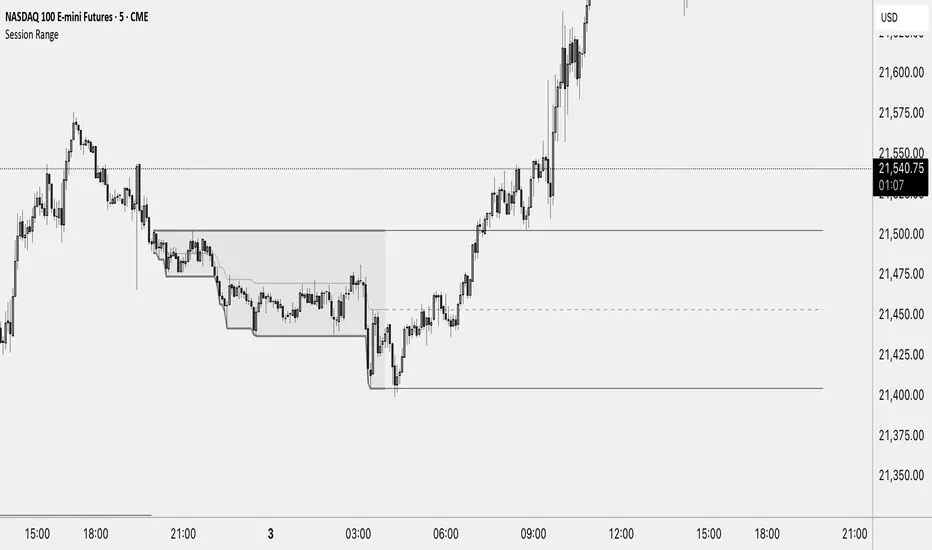
Session RangeThis Indicator Shows you the high, low and the midpoint for a chosen session and displays them on the chart.
You can make the following inputs:
Timezone: Choose your time zone (in UTC) to display the session correctly
Session Time: Choose the start time and end time of the session you want to have displayed.
Show Session Midpoint: Choose between displaying or not displaying the midpoint of the sessions high and low.
Extend Session Values until next Session: Choose this option if you want to display the sessions range until the next session starts. The midpoint will only be displayed if you chose "yes" at "Show Session Midpoint?"
Maximum number of bars between sessions: This is needed to ensure the correct display of the extended lines. Also this will affect the running speed of the script.
Limitations:
A higher number between bars slows down the script. What does that mean practically? If you choose to not have the sessions values displayed until the next session you can set this to 1 and the script will run as fast as it can. If you choose to display all the values until the next session you have to make sure that the number you put in is higher than the number of bars between the sessions. Otherwise the lines will be displayed backwards. As this affects the calculation speed you want to keep the number as low as possible. The default setting is 300 which is fine for 5 minute charts. On a 1 minute chart you will have to use something around 5000 depending on how long your session is.
Also the script will only run correctly if the start time of your session can be divided by the timeframe you are using. Example: you can use a 1min, 3min, 5min, or 15min chart on all sessions as they can only start every 15 minutes and 15 can be divided by all these numbers. A 2 minute timeframe will only work on sessions that start at minute 00 or 30, as 15 and 45 can not be divided by 2.
Customization and Alerts:
You can change the color of the sessions high, low, midpoint and background filling. The line style can also be changed but this might lead to a faulty display of the session.
The style of the extension lines can not be altered.
Alerts can be added for crossing the sessions high or low (after the session is finished). You do not have to display the extension lines in order to set an alert.
credit: The inspiration (especially for the look of this indicator) comes from the Asian Range by Nico948 indicator.
Session-Based Sentiment Oscillator [TradeDots]Track, analyze, and monitor market sentiment across global trading sessions with this advanced multi-session sentiment analysis tool. This script provides session-specific sentiment readings for Asian (Tokyo), European (London), and US (New York) markets, combining price action, volume analysis, and volatility factors into a comprehensive sentiment oscillator. It is an original indicator designed to help traders understand regional market psychology and capitalize on cross-session sentiment shifts directly on TradingView.
📝 HOW IT WORKS
1. Multi-Component Sentiment Engine
Price Action Momentum : Calculates normalized price movement relative to recent trading ranges, providing directional sentiment readings.
Volume-Weighted Analysis : When volume data is available, incorporates volume flow direction to validate price-based sentiment signals.
Volatility-Adjusted Factors : Accounts for changing market volatility conditions by comparing current ATR against historical averages.
Weighted Combination : Merges all components using optimized weightings (Price: 1.0, Volume: 0.3, Volatility: 0.2) for balanced sentiment readings.
2. Session-Segregated Tracking
Automatic Session Detection : Precisely identifies active trading sessions based on user-configured time parameters.
Independent Calculations : Maintains separate sentiment accumulation for each major session, updated only during respective active hours.
Historical Preservation : Stores session-specific sentiment values even when sessions are closed, enabling cross-session comparison.
Real-Time Updates : Continuously processes sentiment during active sessions while preserving inactive session data.
3. Cross-Session Transition Analysis
Sentiment Differential Detection : Monitors sentiment changes when transitioning between trading sessions.
Configurable Thresholds : Generates signals only when sentiment shifts exceed user-defined minimum thresholds.
Directional Signals : Provides distinct bullish and bearish transition alerts with visual markers.
Smart Filtering : Applies smoothing algorithms to reduce false signals from minor sentiment variations.
⚙️ KEY FEATURES
1. Session-Specific Dashboard
Real-Time Status Display : Shows current session activity (ACTIVE/CLOSED) for all three major sessions.
Sentiment Percentages : Displays precise sentiment readings as percentages for easy interpretation.
Strength Classification : Automatically categorizes sentiment as HIGH (>50%), MEDIUM (20-50%), or LOW (<20%).
Customizable Positioning : Place dashboard in any corner with adjustable size options.
2. Advanced Signal Generation
Transition Alerts : Triangle markers indicate significant sentiment shifts between sessions.
Extreme Conditions : Diamond markers highlight overbought/oversold threshold breaches.
Configurable Sensitivity : Adjust signal thresholds from 0.05 to 0.50 based on trading style.
Alert Integration : Built-in TradingView alert conditions for automated notifications.
3. Forex Currency Strength Analysis
Base/Quote Decomposition : For forex pairs, separates sentiment into individual currency strength components.
Major Currency Support : Analyzes USD, EUR, GBP, JPY, CHF, CAD, AUD, NZD strength relationships.
Relative Strength Display : Shows which currency is driving pair movement during active sessions.
4. Visual Enhancement System
Session Background Colors : Distinct background shading for each active trading session.
Overbought/Oversold Zones : Configurable extreme sentiment level visualization with colored zones.
Multi-Timeframe Compatibility : Works across all timeframes while maintaining session accuracy.
Customizable Color Schemes : Full color customization for dashboard, signals, and plot elements.
🚀 HOW TO USE IT
1. Add the Script
Search for "Session-Based Sentiment Oscillator " in the Indicators tab or manually add it to your chart. The indicator will appear in a separate pane below your main chart.
2. Configure Session Times
Asian Session : Set Tokyo market hours (default: 00:00-09:00) based on your chart timezone.
European Session : Configure London market hours (default: 07:00-16:00) for European analysis.
US Session : Define New York market hours (default: 13:00-22:00) for American markets.
Timezone Adjustment : Ensure session times match your broker's specifications and account for daylight saving changes.
3. Optimize Analysis Parameters
Sentiment Period : Choose 5-50 bars (default: 14) for sentiment calculation lookback period.
Smoothing Settings : Select 1-10 bars smoothing (default: 3) with SMA, EMA, or RMA options.
Component Selection : Enable/disable volume analysis, price action, and volatility factors based on available data.
Signal Sensitivity : Adjust threshold from 0.05-0.50 (default: 0.15) for transition signal generation.
4. Interpret Readings and Signals
Positive Values : Indicate bullish sentiment for the active session.
Negative Values : Suggest bearish sentiment conditions.
Dashboard Status : Monitor which session is currently active and their respective sentiment strengths.
Transition Signals : Watch for triangle markers indicating significant cross-session sentiment changes.
Extreme Alerts : Note diamond markers when sentiment reaches overbought (>70%) or oversold (<-70%) levels.
5. Set Up Alerts
Configure TradingView alerts for:
- Bullish session transitions
- Bearish session transitions
- Overbought condition alerts
- Oversold condition alerts
❗️LIMITATIONS
1. Data Dependency
Volume Requirements : Volume-based analysis only functions when volume data is provided by your broker. Many forex brokers do not supply reliable volume data.
Price Action Focus : In absence of volume data, sentiment calculations rely primarily on price movement and volatility factors.
2. Session Time Sensitivity
Manual Adjustment Required : Session times must be manually updated for daylight saving time changes.
Broker Variations : Different brokers may have slightly different session definitions requiring time parameter adjustments.
3. Ranging Market Limitations
Trend Bias : Sentiment calculations may be less reliable during extended sideways or low-volatility market conditions.
Lag Consideration : As with all sentiment indicators, readings may lag during rapid market transitions.
4. Regional Market Focus
Major Session Coverage : Designed primarily for major global sessions; may not capture sentiment from smaller regional markets.
Weekend Gaps : Does not account for weekend gap effects on sentiment calculations.
⚠️ RISK DISCLAIMER
Trading and investing carry significant risk and can result in financial loss. The "Session-Based Sentiment Oscillator " is provided for informational and educational purposes only. It does not constitute financial advice.
- Always conduct your own research and analysis
- Use proper risk management and position sizing in all trades
- Past sentiment patterns do not guarantee future market behavior
- Combine this indicator with other technical and fundamental analysis tools
- Consider overall market context and your personal risk tolerance
This script is an original creation by TradeDots, published under the Mozilla Public License 2.0.
Session-based sentiment analysis should be used as part of a comprehensive trading strategy. No single indicator can predict market movements with certainty. Exercise proper risk management and maintain realistic expectations about indicator performance across varying market conditions.

Session High and Session LowI have heard many people ask for a script that will identify the high and low of a specific session. So, I made one.
Important Note: This indicator has to be set up properly or you will get an error. Important things to note are the length of the range and the session definition. The idea is that you would set it up for what's relevant to your trading. Going too far back in the chart history will cause errors. Setting the session for a time that is not on the chart can cause errors. If you set it to look farther back than there are bars to display, you may get an error. What I've found is that if you get an error, you just need to change the settings to reflect available data and it will be able to compile the script. At the time of its publishing, the default range start is set to 10/01/2020. If you're looking at this years later, you'll probably have to set the range to something more recent.
Features:
Plot or Lines:
Using Plot (displayed), the indicator will track the high/low from the end of the session into the next session. Then at the start of the next session, it will start tracking the high/low of that session until its end, then track that high/low until the start of the next session then reset.
Using lines, it will extend horizontal lines to the right indefinitely. The number of sessions back that the lines apply to is a user-defined number of sessions. There are limits to the number of lines that can be cast on a chart (roughly 40-50). So, the maximum number of sessions you can apply the lines to is the last 21 sessions (42 lines total). That gets really noisy though so I can't imagine that is a limiting factor.
Colors:
You can change the background color and its transparency, as well as turn the background color on or off.
You can change the highs and lows colors
You can adjust the line width to your preference
Session Length:
You can use a continuous session covering any user-defined period (provided its not tooooo many candles back)
You can define the session length for intraday
You can exclude weekends
Display Options:
You can adjust the colors, transparency, and linewidth
You can display the plotline or horizontal lines
You can show/hide the background color.
You can change how many sessions back the horizontal lines will track
Let me know if there's anything this script is missing or if you run into any issues that I might be able to help resolve.
Here's what it looks like with Lines for the last 5 sessions and different background color.

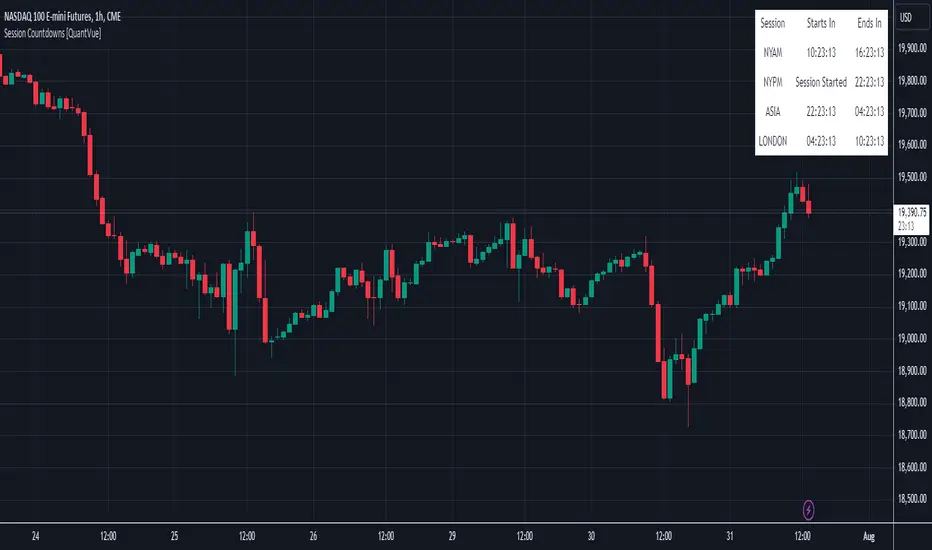
Session Countdowns [QuantVue]The Session Countdowns indicator is a powerful tool designed for traders who want to keep track of multiple trading sessions throughout the day. This indicator allows users to customize and monitor up to four different trading sessions with real-time countdowns until the session starts and ends.
Customizable Sessions:
Define up to four trading sessions with specific start and end times.
Customize session names for easy identification (e.g., NYAM, NYPM, ASIA, LONDON).
Real-Time Countdown:
Displays countdown timers for each session, showing time remaining until the session starts and ends.
Real-time updates ensure accurate and timely information.
Display Options:
Choose the display position on the chart (Top, Middle, Bottom) and alignment (Left, Center, Right).
Select table size.
Dynamic color theme adjusts the text and background colors based on the session status (upcoming, active, ending soon).
Alerts:
Receive alerts 30 minutes before a session starts, ensuring you never miss a crucial trading period.
Alerts can be customized for each session, providing timely reminders.
Give this indicator a BOOST and COMMENT your thoughts below!
We hope you enjoy.
Cheers!
Session candles & reversals / Flowly Indicators— Overview
Like traditional candles, session based candles are a visualization of open, high, low and close values, but based on session time periods instead of typical timeframes such as daily or weekly. Session candles are formed by fetching price at session start (open), highest price during session (high), lowest price during session (low) and price at session end (close). On top of candles, session based moving average is formed and session reversals detected. Session reversals are also backtested, using win rate and magnitude metrics to better understand what to expect from session reversals and which ones have historically performed the best.
By default, following session time periods are used:
Session #1: London (08:00 - 17:00, UTC)
Session #2: New York (13:00 - 22:00, UTC)
Session #3: Sydney (21:00 - 06:00, UTC)
Session #4: Tokyo (00:00 - 09:00, UTC)
Session time periods can be changed via input menu.
— Reversals
Session reversals are patterns that show a rapid change in direction during session. These formations are more familiarly known as wicks or engulfing candles. Following criteria must be met to qualify as a session reversal:
Wick up:
Lower high, lower low, close >= 65% of session range (0% being the very low, 100% being the very high) and open >= 40% of session range.
Wick down:
Higher high, higher low, close <= 35% of session range and open <= 60% of session range.
Engulfing up:
Higher high, lower low, close >= 65% of session range.
Engulfing down:
Higher high, lower low, close <= 35% of session range.
Session reversals are always based on prior corresponding session , e.g. to qualify as a NY session engulfing up, NY session must have a higher high and lower low relative to prior NY session , not just any session that has taken place in between. Session reversals should be viewed the same way wicks/engulfing formations are viewed on traditional timeframe based candles. Essentially, wick reversals (light green/red labels) tell you most of the motion during session was reversed. Engulfing reversals (dark green/red labels) on the other hand tell you all of the motion was reversed and new direction set.
— Backtesting
Session reversals are backtested using win rate and magnitude metrics. A session reversal is considered successful when next corresponding session closes higher/lower than session reversal close . Win rate is formed by dividing successful session reversal count with total reversal count, e.g. 5 successful reversals up / 10 reversals up total = 50% win rate. Win rate tells us what are the odds (historically) of session reversal producing a clean supporting move that was persistent enough to close that way too.
When a session reversal is successful, its magnitude is measured using percentage increase/decrease from session reversal close to next corresponding session high/low . If NY session closes higher than prior NY session that was a reversal up, the percentage increase from prior session close (reversal close) to current session high is measured. If NY session closes lower than prior NY session that was a reversal down, the percentage decrease from prior session close to current session low is measured.
Average magnitude is formed by dividing all percentage increases/decreases with total reversal count, e.g. 10 total reversals up with 1% increase each -> 10% net increase from all reversals -> 10% total increase / 10 total reversals up = 1% average magnitude. Magnitude metric supports win rate by indicating the depth of successful session reversal moves.
To better understand the backtesting calculations and more importantly to verify their validity, backtesting visuals for each session can be plotted on the chart:
All backtesting results are shown in the backtesting panel on top right corner, with highest win rates and magnitude metrics for both reversals up and down marked separately. Note that past performance is not a guarantee of future performance and session reversals as they are should not be viewed as a complete strategy for long/short plays. Always make sure reversal count is sufficient to draw reliable conclusions of performance.
— Session moving average
Users can form a session based moving average with their preferred smoothing method (SMA , EMA , HMA , WMA , RMA) and length, as well as choose which sessions to include in the moving average. For example, a moving average based on New York and Tokyo sessions can be formed, leaving London and Sydney completely out of the calculation.
— Visuals
By default, script hides your candles/bars, although in the case of candles borders will still be visible. Switching to bars/line will make your regular chart visuals 100% hidden. This setting can be turned off via input menu. As some sessions overlap, each session candle can be separately offsetted forward, clearing the overlaps. Users can also choose which session candles to show/hide.
Session periods can be highlighted on the chart as a background color, applicable to only session candles that are activated. By default, session reversals are referred to as L (London), N (New York), S (Sydney) and T (Tokyo) in both reversal labels and backtesting table. By toggling on "Numerize sessions", these will be replaced with 1, 2, 3 and 4. This will be helpful when using a custom session that isn't any of the above.
Visual settings example:
Session candles are plotted in two formats, using boxes and lines as well as plotcandle() function. Session candles constructed using boxes and lines will be clear and much easier on the eyes, but will apply only to first 500 bars due to Tradingview related limitations. Rest of the session candles go back indefinitely, but won't be as clean:
All colors can be customized via input menu.
— Timeframe & session time period considerations
As a rule of thumb, session candles should be used on timeframes at or below 1H, as higher timeframes might not match with session period start/end, leading to incorrect plots. Using 1 hour timeframe will bring optimal results as greatest amount historical data is available without sacrificing accuracy of OHLC values. If you are using a custom session that is not based on hourly period (e.g. 08:00 - 15:00 vs. 08.00 - 15.15) make sure you are using a timeframe that allows correct plots.
Session time periods applied by default are rough estimates and might be out of bounds on some charts, like NYSE listed equities. This is rarely a problem on assets that have extensive trading hours, like futures or cryptocurrency. If a session is out of bounds (asset isn't traded during the set session time period) the script won't plot given session candle and its backtesting metrics will be NA. This can be fixed by changing the session time periods to match with given asset trading hours, although you will have to consider whether or not this defeats the purpose of having candles based on sessions.
— Practical guide
Whether based on traditional timeframes or sessions, reversals should always be considered as only one piece of evidence of price turning. Never react to them without considering other factors that might support the thesis, such as levels and multi-timeframe analysis. In short, same basic charting principles apply with session candles that apply with normal candles. Use discretion.
Example #1 : Focusing efforts on session reversals at distinct support/resistance levels
A reversal against a level holds more value than a reversal by itself, as you know it's a placement where liquidity can be expected. A reversal serves as a confirming reaction for this expectation.
Example #2 : Focusing efforts on highest performing reversals and avoiding poorly performing ones
As you have data backed evidence of session reversal performance, it makes sense to focus your efforts on the ones that perform best. If some session reversal is clearly performing poorly, you would want to avoid it, since there's nothing backing up its validity.
Example #3 : Reversal clusters
Two is better than one, three is better than two and so on. If there are rapid changes in direction within multiple sessions consecutively, there's heavier evidence of a dynamic shift in price. In such case, it makes sense to hold more confidence in price halting/turning.

Sessions [LuxAlgo]This indicator shows when user set sessions are active and returns various tools + metrics using the closing price within active sessions as an input. Users have the option to change up to 4 session times.
The indicator will increasingly lack accuracy when the chart timeframe is higher than 1 hour.
Settings
Sessions
Enable Session: Allows to enable or disable all associated elements with a specific user set session.
Session Time: Opening and closing times of the user set session in the hh:mm format.
Range: Highlights the associated session range on the chart.
Trendline: Returns the associated session trendline on the chart.
Mean: Returns the associated session mean average on the chart.
VWAP: Returns the associated session volume weighted average price on the chart.
Ranges Settings
Range Area Transparency: Transparency of the area highlighting sessions ranges.
Range Outline: Highlights the borders of the session range area.
Range Label: Shows the session label at the mid-point of the session interval.
Dashboard
Show Dashboard: Enables sessions dashboard on the chart.
Advanced Dashboard: Returns more information regarding user set sessions on the dashboard.
Dividers
Show Session Divider: Highlights active sessions using intervals on the bottom of the chart (this can lead to less responsive charts)
Show Daily Divider: Highlights days on the chart.
Usage
This tool is versatile and allows the user to perform a wide variety of tasks all focusing on highlighting and analyzing price movements within a specific user set session in a periodic fashion.
Significant forex trading sessions are used by default, but the users are free to choose the opening and closing time of their choices.
Using ranges can indicate which sessions returned the most volatile price movements.
Trendlines can be useful to estimate the underlying trend of a specific session, but they can also offer a quick way to see which session started a trend reversal.
The session Mean highlights the equilibrium level within a session, extrapolating these levels can provide potential support and resistances levels of interest.
Finally, users can use the sessions VWAP's for real time applications, using them as trailing supports and resistances.
Using The Advanced Dashboard
The advanced dashboard returns useful information regarding the user set sessions. Each dashboard elements are described below:
Status: Highlights whether the user set session is active (open) of inactive (closed).
Trend: Shows correlation coefficient between the session prices and a linear sequence of values. Values above 0 indicates an up-trending session, while values under 0 indicates a down-trending session. Values closer to (1, -1) indicates a more trending session.
Volume: Shows accumulated volume within the session
σ (Standard Deviation): Shows standard deviation of the session, while this value is not bounded it can be useful to compare it with the other ones to see which session was the most volatile.
Note that when a session becomes inactive the value on the dashboard will hold until the specific session becomes active again.