VWAP StrategyVWAP and volatility filters for structured intraday trades.
How the Strategy Works
1. VWAP Anchored to Session
VWAP is calculated from the start of each trading day.
Standard deviations are used to create bands above/below the VWAP.
2. Entry Triggers: Al Brooks H1/H2 and L1/L2
H1/H2 (Long Entry): Opens below 2nd lower deviation, closes above it.
L1/L2 (Short Entry): Opens above 2nd upper deviation, closes below it.
3. Volatility Filter (ATR)
Skips trades when deviation bands are too tight (< 3 ATRs).
4. Stop Loss
Based on the signal bar’s high/low ± stop buffer.
Longs: signalBarLow - stopBuffer
Shorts: signalBarHigh + stopBuffer
5. Take Profit / Exit Target
Exit logic is customizable per side:
VWAP, Deviation Band, or None
6. Safety Exit
Exits early if X consecutive bars go against the trade.
Longs: X red bars
Shorts: X green bars
Explanation of Strategy Inputs
- Stop Buffer: Distance from signal bar for stop-loss.
- Long/Short Exit Rule: VWAP, Deviation Band, or None
- Long/Short Target Deviation: Standard deviation for target exit.
- Enable Safety Exit: Toggle emergency exit.
- Opposing Bars: Number of opposing candles before safety exit.
- Allow Long/Short Trades: Enable or disable entry side.
- Show VWAP/Entry Bands: Toggle visual aids.
- Highlight Low Vol Zones: Orange shading for low volatility skips.
Tuning Tips
- Stop buffer: Use 1–5 points.
- Target deviation: Start with VWAP. In strong trends use 2nd deviation and turn off the counter-trend entry.
- Safety exit: 3 bars recommended.
- Disable short/long side to focus on one type of reversal.
Backtest Setup Suggestions
- initial_capital = 2000
- default_qty_value = 1 (fixed contracts or percent-of-equity)
Cari dalam skrip untuk "vwap"

VWAP + Fibo Dev Extensions StrategyBased on my VWAP + Fibo deviations indicator, I tested some strategies to see if the indicator can be profitable; and I got it !
This strategy uses:
H1 timeframe
Weekly VWAP
+1.618 / +2.618 / -1.618 / -2.618 Deviations Extensions to create 2 bands
The value of the deviation
First, the 2 bands are plotted : +1.618/+2.618 painted in red and -1.618/-2.618 painted in lime.
Then, we wait for the deviation value to reach at least 150 (see thumbnail) to avoid littles moves when the gaps between bands are too short.
Entry long position :
first candle must crossunder the -1.618 level and low have to stay over the -2.618
low of the second one must stay in the lime band
enter the third one if the deviation value is over limit (150)
Exit long position :
TP : when a high crossover VWAP
SL : when a low crossunder -2.618
Entry short position :
first candle must crossover the +1.618 level and high have to stay under the +2.618
high of the second one must stay in the red band
enter the third one if the deviation value is over limit (150)
Exit short position :
TP : when a low crossunder VWAP
SL : when a high crossover +2.618
Notes :
this strategy uses pyramiding (5), be careful and calculate your risk management
the comission value is set to 0.08% to include slippages when entering a trade because of market orders
This strategy is not an advice to invest, make your own decisions.

VWAP Push StrategyThis strategy is unfortunately not finished yet.
A pretty simple strategy. If price broke through VWAP and had three consecutive candles following the breakthroughs trend, the high of the third candle will be drawn. If this happened after a crossover of the vwap and price breaks through the high of the third candle, strategy will go long. Short will be the same after crossing under the vwap. A long or short will be closed after crossing the vwap in the opposite direction, so the vwap is kind of a trailing stop.
Unfortunately, I could not manage to stop the script from entering multiple times into one drawn high or low. Of course, if a high was crossed the script should wait for a new formed high before entering a new long. If someone would find a solution to this, it would be great, because I think it is a nice strategy .
Should work great scalping 5min charts (when scripting, I used the SPX for reference).

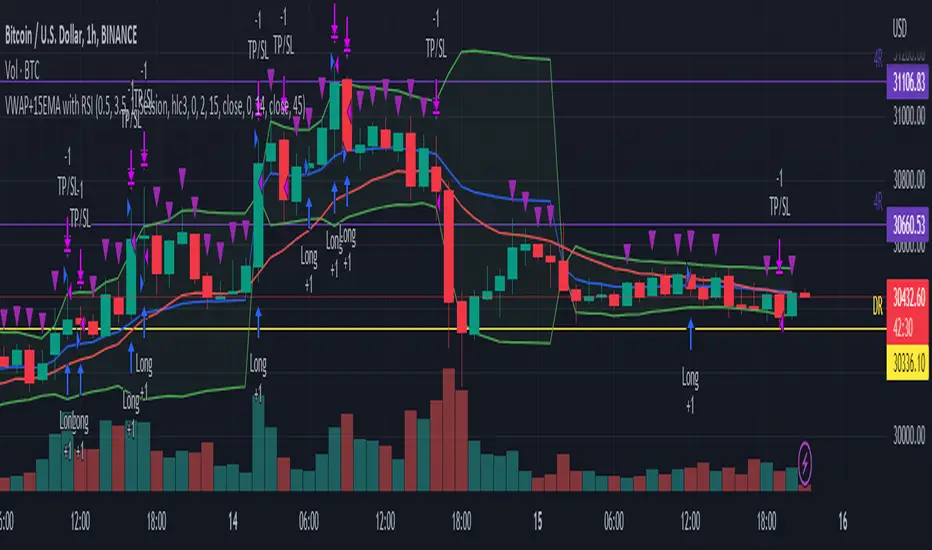
VWAP+15EMA with RSIVWAP+EMA+RSI Strategy for the group MelléCasH
This strategy will enter a long position when the closing price is above both the VWAP and the 15 EMA, and the RSI is above the specified overbought level. It will exit the position when the price falls by the specified stop loss percentage, rises by the specified take profit percentage, or when the trailing stop loss (which trails the highest price achieved after the position was entered by the specified percentage) is hit. The VWAP, EMA, and RSI indicators are also plotted on the chart for reference.
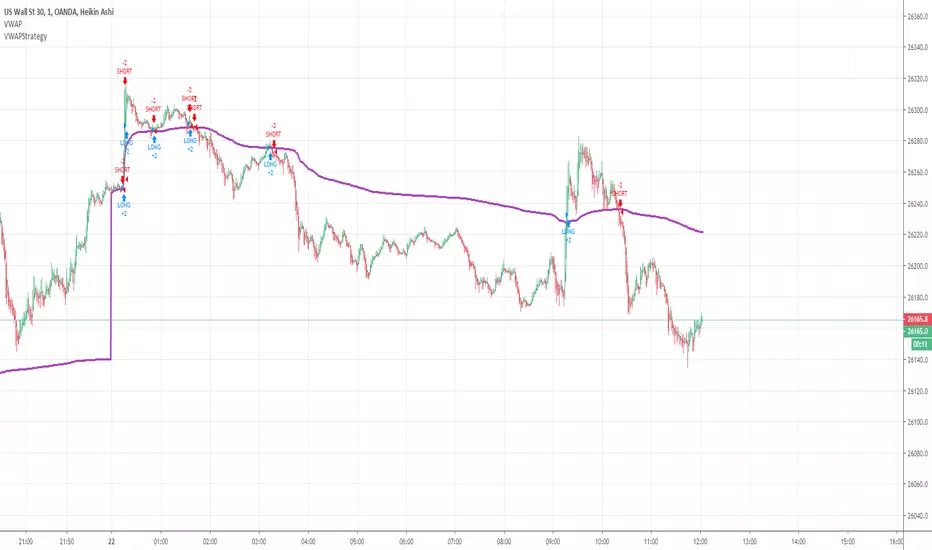
VWAPStrategyCross ema3 with VWAP. Just to give imression of how a day migth be divided in a long- and short bias zone. Not suited as trading signal.
VWAP Trendfollow Strategy [wbburgin]This is an experimental strategy that enters long when the instrument crosses over the upper standard deviation band of a VWAP and enters short when the instrument crosses below the bottom standard deviation band of the VWAP. I have added a trend filter as well, which stops entries that are opposite to the current trend of the VWAP. The trend filter will reduce total false breakouts, thus improving the % profitable while maintaining the overall returns of the strategy. Because this is a trend-following breakout strategy, the % profitable will typically be low but the average % return will be higher. As a rule, be sure to look at the average winning trade % compared to the average losing trade %, and compare that to the % profitable to judge the effectiveness of a strategy. Factor in fees and slippage as well.
This strategy appears to work better with the lower timeframes, and I was impressed with its results. It also appears to work on a wide range of asset classes. There isn't a stop loss or take profit built-in (other than the reversal signals, which close the current trade), so I would encourage you to expand on the strategy based on your own trading parameters.
You can toggle off the bar colors and the trend filter if you so desire.
Future updates to this script (or ideas of improving on it) might include a take profit level set at one standard deviation past the current level and a stop loss level set at one standard deviation closer to the vwap from the current level - or applying a multiple to the two based off of your reward/risk ratio.
About the strategy results below: this is with commissions of 0.5 % per trade.

JS-TechTrading: VWAP Momentum_Pullback StrategyGeneral Description and Unique Features of this Script
Introducing the VWAP Momentum-Pullback Strategy (long-only) that offers several unique features:
1. Our script/strategy utilizes Mark Minervini's Trend-Template as a qualifier for identifying stocks and other financial securities in confirmed uptrends.
NOTE: In this basic version of the script, the Trend-Template has to be used as a separate indicator on TradingView (Public Trend-Template indicators are available on TradingView – community scripts). It is recommended to only execute buy signals in case the stock or financial security is in a stage 2 uptrend, which means that the criteria of the trend-template are fulfilled.
2. Our strategy is based on the supply/demand balance in the market, making it timeless and effective across all timeframes. Whether you are day trading using 1- or 5-min charts or swing-trading using daily charts, this strategy can be applied and works very well.
3. We have also integrated technical indicators such as the RSI and the MA / VWAP crossover into this strategy to identify low-risk pullback entries in the context of confirmed uptrends. By doing so, the risk profile of this strategy and drawdowns are being reduced to an absolute minimum.
Minervini’s Trend-Template and the ‘Stage-Analysis’ of the Markets
This strategy is a so-called 'long-only' strategy. This means that we only take long positions, short positions are not considered.
The best market environment for such strategies are periods of stable upward trends in the so-called stage 2 - uptrend.
In stable upward trends, we increase our market exposure and risk.
In sideways markets and downward trends or bear markets, we reduce our exposure very quickly or go 100% to cash and wait for the markets to recover and improve. This allows us to avoid major losses and drawdowns.
This simple rule gives us a significant advantage over most undisciplined traders and amateurs!
'The Trend is your Friend'. This is a very old but true quote.
What's behind it???
• 98% of stocks made their biggest gains in a Phase 2 upward trend.
• If a stock is in a stable uptrend, this is evidence that larger institutions are buying the stock sustainably.
• By focusing on stocks that are in a stable uptrend, the chances of profit are significantly increased.
• In a stable uptrend, investors know exactly what to expect from further price developments. This makes it possible to locate low-risk entry points.
The goal is not to buy at the lowest price – the goal is to buy at the right price!
Each stock goes through the same maturity cycle – it starts at stage 1 and ends at stage 4
Stage 1 – Neglect Phase – Consolidation
Stage 2 – Progressive Phase – Accumulation
Stage 3 – Topping Phase – Distribution
Stage 4 – Downtrend – Capitulation
This strategy focuses on identifying stocks in confirmed stage 2 uptrends. This in itself gives us an advantage over long-term investors and less professional traders.
By focusing on stocks in a stage 2 uptrend, we avoid losses in downtrends (stage 4) or less profitable consolidation phases (stages 1 and 3). We are fully invested and put our money to work for us, and we are fully invested when stocks are in their stage 2 uptrends.
But how can we use technical chart analysis to find stocks that are in a stable stage 2 uptrend?
Mark Minervini has developed the so-called 'trend template' for this purpose. This is an essential part of our JS-TechTrading pullback strategy. For our watchlists, only those individual values that meet the tough requirements of Minervini's trend template are eligible.
The Trend Template
• 200d MA increasing over a period of at least 1 month, better 4-5 months or longer
• 150d MA above 200d MA
• 50d MA above 150d MA and 200d MA
• Course above 50d MA, 150d MA and 200d MA
• Ideally, the 50d MA is increasing over at least 1 month
• Price at least 25% above the 52w low
• Price within 25% of 52w high
• High relative strength according to IBD.
NOTE: In this basic version of the script, the Trend-Template has to be used as a separate indicator on TradingView (Public Trend-Template indicators are available in TradingView – community scripts). It is recommended to only execute buy signals in case the stock or financial security is in a stage 2 uptrend, which means that the criteria of the trend-template are fulfilled.
This strategy can be applied to all timeframes from 5 min to daily.
The VWAP Momentum-Pullback Strateg y
For the JS-TechTrading VWAP Momentum-Pullback Strategy, only stocks and other financial instruments that meet the selected criteria of Mark Minervini's trend template are recommended for algorithmic trading with this startegy.
A further prerequisite for generating a buy signals is that the individual value is in a short-term oversold state (RSI).
When the selling pressure is over and the continuation of the uptrend can be confirmed by the MA / VWAP crossover after reaching a price low, a buy signal is issued by this strategy.
Stop-loss limits and profit targets can be set variably.
Relative Strength Index (RSI)
The Relative Strength Index (RSI) is a technical indicator developed by Welles Wilder in 1978. The RSI is used to perform a market value analysis and identify the strength of a trend as well as overbought and oversold conditions. The indicator is calculated on a scale from 0 to 100 and shows how much an asset has risen or fallen relative to its own price in recent periods.
The RSI is calculated as the ratio of average profits to average losses over a certain period of time. A high value of the RSI indicates an overbought situation, while a low value indicates an oversold situation. Typically, a value > 70 is considered an overbought threshold and a value < 30 is considered an oversold threshold. A value above 70 signals that a single value may be overvalued and a decrease in price is likely , while a value below 30 signals that a single value may be undervalued and an increase in price is likely.
For example, let's say you're watching a stock XYZ. After a prolonged falling movement, the RSI value of this stock has fallen to 26. This means that the stock is oversold and that it is time for a potential recovery. Therefore, a trader might decide to buy this stock in the hope that it will rise again soon.
The MA / VWAP Crossover Trading Strategy
This strategy combines two popular technical indicators: the Moving Average (MA) and the Volume Weighted Average Price (VWAP). The MA VWAP crossover strategy is used to identify potential trend reversals and entry/exit points in the market.
The VWAP is calculated by taking the average price of an asset for a given period, weighted by the volume traded at each price level. The MA, on the other hand, is calculated by taking the average price of an asset over a specified number of periods. When the MA crosses above the VWAP, it suggests that buying pressure is increasing, and it may be a good time to enter a long position. When the MA crosses below the VWAP, it suggests that selling pressure is increasing, and it may be a good time to exit a long position or enter a short position.
Traders typically use the MA VWAP crossover strategy in conjunction with other technical indicators and fundamental analysis to make more informed trading decisions. As with any trading strategy, it is important to carefully consider the risks and potential rewards before making any trades.
This strategy is applicable to all timeframes and the relevant parameters for the underlying indicators (RSI and MA/VWAP) can be adjusted and optimized as needed.
Backtesting
Backtesting gives outstanding results on all timeframes and drawdowns can be reduced to a minimum level. In this example, the hourly chart for MCFT has been used.
Settings for backtesting are:
- Period from April 2020 until April 2021 (1 yr)
- Starting capital 100k USD
- Position size = 25% of equity
- 0.01% commission = USD 2.50.- per Trade
- Slippage = 2 ticks
Other comments
• This strategy has been designed to identify the most promising, highest probability entries and trades for each stock or other financial security.
• The RSI qualifier is highly selective and filters out the most promising swing-trading entries. As a result, you will normally only find a low number of trades for each stock or other financial security per year in case you apply this strategy for the daily charts. Shorter timeframes will result in a higher number of trades / year.
• As a result, traders need to apply this strategy for a full watchlist rather than just one financial security.

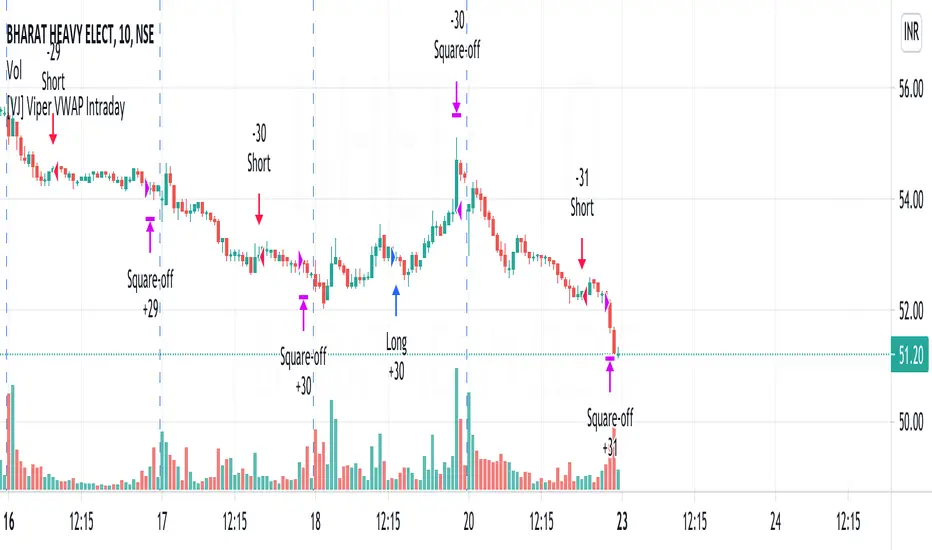
[VJ] Viper VWAP IntradayHello Traders, this is a simple intraday strategy involving the ever reliable VWAP and a chop index to add twist to the traditional style . You can modify the values on the stock and see what are your best picks. Comment below if you found something with good returns
Strategy: VWAP based strategy but uses an additional powerful indicator Chop index to help us stay out of false trades.
Indicators used :
VWAP identifies the true average price of a stock by factoring the volume of transactions at a specific price point and not based on the closing price. VWAP can add more value than your standard 10, 50, or 200 moving average indicators because VWAP reacts to price movements based on the volume during a given period.
The Choppiness Index is designed to determine whether the market is choppy or trading sideways, or not choppy and trading within a trend in either direction. Using a scale from 1 - 100, the market is considered to be choppy as values near 100 (over 61.80) and trending when values are lower than 38.20)
Buying/Selling typically happens at VWAP Breakouts which is then validated with extreme CI to ascertain the entries
Aggressive trade stop can be employed by using the % for long and shorts in the strategy.
Usage & Best setting :
Choose a good volatile stock and a time frame - 10m.
CI Index : 14
Trend Factor - anything below 38.2 is considered in trend, you can experiment from 50
There is stop loss and take profit that can be used to optimise your trade
The template also includes daily square off based on your time.
Swing VWAP Weekly Stock and Crypto StrategyThis is a simple yet very efficient swing strategy designed for crypto and stock market, using big timeframes.
Its main component is VWAP weekly, so for best scenarios its better to use big timeframes such as 8h+.
The rules for entry are simple:
If our close if above vwap weekly we enter long .
If our close is below vwap weekly we enter short.
We exit from the trade, when a reverse condition than the entry one is triggered.
Because this strategy has no risk management inside, I recommend to be careful with it.
If you have any questions, let me know

Vwap mtf Swing Stock StrategyThis is a trending strategy designed for stock market, especially long trending assets such as TSLA, NIO, AMAZON and so on.
Its made of volatility bands and weekly VWAP, in this case daily and weekly.
This strategy has been adapted to go long only.
Rules for entry
For long , we want to enter close of a candle is above vwap weekly, and at the same time the close of a candle cross-under the lower volatility band.
For exit , we want to enter close of a candle is below vwap weekly, and at the same time the close of a candle cross-over the upper volatility band.
This strategy does not have a risk management inside, so use it with caution.
If you have any questions, let me know !

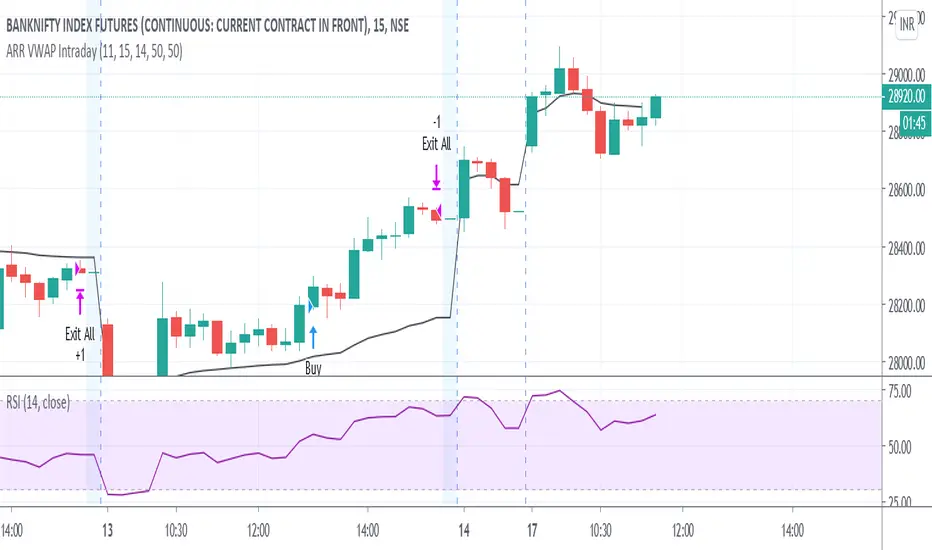
ARR VWAP IntradayIntra day VWAP Strategy
Strategy is
Buy when vwap goes up and RSI above 50 (Can be modified) .
Sell wehn vwap goes down and rsi bellow 50 (Can be modified)
Exit all at market close hour specified
VWAP and RSI strategyThis strategy combines VWAP and RSI indicators
BUY RULE
1. EMA50 > EMA 200
2. if current close > vwap session value and close>open
3. check if RSI3 is dipped below 10 for any of last 10 candles (as defined rsi_buy_level)
EXIT RULE
1. RSI3 crossing down 90 level (as defined in rsi_sell_level)
STOP LOSS EXIT
1. default is set to 5%
you need to add EMA 50 , EMA 200 and VWAP (session) indicators to the chart to see how these signals are generated
This strategy is tested on SPY and QQQ index stocks on hourly chart.
Warning
for educational purposes only
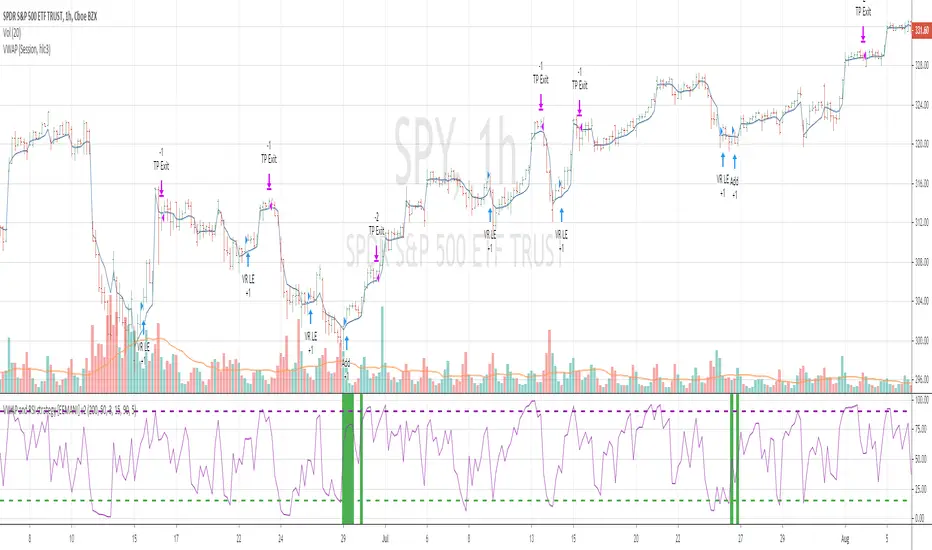
VWAP and BB strategy [EEMANI]This strategy combines VWAP and BB indicators
BUY RULE
1. EMA50 > EMA 200
2. if current close > vwap session value
3. check if price dipped BB lower band for any of last 10 candles
EXIT RULE
1. price closes above BB upper band
STOP LOSS EXIT
1. As configured --- default is set to 5%
warning: for the use of educational purposes only

VWAP_X_EMAVWAP and EMA 50 combo indicators
Long : if the close is above the VWAP and EMA
Short : Viceversa

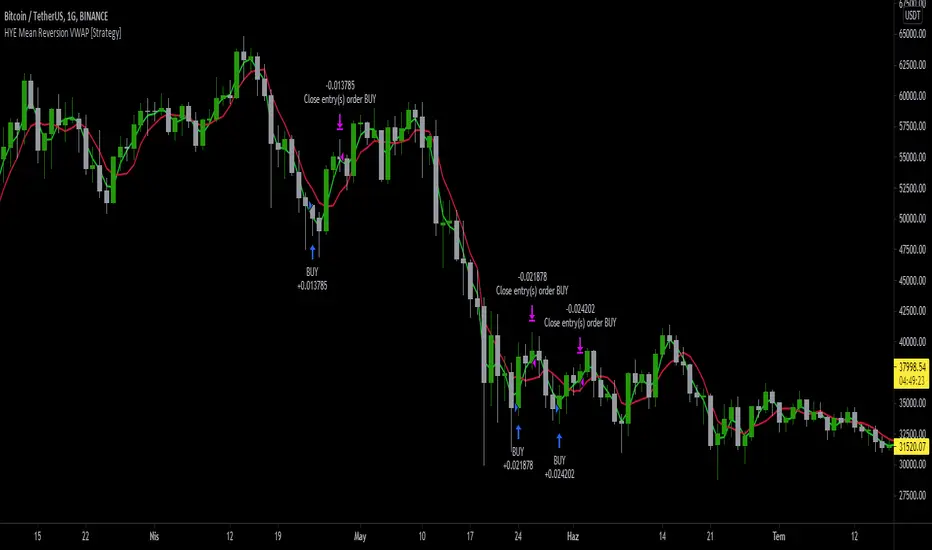
HYE Mean Reversion VWAP [Strategy]An RSI filtered version of PJ Sutherland's Jaws Mean Reversion algorithm using volume weighted average price (VWAP) instead of simple moving average (SMA).
"Long" on the close when;
1-) 2 period VWAP closes 3% or more below the 5 period VWAP ,
2-) 5 period exponential average of the 2 period RSI is below 30.
"Exit Long" on the close when;
1-) 2 period VWAP closes above the 5 period VWAP.
"Short" on the close when;
1-) 2 period VWAP closes 3% or more above the 5 period VWAP ,
2-) 5 period exponential average of the 2 period RSI is above 70.
"Exit Short" on the close when;
1-) 2 period VWAP closes below the 5 period VWAP.
*** You can change the needed percentage for long and short trades, periods of VWAPs and RSI levels.
*** You can select the trend direction: "Long Only" , "Short Only" or "Both". Default is "Long Only".
I used the "VWAP with period" indicator code of @neolao. Special thanks to @neolao.
Indicator Link:
RSI on VWAP Upgraded strategyFirst of all, the idea of apply RSI to VWAP was inspired by XaviZ; at least, that where I first saw that.
I simply applied the idea and searched for apply this on lower timeframe (M15) to increase the number of positions and improve the profit factor.
The conditions to enter are the same :
long : enter on RSI crossover oversold level
short : enter on RSI crossunder oversell level
To close position, I found a little change to apply :
long : close position when RSI(VWAP) went in overbought zone and crossunder the overbought level OR after being at least x bars in the overbought zone (parameter is 28 by default) => when the first condition happens
short : close position when RSI(VWAP) went in oversold zone and crossover the oversold level OR after being at least x bars in the oversell zone (parameter is 28 by default) => when the first condition happens
With this change, I got better results specially on BTCUSDTPERP (M15) where I reach a 6.8 profit factor with 119 trades closed. Not BAD !
The defaults parameters are the best found for BTCUSDTPERP (M15), but the strategy works fine for other pairs if you take time to find the rights combinations.
In this strategy you can change (with defaults in () ):
RSI length (28)
RSI overbought level (85)
RSI oversell level (30)
Number of bars before leaving as explain above (28)
The choice to take longs only, shorts only or both
The number of coin/token by position
The start date for backtesting
Please note that the script use a pyramiding parameter of 3 (can be changed in the first line of the script); that means that you can take up to 3 positions before closing. It lets you improve average enter price but increase the risk. 3 is the best I found to improve profit factor without expose myself too much.
This script would be better if automated because of the conditions of buy and sell.
It's only for educative purpose, not an advice to invest.
All my free scripts here : fr.tradingview.com
Leave a message and don't forget to follow me ;) !

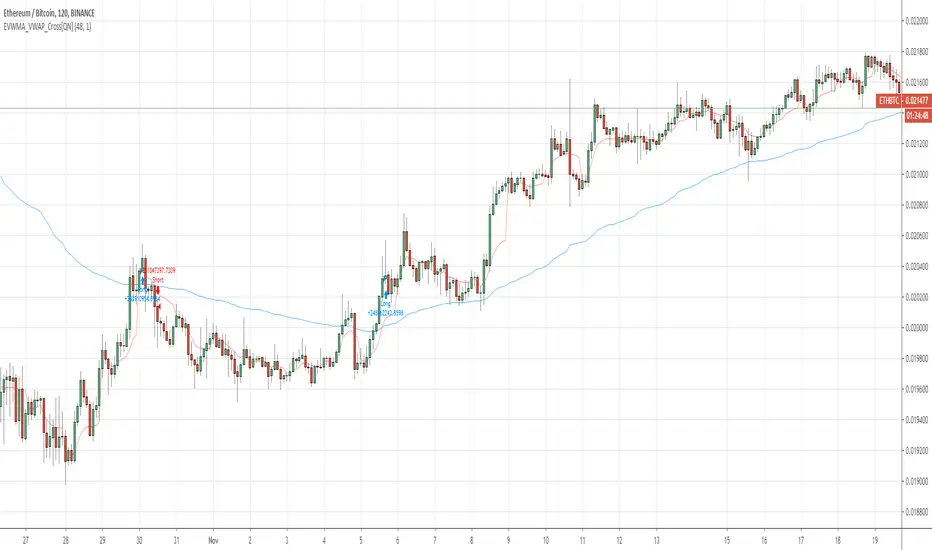
EVWMA VWAP Cross Strategy [QuantNomad]Continue to experiement with VWAP and EVWMA.
It seems that just simple crosses between VWAP and EVWMA can be pretty good signals. VWAP is a bit choppy so you can use VWAP smoothing input to smoth it a bit.
Here are few other strategies based on EVWMA:
EVWMA VWAP MACD Strategy
QuantNomad - EVWMA MACD Strategy
ARSI – (VWAP & ATR) 3QKRAKThe ARSI Long & Short – Dynamic Risk Sizing (VWAP & ATR) indicator combines three core components—an adjusted RSI oscillator (ARSI), Volume‐Weighted Average Price (VWAP), and Average True Range (ATR)—so that entry/exit signals and position sizing are always tailored to current market conditions. ARSI, plotted from 0 to 100 with clearly marked overbought and oversold zones, is the primary signal driver: when ARSI falls below the lower threshold it indicates an excessive sell‐off and flags a long opportunity, whereas a break above the upper threshold signals overextended gains and foreshadows a short. A midpoint line at 50 can serve as an early exit or reduction signal when crossed against your position.
VWAP, showing the volume‐weighted average price over the chosen period, acts as a trend filter—long trades are only taken when price sits above VWAP, and shorts only when it’s below—ensuring each trade aligns with the prevailing market momentum. ATR measures current volatility and is used both to set safe stop‐loss levels and to dynamically size each position. In practice, this means positions automatically shrink in high‐volatility environments and grow in quieter markets, all while risking a fixed percentage of your capital.
Everything appears on a single chart: the ARSI pane below the price window with its reference levels; VWAP overlaid on the price; and the ATR‐based stop‐loss distances graphically displayed. Traders thus get a comprehensive, at-a-glance view of entries, exits, trend confirmation, and exactly how large a position they can safely take. The indicator runs in real time, removing the need for manual parameter calculations and letting you focus on strategic decision-making.

Dillon's Double VWAP StrategyThis is based on Dillon's double VWAP strategy.
I enters when the ADX is low (aka not a trending market) and it's not close to the VWAP reset. Check it out.

Swing VWAP Crypto and Stocks StrategyThis is a strategy designed for swing trading on markets such as crypto and stocks.
Its components are:
VWAP
Time Management
Risk management
Rules for entry:
We entry only on Monday, if our close of the candle crossed above VWAP
Rules for exit
We exit always on Sunday or if we either hit the TP/SL levels.
If you have any questions let me know

EmperorBTC's VWAP StrategyEmperorBTC's VWAP Indicator & Strategy
v2.1
coded by Bogdan Vaida
This indicator was created after EmperorBTC's conditions.
Good timeframes for it: 30', 15', 5'
To convert from strategy to study switch the commented lines in the beginning
and at the end of the script and vice versa.
What this indicator does is to check if:
o Pivot Point was crossed
o Stoch-RSI and VWAP were crossed in current or previous candle
o Candle (or previous candle) close is in the trend direction
If all these are true then it will go long or short based on direction.

dEMA w/ VWAP filterBuy when EMA is below VWAP and starts sloping up
Sell when EMA is above VWAP and starts sloping down

EVWMA VWAP MACD Strategy [QuantNomad]Based on comment of @coondawg71 I tried to compare VWAP and EVWMA.
Both are sort of moving averages so I decided to create a MACD based on these 2 indicators.
In parameters you can set EVWMA Length and 2 smoothing lengths for "macd" and "signal".
Strategy seems to work pretty good at 2h-8h timeframes for crypto.
What do you thing about it?
