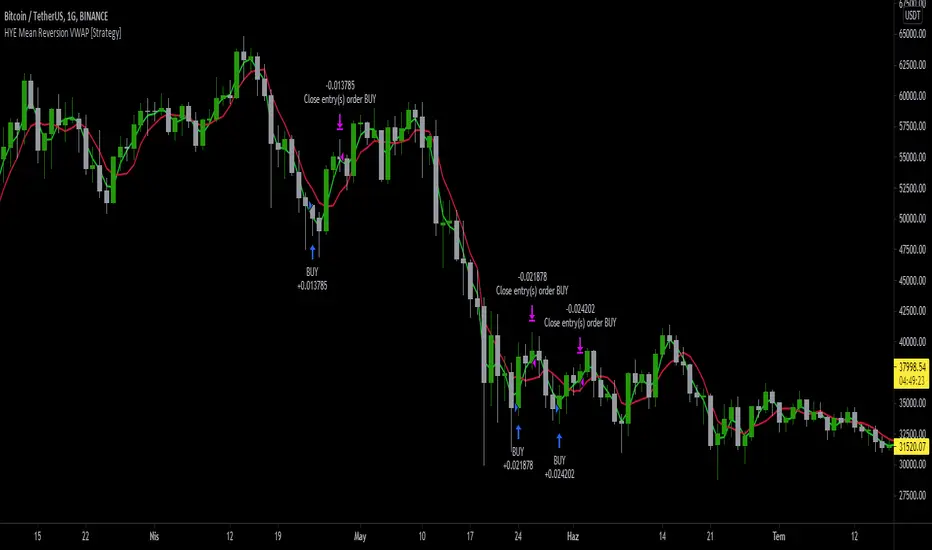
HYE Mean Reversion VWAP [Strategy]An RSI filtered version of PJ Sutherland's Jaws Mean Reversion algorithm using volume weighted average price (VWAP) instead of simple moving average (SMA).
"Long" on the close when;
1-) 2 period VWAP closes 3% or more below the 5 period VWAP ,
2-) 5 period exponential average of the 2 period RSI is below 30.
"Exit Long" on the close when;
1-) 2 period VWAP closes above the 5 period VWAP.
"Short" on the close when;
1-) 2 period VWAP closes 3% or more above the 5 period VWAP ,
2-) 5 period exponential average of the 2 period RSI is above 70.
"Exit Short" on the close when;
1-) 2 period VWAP closes below the 5 period VWAP.
*** You can change the needed percentage for long and short trades, periods of VWAPs and RSI levels.
*** You can select the trend direction: "Long Only" , "Short Only" or "Both". Default is "Long Only".
I used the "VWAP with period" indicator code of @neolao. Special thanks to @neolao.
Indicator Link:
Cari dalam skrip untuk "vwap"
VOLX+ VWAP Range BandsVOLX+ plots multiple VWAP-weighted high/low channels across different lookback periods to show how price behaves relative to short-term and long-term value zones.
Instead of using a single VWAP line, this tool creates four rolling VWAP envelopes:
Short-term range (fast reaction)
Mid-term range
Mid-mid range (transitional layer)
Long-term range (macro context)
Each band is computed as:
VWAP-High = SMA(high × volume, length) ÷ SMA(volume, length)
VWAP-Low = SMA(low × volume, length) ÷ SMA(volume, length)
This produces dynamic price channels that account for both price and traded volume, offering a clearer sense of where the market is accepting or rejecting value.
What It Shows
Four VWAP-weighted high/low bands
A short-term VWAP midline
Price line
Three SMAs for trend context
Optional visibility switches for each VWAP band
The filled regions between VWAP highs and lows create a layered “value map,” helping you interpret:
Trend continuation (price hugging outer VWAP bands)
Mean reversion (price returning toward inner bands)
Volatility contraction/expansion
Shifts in short-term vs long-term balance
🧠 How to Use
Use the short-term band for day-trading context or detecting short-term excess.
Use mid-term and mid-mid bands to confirm developing structure.
Use the long-term VWAP band to understand broader value zones.
Combine VWAP bands with SMAs and structure analysis for confluence.
This indicator is intended for price interpretation and analytical support.
✔ Does Not Repaint
The script uses rolling VWAP formulas and standard MAs; everything is stable and non-repainting.

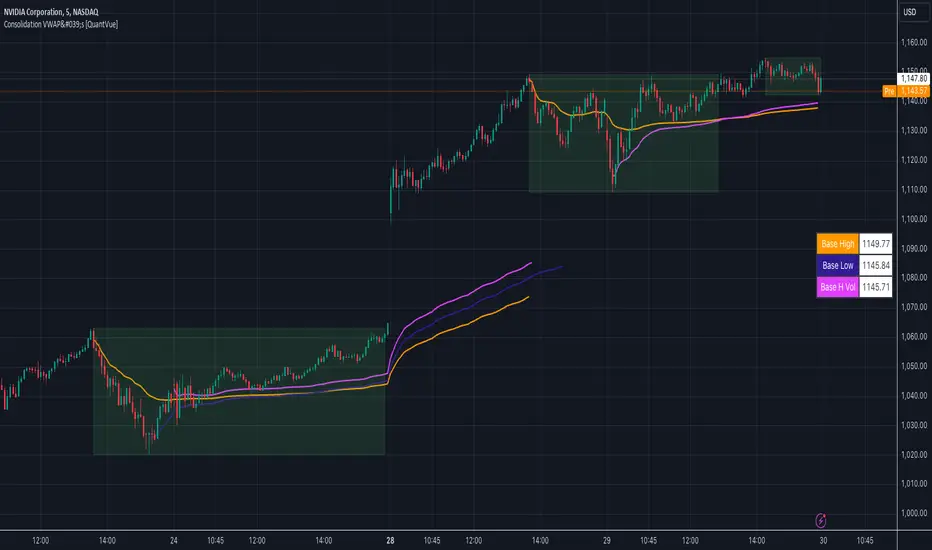
Consolidation VWAP's [QuantVue]Introducing the Consolidation VWAP's Indicator , a powerful tool designed to identify consolidation periods in stock advance and automatically anchor three distinct VWAPs to key points within the consolidation.
Consolidation Period Identification:
The indicator automatically detects periods of consolidation or areas on the chart where a stock's price moves sideways within a defined range. This period can be seen as the market taking a "breather" as it digests the previous gains. Consolidations are important because they often act as a base for the next move, either continuing the previous uptrend or reversing direction.
Consolidation requirements can be customized by the user to match your instrument and timeframe.
Maximum Consolidation Depth
Minimum Consolidation Length
Maximum Consolidation Length
Prior Uptrend Amount
Anchored VWAP, or Anchored Volume-Weighted Average Price, is a technical analysis tool used to determine the average price of a stock weighted by volume, starting from a specific point in time chosen by the analyst.
Unlike traditional VWAP, which starts at the beginning of the trading session, the anchored VWAP allows traders to select any point on the chart, such as a significant event, price low, high, or a breakout, to begin the calculation.
VWAP incorporates price and volume in a weighted average and can be used to identify areas of support and resistance on the chart.
VWAP Anchored to Consolidation High: This VWAP is anchored at the highest price point within the identified consolidation period. It helps traders understand the
average price paid by buyers who entered at the peak of the consolidation.
VWAP Anchored to Consolidation Low: This VWAP is anchored at the lowest price point within the consolidation. It provides insights into the average price paid by
buyers who entered at the lowest point of the consolidation.
VWAP Anchored to Highest Volume in the Consolidation: This VWAP is anchored at the price level with the highest trading volume during the consolidation. It reflects the average price at
which the most trading activity occurred, often indicating a key support or resistance level.
The indicator also allows the trader to see past consolidation areas and previous anchored VWAP's.
Give this indicator a BOOST and COMMENT your thoughts!
We hope you enjoy.
Cheers!
Harmonic Rolling VWAP (Zeiierman)█ Overview
The Harmonic Rolling VWAP (Zeiierman) indicator combines the concept of the Rolling Volume Weighted Average Price (VWAP) with advanced harmonic analysis using Discrete Fourier Transform (DFT). This innovative indicator aims to provide traders with a dynamic view of price action, capturing both the volume-weighted price and underlying harmonic patterns. By leveraging this combination, traders can gain deeper insights into market trends and potential reversal points.
█ How It Works
The Harmonic Rolling VWAP calculates the rolling VWAP over a specified window of bars, giving more weight to periods with higher trading volume. This VWAP is then subjected to harmonic analysis using the Discrete Fourier Transform (DFT), which decomposes the VWAP into its frequency components.
Key Components:
Rolling VWAP (RVWAP): A moving average that gives more weight to higher volume periods, calculated over a user-defined window.
True Range (TR): Measures volatility by comparing the current high and low prices, considering the previous close price.
Discrete Fourier Transform (DFT): Analyzes the harmonic patterns within the RVWAP by decomposing it into its frequency components.
Standard Deviation Bands: These bands provide a visual representation of price volatility around the RVWAP, helping traders identify potential overbought or oversold conditions.
█ How to Use
Identify Trends: The RVWAP line helps in identifying the underlying trend by smoothing out short-term price fluctuations and focusing on volume-weighted prices.
Assess Volatility: The standard deviation bands around the RVWAP give a clear view of price volatility, helping traders identify potential breakout or breakdown points.
Find Entry and Exit Points: Traders can look for entries when the price is near the lower bands in an uptrend or near the upper bands in a downtrend. Exits can be considered when the price approaches the opposite bands or shows harmonic divergence.
█ Settings
VWAP Source: Defines the price data used for VWAP calculations. The source input defines the price data used for calculations. This setting affects the VWAP calculations and the resulting bands.
Window: Sets the number of bars used for the rolling calculations. The window input sets the number of bars used for the rolling calculations. A larger window smooths the VWAP and standard deviation bands, making the indicator less sensitive to short-term price fluctuations. A smaller window makes the indicator more responsive to recent price changes.
-----------------
Disclaimer
The information contained in my Scripts/Indicators/Ideas/Algos/Systems does not constitute financial advice or a solicitation to buy or sell any securities of any type. I will not accept liability for any loss or damage, including without limitation any loss of profit, which may arise directly or indirectly from the use of or reliance on such information.
All investments involve risk, and the past performance of a security, industry, sector, market, financial product, trading strategy, backtest, or individual's trading does not guarantee future results or returns. Investors are fully responsible for any investment decisions they make. Such decisions should be based solely on an evaluation of their financial circumstances, investment objectives, risk tolerance, and liquidity needs.
My Scripts/Indicators/Ideas/Algos/Systems are only for educational purposes!

GMS: GW-VWAPAlright, as per usual with these, I end up adapting an existing indicator to what I want to accomplish. So this is based off the built in VWAP indicator. I added in the gummy worm to easily identify the trend, as well as the related bands to identify potential areas to either reverse position or to trim an existing one.
The middle part of the bands are the gummy worm version of VWAP. It is the VWAP using the high and another VWAP using the low. The black line is HL2 VWAP (technically 3 VWAPs).
The bands follow what I was mentioning above. So the outer most part of the bands are the high & low VWAP (with the same multiplier) and the inner bands are the HL2 VWAP.
Of course you can set whatever input source you want for these. The default is how I use it. If you want to get rid of the bar color just go to the indicator settings and un-select it at the bottom.
Source code is open so feel free to poke around.
Hope this helps,
Andre

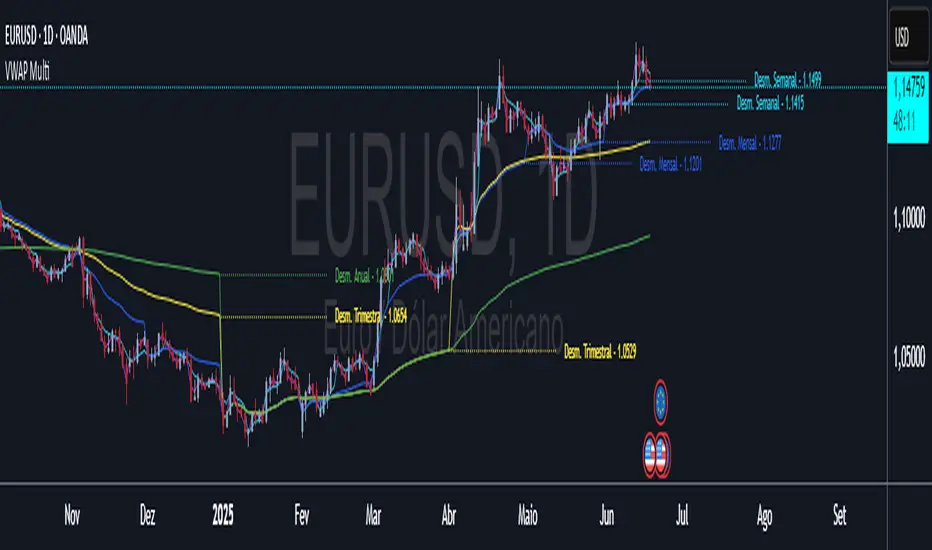
VWAP Multi-Timeframe VWAP Multi-Timeframe - Complete Professional Indicator
🚀 WHAT IS IT?
The VWAP Multi-Timeframe is an advanced indicator that combines 5 different VWAP periods in a single tool, providing a complete view of market fair value levels across multiple time scales.
⭐ KEY FEATURES
📊 5 Configurable VWAPs:
🟡 Daily VWAP - Ideal for day trading and intraday operations
🟠 Weekly VWAP - Perfect for swing trading
🔵 Monthly VWAP - Excellent for medium-term analysis
🔴 Quarterly VWAP - Essential for quarterly strategies
🟢 Yearly VWAP - Fundamental for long-term investments
🎯 Multiple Price Sources:
Choose the source that best fits your strategy:
Close - Closing price (most common)
OHLC4 - Complete average (smoother)
HLC3 - Typical price (default)
HL2 - Period midpoint
Open/High/Low - Specific prices
💡 HOW TO USE
For Day Traders:
Use Daily VWAP as main fair value reference
Prices above = buying pressure / Prices below = selling pressure
For Swing Traders:
Combine Weekly and Monthly VWAP to identify trends
Look for confluences between different timeframes
For Investors:
Quarterly and Yearly VWAP show long-term value levels
Excellent for identifying entry points in investments
🔧 TECHNICAL FEATURES
✅ Pine Script v6 - Latest and optimized version
✅ Clean Interface - User-friendly design
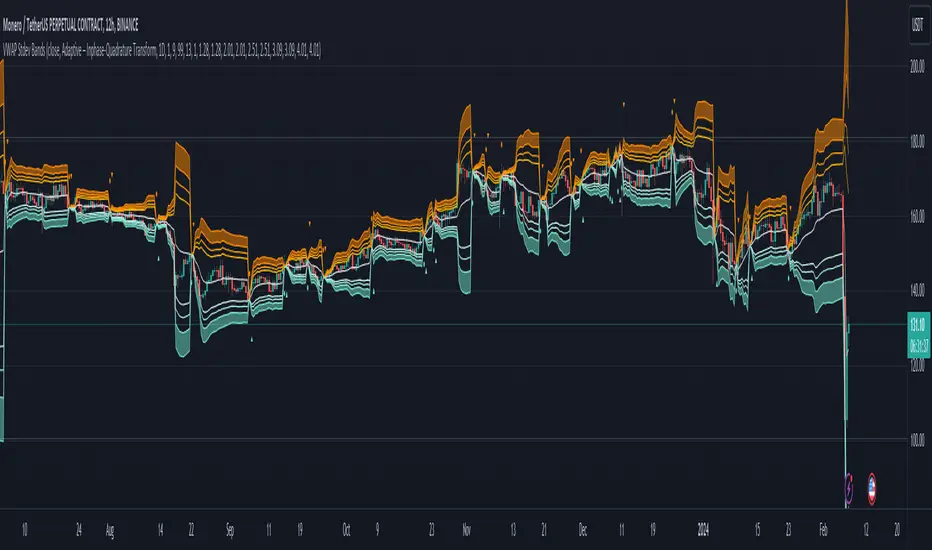
Adaptive VWAP Stdev BandsIntroduction
Heyo, here are some adaptive VWAP Standard Deviation Bands with nice colors.
I used Ehlers dominant cycle theories and ZLSMA smoothing to create this indicator.
You can choose between different algorithms to determine the dominant cycle and this will be used as reset period.
Everytime bar_index can be divided through the dominant cycle length and the result is zero VWAP resets if have chosen an adaptive mode in the settings.
The other reset event you can use is just a simple time-based event, e.g. reset every day.
Usage
I think people buy/sell when it reaches extreme zones.
Enjoy!
---
Credits to:
@SandroTurriate - VWAP Stdev Bands
@blackcat1402 - Dominant Cycle Analysis
@DasanC - Dominant Cycle Analysis
@veryfid - ZLSMA
(Sry, too lazy for linking)
I took parts of their code. Ty guys for your work! Just awesome.
Multi-Exchange VWAP Aggregator (Crypto)Description:
This advanced VWAP indicator aggregates volume data from up to 9 cryptocurrency exchanges simultaneously, providing a more accurate volume-weighted average price than single-exchange VWAP calculations.
Key Features:
Multi-Exchange Aggregation - Combines volume from Binance, Coinbase, Bybit, Bitfinex, Bitstamp, Deribit, OKEx, Phemex, and FTX
Flexible Currency Pairs - Supports both spot (USD, USDT, EUR, USDC, BUSD, DAI) and perpetual futures contracts
Standard Deviation Bands - Includes customizable 1σ, 2σ, and 3σ bands for identifying overbought/oversold levels
Multiple Reset Periods - Daily, Weekly, Monthly, or Session-based VWAP calculations
Volume Calculation Options - Choose between SUM, AVG, MEDIAN, or VARIANCE for volume aggregation
Why Use This?
Traditional VWAP indicators only use volume from a single exchange, which can be misleading in fragmented crypto markets. This indicator provides a comprehensive market-wide VWAP by aggregating volume across major exchanges, giving you a more reliable benchmark for entries, exits, and institutional price levels.
Perfect for traders who want to see where the real volume-weighted price sits across the entire crypto market, not just one exchange.

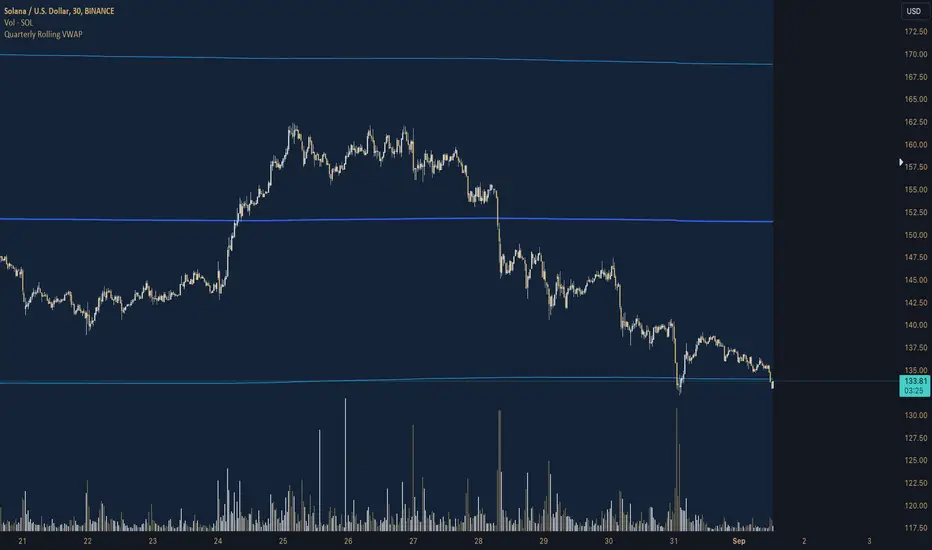
Quarterly Rolling VWAP# Quarterly Rolling VWAP Indicator
This custom indicator calculates and displays a Volume-Weighted Average Price (VWAP) that resets at the beginning of each quarter, providing traders with a medium-term perspective on price action relative to trading volume.
## Key Features:
1. **Quarterly Reset**: The VWAP calculation automatically resets at the beginning of each quarter, allowing for a rolling analysis that adapts to changing market conditions.
2. **Standard Deviation Bands**: The indicator includes two sets of bands based on standard deviations from the VWAP, helping to identify potential support and resistance levels.
3. **Customizable Appearance**: Users can adjust the colors of the VWAP line and bands, as well as control the visibility and transparency of the bands.
4. **Flexible Band Multipliers**: The distance of the bands from the VWAP can be adjusted using customizable multipliers.
## Indicator Logic:
1. **Quarterly Detection**:
- The script uses a function `isNewQuarter()` to determine the start of a new quarter.
- It calculates the timestamp for the start of the current quarter and checks for changes in this value.
2. **VWAP Calculation**:
- The `calcVWAP()` function computes the Volume-Weighted Average Price.
- It maintains running sums of price * volume and volume, which reset at the start of each quarter.
- The VWAP is calculated as the ratio of these sums.
3. **Standard Deviation Calculation**:
- The `calcStdDev()` function computes the standard deviation of price from the VWAP.
- It uses a similar approach to VWAP, maintaining running sums that reset quarterly.
4. **Band Calculation**:
- Two sets of bands are calculated using the VWAP, standard deviation, and user-defined multipliers.
- Upper and lower bands are plotted at 1x and 2x the standard deviation by default, but these are customizable.
5. **Plotting**:
- The main VWAP line is plotted with user-defined color and width.
- Bands are plotted conditionally based on user preference.
- The area between bands is filled with a semi-transparent color for better visualization.
## Trading Applications:
- **Medium-Term Trend Analysis**: The quarterly VWAP provides a broader perspective on price trends compared to daily or weekly VWAPs.
- **Support and Resistance**: The VWAP line and bands can act as dynamic support and resistance levels.
- **Mean Reversion Strategies**: Traders can look for potential reversals when price reaches the outer bands.
- **Volatility Assessment**: The width of the bands gives an indication of recent price volatility relative to volume.
- **Quarter-over-Quarter Comparison**: By resetting each quarter, the indicator allows for easy comparison of price action across different quarters.
This Quarterly Rolling VWAP indicator is particularly useful for traders focusing on medium-term strategies or those who want to incorporate a broader market context into their analysis. It combines the power of volume-weighted pricing with a quarterly perspective, offering a unique tool for technical analysis
Adaptive ML VWAP v1.0Overview
Adaptive ML VWAP is a next-generation "Smart Indicator" that moves beyond static deviations (Standard Deviation). Instead of assuming market volatility is distributed normally (Bell Curve), this indicator uses a k-Nearest Neighbors (k-NN) machine learning engine to learn the specific volatility behavior of the asset you are trading.
It answers the question: "When price extends away from VWAP, how far does it actually go before reversing?"
The Adaptive ML Engine
This script features a 5-Dimensional ML Engine that tracks every major extension or pullback event. It records:
Deviation Depth (Normalized to ATR)
Trend Slope (Is the trend steep or flat?)
ADX (Trend Strength)
VWAP Deviation (Relative Position)
Time of Day (Session Context)
When a new setup occurs, the k-NN engine instantly searches its memory for the 5 most similar historical events and calculates the probability of success based on what happened last time.
Two Strategy Modes
You can toggle the logic to suit your trading style:
1. Mean Reversion Mode (Default)
"Fade The Move"
Goal: Catch price at an exhaustion point returning to VWAP.
Signal: Triggers when price touches a Smart Band and reverses back toward the center.
k-NN Learning: Learns which conditions favor a snap-back.
Best For: Ranging markets, Lunch hours, Choppy sessions.
2. Trend Following Mode
"Ride The Move"
Goal: Catch breakouts that are launching away from value.
Signal: Triggers when price breaks out of the Inner Band (1.0).
k-NN Learning: Learns which breakouts tend to extend to the Outer Bands.
Best For: Morning Drives, News Events, Strong Trends.
Visual Guide
The indicator uses a Dynamic Gradient system to visualize risk/reward:
Cyan Mist (0.5 - 1.0): The Value Zone. Noise area. Safe for trend entries.
Deep Cyan (1.0 - 2.0): The Trend Zone. Price is moving proactively.
Orange Glow (2.0 - 3.0): The Danger Zone. Price is statistically overextended. Reversals are highly probable here.
"Fractal" Math
Unlike standard indicators that break when you change timeframes, Adaptive ML VWAP uses Fractal Normalization.
A "2.0 Band" on a 15-second chart means the same statistical extreme as a "2.0 Band" on a 4-hour chart.
Auto-Adaptive Lookback: The indicator automatically boosts the ML memory (Lookback) on lower timeframes (seconds/minutes) where more noise requires larger sample sizes, ensuring robust predictions without manual tweaking.
Settings
Auto-Adapting Lookback: (Default: True) automatically increases Lookback to 100+ for seconds charts and 50+ for minute charts.
Lookback (Events): Manual override base value (Default: 100).
Strategy Mode: Toggle between Mean Reversion and Trend Following.
k-Neighbors: The number of similar past events to structurally compare (Default: 5).
Disclaimer: This tool is for educational purposes. Machine learning performance is dependent on market conditions and historical recursion.

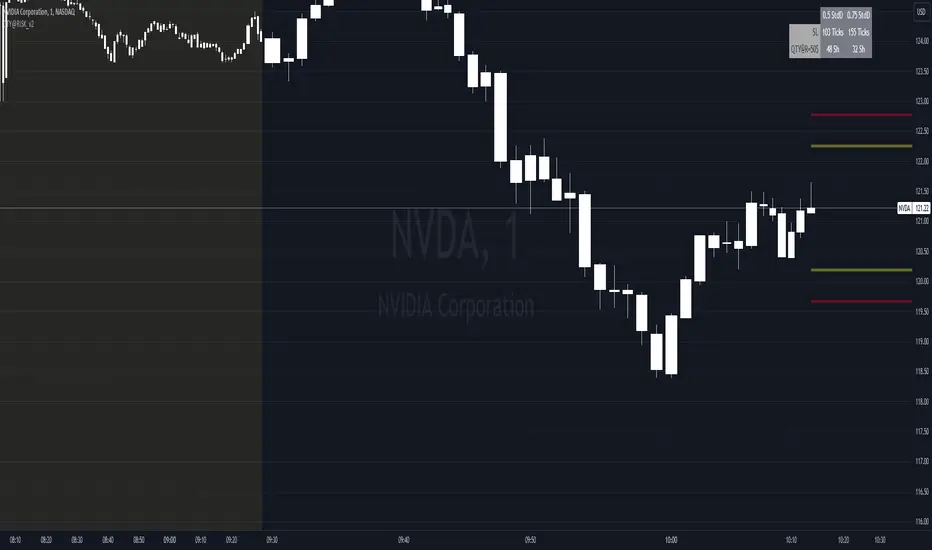
QTY@RISK VWAP based calculationVWAP Volatility-Based Risk Management Calculator for Intraday Trading
Overview
This script is an innovative tool designed to help traders manage risk effectively by calculating position sizes and stop-loss levels using the Volume Weighted Average Price (VWAP) and its standard deviation (StdDev). Unlike traditional methods that rely on time-based calculations, this approach is time-independent within the intraday timeframe, making it particularly useful for traders seeking precision and efficiency.
Key Concepts
VWAP (Volume Weighted Average Price): VWAP is a trading benchmark that represents the average price a security has traded at throughout the day, based on both volume and price. It provides insight into the average price level over a specific period, helping traders understand the market trend.
StdDev (Standard Deviation): In the context of VWAP, the standard deviation measures the volatility around the VWAP. It provides a quantifiable range that traders can use to set stop-loss levels, ensuring they are neither too tight nor too loose.
How the Script Works
1. VWAP Calculation: The script calculates the VWAP continuously as the market trades, integrating both price and volume data.
2. Volatility Measurement: It then computes the standard deviation of the VWAP, giving a measure of market volatility.
3. Stop-Loss Calculation: Using user-defined StdDev factors, the script calculates two stop-loss levels. These levels adjust dynamically based on market conditions, ensuring they remain relevant throughout the trading session.
4. Position Sizing: By incorporating your risk tolerance, the script determines the appropriate position size. This ensures that your maximum loss per trade does not exceed your predefined risk value.
How to Use the Calculator
1. Select Two VWAP StdDev Factors: Choose two standard deviation factors for calculating stop-loss levels. For example, you might choose 0.5 and 0.75 to set conservative and aggressive stop-losses respectively.
2. Set Your Trading Account Size: Enter your total trading capital. For example, $50,000.
3. Maximum Lot Size: Define the maximum number of shares you are willing to trade in a single position. For instance, 200 shares.
4. Risk Value per Trade: Input the maximum amount of money you are willing to risk on a single trade. For instance, $50.
5. Plotting Options: If you wish to visualize the stop-loss levels, enable the plot option and choose the price base for the plot, such as the closing price or the average of the high and low prices (hl2).
Example of Use
1. Initial Setup: After the market opens, wait for at least 15 minutes to ensure the VWAP has stabilized with sufficient volume data.
2. Parameter Configuration: Input your desired parameters into the calculator. For instance:
- VWAP StdDev Factors: 0.5 and 0.75
- Trading Account Size: $50,000
- Maximum Lot Size: 200 shares
- Risk Value per Trade: $50
- Plot Option: On, using "hl2" or "close" as the price base
3. Execution: Based on the inputs, the script calculates the position size and stop-loss levels. If the calculated stop-loss falls within the selected VWAP StdDev range, it will provide you with precise stop-loss prices.
4. Trading: Use the calculated position size and stop-loss levels to execute your trades confidently, knowing that your risk is managed effectively.
Advantages for Traders
- Time Independence: By relying on VWAP and its StdDev, the calculations are not dependent on specific time intervals, making them more adaptable to real-time trading conditions.
- Focus on Strategy: Novice traders can focus more on their trading strategies rather than getting bogged down with complex calculations.
- Dynamic Adjustments: The script adjusts stop-loss levels dynamically based on evolving market conditions, providing more accurate and relevant risk management.
- Flexibility: Traders can tailor the calculator to their risk preferences and trading style by adjusting the StdDev factors and risk parameters.
By incorporating these concepts and using this risk management calculator, traders can enhance their trading efficiency, improve their risk management, and ultimately make more informed trading decisions.
Aggregated VWAP by AncheAbout this indicator
Aggregated VWAP shows you a combined VWAP of different assets which you can choose inside the options panel.
This allows you to select the same asset from multiple exchanges and the indicator plots a VWAP based on all the prices of the selected tickers.
The above image shows you the VWAP of the current asset (red, thick line) and an Aggregated VWAP of BTCUSD from this exchange + 5 others (black line). This clearly shows a discrepancy between both values.
How to use
Open the options of the indicator, at the bottom you will find 5 input fields to select 5 tickers. This allows you to select your asset from different exchanges so that their value gets computed inside the value for the Aggregated VWAP.
Inside the "style" settings you can change colors, lines, etc.

Multi Market VWAP SystemMulti‑VWAP — Adaptive, Multi‑Session Anchored VWAP Suite
Multi‑VWAP is a comprehensive, multi‑session Volume‑Weighted Average Price engine designed for traders who rely on precise, session‑aware VWAP levels across equities, futures, and crypto.
Built for Pine Script v6, it handles complex market structures, custom anchor dates, and non‑standard trading sessions with robust error‑tolerant logic.
What This Indicator Does
This tool calculates and displays a full suite of anchored VWAPs, including:
Standard Period VWAPs
- Daily
- Weekly
- Monthly
- Yearly
To‑Date VWAPs
- Week‑to‑Date (WTD)
- Month‑to‑Date (MTD)
- Year‑to‑Date (YTD)
Custom Anchored VWAP
- Anchor to any user‑selected date
- Automatically recalculates from the first bar of that date
- Works across all markets, including 24/7 crypto
Multi‑Day Rolling VWAPs
Optional rolling VWAPs for:
- 2‑day
- 3‑day
- 4‑day
- 5‑day
- 10‑day
- 20‑day
- 50‑day
Each VWAP can be toggled individually for a clean, customizable chart.
Key Features
✔ Market‑Adaptive Session Handling
Automatically adjusts for:
- Regular equities sessions
- Futures extended hours
- 24/7 crypto markets
- Holidays (via MarketHolidays library)
✔ Clean, Efficient, Pine v6 Architecture
- No deprecated functions
- No array overflows
- No undefined variables
- Defensive programming for unsupported markets
- Optimized for performance on lower‑timeframe charts
✔ Visual Clarity & Control
- Independent color and visibility toggles
- Optional labels showing VWAP values
- Smart timestamp anchoring for all VWAP types
- Minimal chart clutter with maximum information density
Who This Indicator Is For
This tool is ideal for traders who rely on VWAP structure for:
- Intraday mean‑reversion
- Swing anchoring
- Multi‑session bias
- Institutional level mapping
- Crypto VWAP structure where no “session” exists
If you use VWAP as a core part of your workflow, this script gives you the flexibility and precision needed for modern multi‑market trading.
Notes
- This script does not repaint.
- All VWAPs are calculated using standard cumulative volume‑weighted methodology.
- Custom date VWAP begins at the first bar of the selected date on the chart’s timeframe.

SMA VWAP BANDS [qrsq]Description
This indicator is used to find support and resistance utilizing both SMA and VWAP. It can be used on lower and higher time frames to understand where price is likely to reject or bounce.
How it works
Rather than using the usual calculation for the VWAP, instead this script smooths the volume first with the SMA and then respectively calculates the smoothed multiplication of high, low and close price with the volume individually. These values are then divided by the smoothed volume to find individual VWAP's for each of the sources. The standard deviations of these are calculated, resulting in an upper, lower and middle band. It is essentially VWAP bands with some smoothed calculations in the middle.
How to use it
I like to use the bands for LTF scalping as well as HTF swings.
For scalping:
I tend to use either the 5m or 15m TF
I then set the indicator's TF to 1m
I will take a scalp based on the bands confluence with other PA methods, if price is being either supported or rejected.
For swings:
I tend to use a variety of TFs, including: 30m, 1H, 4H, D
I then set the indicator's TF to "Chart"
I will take a swing based on the bands confluence with other PA methods, if price is being either supported or rejected.
I also tend to use them on perpetual contracts as the volume seems to be more consistent and hence results in more accurate support and resistance.

RTH & ETH VWAPs (Unified Style)AVWAP indicator showing only the current session. Shows ETH VWAP even when RTH is turned on. Has standard deviation and fills for settings.

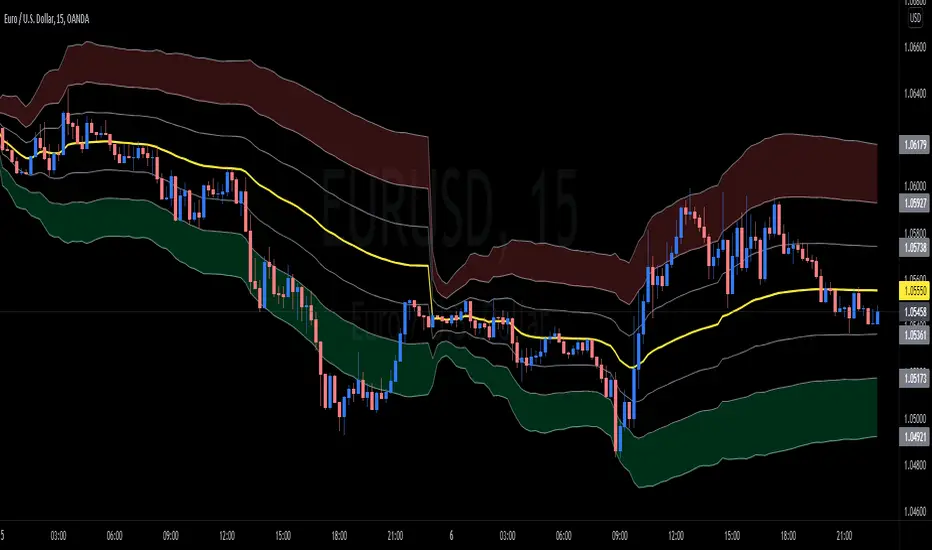
wnG - VWAP MOD Modified version of VWAP :
Classic VWAP with 6 levels based on the Average True Range to identify the distance and distribution of the prices around the VWAP.
There are 2 calcul methodologies for the bands
- Last 24 Hours Average True Range
- Progressive Average True Range starting from 00:00
As prices tend to move around the VWAP level, favor LONG positions in the GREEN ZONE (and SHORT in the RED ZONE).
How to use it :
Avoid taking long position when price is in the RED ZONE
Avoid taking short position when price is in the GREEN ZONE
==> Adjust the settings depending on your timeframe and asset
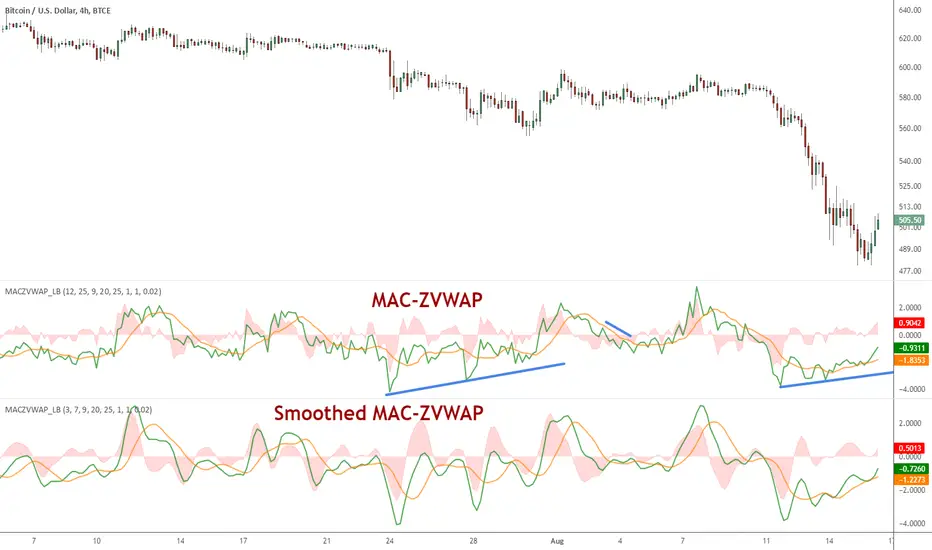
MAC-Z VWAP Indicator [LazyBear]This a modified MAC-Z using Z-VWAP. Since this uses VWAP, the signals are derived indirectly from both volume and price action.
I have also included a way to smooth MACZ-VWAP, you can enable it via options page.
Note that this will not work on any FX pair, as volume is not available.
Referenced indicators:
Z-distance from VWAP:
MAC-Z Indicator:
Z-Score:
Complete list of my indicators:
GDoc: docs.google.com
Chart:
VWAP --S/W/M/Q/Y-- (mk)VWAP — S / W / M / Q / Y (mk)
This indicator plots multi-timeframe anchored VWAPs on a single chart, allowing you to view Session, Weekly, Monthly, Quarterly, and Yearly VWAPs simultaneously, each with optional standard-deviation bands.
It is designed for traders who use VWAP as a fair value reference across multiple market horizons and want higher-timeframe context without switching charts.
🔹 What it shows
Session VWAP (daily reset)
Weekly VWAP
Monthly VWAP
Quarterly VWAP
Yearly VWAP
Each VWAP can be enabled or disabled individually.
🔹 VWAP Bands
For every VWAP, the indicator can optionally plot:
±1 standard deviation
±2 standard deviations
±3 standard deviations
These bands help identify:
Overextended price moves
Mean-reversion zones
Higher-timeframe support and resistance
🔹 Key Features
True anchored VWAP using volume-weighted calculations
Automatic resets based on timeframe changes
Clean, color-coded levels for each timeframe
Independent visibility controls for each VWAP and its bands
Works on any market and timeframe with volume data
🔹 How to use it
Use higher-timeframe VWAPs (Monthly / Quarterly / Yearly) as major bias and balance levels
Use Session and Weekly VWAPs for intraday execution and mean-reversion setups
Combine VWAP confluence across timeframes for high-probability zones
Watch price behavior around ±1 / ±2 / ±3 bands for acceptance or rejection

Dual Session VWAPSeparate VWAP with 1 standard deviation band for the regular session as well as electronic session

Chart Champions - Part 1 - nPOC - Levels - VWAPsThank you for sparing you time to read my indicator.
This indicator has been created as a suite of 3. This was to ensure that those with only the Free Trading View account could benefit (with their restriction to 3 indicators). Please ensure you install each indicator and read each indicator write up to fully understand what has tried to achieved.
Chart Champions – Part 1 –Lvls nPOC VWAPS
This indicator is broken down into:
• Levels
• VWAPS
• Naked Point of Control
Levels
It displays the levels to the right of the price Axis to enable the user to have a cleaner chart.
The below levels will automatically appear:
dOpen – pdHigh – pdLow – pdEQ – pwEQ
Optional Levels include:
mOpen – pmOpen – pdOpen – dbyOpen – wOpen – pwOpen
VWAPs
Optional VWAPs
Daily (including pdVWAP close) – Weekly – Monthly
Naked Points of Control (nPOC)
To view the nPOC move the chart back in time to pick up the nPOCs.
Chart Champions – Part 2 – CCV IBs POC
This indicator is broken down into:
• Chart Champions Value
• Initial Balance
• Points of Control
Chart Champions Value (CCV)
CCV is based on the 80% rule of the dOpen opening outside of the pdVAH/pdVAL. Please do you own research to fully understand how this trading strategy works (readily avaliable online).
Initial Balance (IB)
IB is based on the first 60 minutes of the market opening. It captures the highest and lowest points within that 60 minutes. Please do you own research to fully understand how this trading strategy works (readily avaliable online).
Points of Control (POCs)
POC are the price levels where the most volume was traded.
Developing POC (dPOC) will constantly move with volume/price action through out the day.
Optional POCs
Previous Day POC (pdPOC) – Day Before Yesterday POC (dbyPOC)
Chart Champions – Part 3 – Sessions - Manual Input
This indicator is broken down into:
• Manual Inputs (daily, weekly, monthly)
• IGOR SessionsTtimes
• Pre + Market Openings
Manual Input
Daily x3
Weekly x 3
Monthly x 3
This allows the trader to put in specific levels.
IGOR Session Times
This is a user specific requirement to highlight cetain times during the day, displayed at the bottom of the chart in the colour strip.
Pre + Market Openings
This allows the user to see when pre market trading has started and with the live maket has started, displayed at the top of the chart in colours.
A huge thank you goes out to:
Stackoverflow users AnyDozer and Bjorn.
TV user ahancock for allow me use of this code.
Disclaimer the lower the timeframe the more information it processes.

VWAP MTF 5-BandVWAP MTF Suite
Overview
The MTF Institutional VWAP Suite is a high-performance, multi-timeframe analysis tool designed for professional traders who require precise structural anchors. Built on the latest Pine Script v6 engine, this indicator allows for the simultaneous tracking of up to five independent VWAPs, each with its own volatility bands and customizable reset logic.
Unlike standard VWAP indicators that are limited to daily sessions, this suite provides institutional "magnets" across multiple horizons, allowing you to visualize where high-volume participants are positioned on a Daily, Weekly, Monthly, or Intraday basis.
Key Features
5 Independent VWAP Engines: Run up to five unique VWAPs concurrently without chart lag.
Multi-Timeframe Anchoring: Choose from hard-coded institutional pivots: Month, Week, Day, 12-Hour, 4-Hour, and 1-Hour.
Institutional Volatility Bands: Each VWAP includes an optional 1-Standard Deviation band calculated using cumulative variance logic for maximum precision.
Advanced UI Controls: Granular toggles for each instance allow you to display only the center line, only the bands, or the full shaded "value area" for any specific timeframe.
Modern Pine v6 Architecture: Utilizes the latest 2026 Pine Script optimizations, including method chaining and global-scope plot execution for a bug-free experience.
How to Use
Identify Value Clusters: When multiple VWAPs (e.g., Daily and Weekly) converge at a single price point, it creates a high-probability "Institutional Pivot" zone.
Mean Reversion: Use the 1-Standard Deviation bands to identify overextended price action. Institutional algorithms often mean-revert toward the VWAP when price reaches the exterior bands in a low-volatility environment.
Trend Confirmation: Use the slope and position of the 4-Hour or Daily VWAP to determine intraday bias. Trading above a rising VWAP confirms a "Long Gamma" or bullish trend.
Settings
Anchor Selection: Defines the starting point of the volume-weighted calculation.
Bands & Fill Toggles: Quickly clean up your chart by hiding the volatility bands or the background shading for specific timeframes.
Visual Customization: Full control over center line colors, global band colors, and label offsets to prevent text overlap on the right-hand scale.
Developer Notes
This script was optimized for the 2026 TradingView environment. It uses a custom variance-tracking function rather than the basic built-in ta.vwap to ensure that standard deviation bands remain mathematically accurate even when crossing multiple sessions or weekend gaps.

Triple ATR Adaptive MAs + VWAP Option + Clouds + Candle Trend V2Another one of my experiences ... combining things...
📘 Indicator Description – Triple ATR Adaptive Moving Averages with VWAP Influence
This indicator plots three adaptive moving averages whose behavior changes dynamically based on market volatility (ATR) and optionally VWAP deviation.
Because they adapt in real time to both volatility and VWAP pressure, their movement, slope, and reaction speed differ significantly from traditional moving averages.
🔶 1. ATR-Adaptive Moving Averages
Each of the three MAs uses a custom adaptive formula:
ATR (Average True Range) is measured over a chosen period.
Higher ATR → more volatility → the MA becomes more reactive and moves closer to price.
Lower ATR → stable market → the MA becomes smoother and slower.
This creates a volatility-aware smoothing factor, making the MA expand, contract, and respond to market conditions in ways a classic SMA, EMA, or HMA cannot.
🔷 2. Optional VWAP Influence
Each MA has an independent toggle allowing it to be influenced by VWAP.
When enabled:
The MA is gently “pulled” toward VWAP.
The strength of this attraction is determined by the VWAP Influence parameter (0–1).
This causes the moving averages to behave differently from normal MAs:
In trending markets, the ATR and price push the MA away from VWAP.
In mean-reverting or balanced conditions, VWAP pulls the MA back toward fair value.
The result is an MA that reflects both trend pressure and fair-value pressure.
🔶 3. Visual Behavior: Non-Traditional Movement
Because each MA is simultaneously influenced by volatility, trend magnitude, and VWAP deviation, their shape is often very distinct from normal moving averages.
They may:
Respond faster during high volatility
Flatten out earlier during consolidation
Curve toward VWAP when price becomes extended
Separate or compress depending on ATR strength
This is intentional and essential, since the goal is to show:
✔ Volatility expansion
✔ Trend exhaustion
✔ Overextended price relative to VWAP
✔ Dynamic trend confirmation
Rather than simply smoothing past price.
🔷 4. Three Independent Adaptive Lines
Each of the three moving averages has:
Its own ATR length
Its own sensitivity multiplier
Its own optional VWAP influence
Its own color and trail
This allows the user to combine:
a fast volatility-adaptive trend line
a mid-range adaptive baseline
a slow adaptive long-trend MA
All adapting independently to volatility and VWAP conditions.
🔶 5. Optional Candle Coloring
The indicator can color candles according to trend strength derived from the fast/slow MAs.
Stronger trends produce more vivid colors. Neutral or conflicting trends produce softer colors.
This adds a visual layer to identify:
Trend direction
Trend strength
Volatility state
Market compression
at a glance.
📌 Summary
This indicator does not behave like standard SMAs or EMAs because each line dynamically adapts to:
🔸 ATR (volatility)
🔸 VWAP (fair value)
This makes the indicator extremely responsive to market conditions while still reducing noise during stable phases.
It provides a more realistic, context-aware, and intelligent representation of price behavior compared to traditional moving averages.

|AG| VWAP ANALYSIS|AG| VWAP ANALYSIS
The volume-weighted average price (VWAP) is a trading benchmark used by traders that gives the average price security has traded throughout the day, based on both volume and price.
It is important because it provides traders with insight into both the trend and value of the security.
VWAP is calculated by adding up the $ traded for every transaction (price multiplied by the number of shares traded) and then dividing by the total shares traded.
A detailed formula and calculations could be found here:
-> fanf2.user.srcf.net
Actually, TradingView has an option for Anchored Vwap is a really good implementation for specific analysis.
The following script takes into account the #Time_Period_Change and plots the VWAP calculation.
The #Time_Period Available for this script are:
-> Day
-> Week
-> Monthly
-> Quarter
-> Year
1. The option that we have is the SOURCE:
-> HLC3 (High, Low, Close)/3 is the right way to calculate VWAP.
-> But I included other traditional options:
-> open, high, low, close, hl2, hlc3, ohlc4
2. The option of Turn ON/OFF VWAP
-> Timeframe selection:
-> All, 1. Day, 2. Week, 3. Month, 4. Quarter, 5. Year, 6. >=Weekly, 7. >=Montlhy
-> With this, we could select the time for plotting the VWAP. And some cool features such as >= that we are going to plot different Timeframes VWAP calculations.
-> Vwap Label:
-> We could select if show labels or not
3. The option of Turn ON/OFF Previous VWAP Level
-> VWAP of one selected Time Period is going to end with a final price this level most of the time is retested and gives us a good opportunity for entry into one trade.
Or could be used as Stop Loss.
-> Timeframe selection:
-> 1. Day, 2. Week, 3. Month, 4. Quarter, 5. Year, 6. >=Weekly, 7. >=Montlhy, 8. >=Daily
-> Factor
-> The factor options lead as increment the extension of the previous time period.
-> Example: D is the normal time period and with factor, we change from 1D to 2D in order to extend previous levels of VWAP.
->The Factor option is only available in 1. Day and 2. Week. With a Min Value of 1 and a Maximum Value of 50.
-> Labels:
-> We could select if show labels or not
4. The option of Turn ON/OFF Standard Deviation Bands
-> Label:
-> We could select if show labels or not
-> Timeframe selection:
-> 1. Day, 2. Week, 3. Month, 4. Quarter, 5. Year
5. The option of Turn ON/OFF Previous Standard Deviation
-> Timeframe selection:
-> None, 1. Day, 2. Week, 3. Month, 4. Quarter, 5. Year, 6. >=Weekly, 7. >=Montlhy, 8. Quarter & Year
-> STDEV LEVEL
-> Since there are different options for Standard Deviation I included 4 options
-> 1
-> 2
-> 3
-> User Selection
-> In this option we could select any NUMBER for STVDEV 0.25 of step.
-> Label:
-> We could select if show labels or not
6. The Lockback Setting
-> This Script also includes an option to only plot a certain amount of days back.
The main reason in order to have a more clear chart.
-> We could select between:
-> PLOT ALL
-> CUSTOM
-> If we select Custom Then we could select the Number of Days Back that is going to be plotted.
7. Color Theme
Here we select the color (Visual Desing)
-> Color Theme
-> Text Color
-> Here I use the recent input.color option added for TradingView making the color selection really simple
8. Time Period Highlighter
-> In this option, we could select one time period in order to plot one tiny background and identify the change in the time period.
-> Timeframe selection:
-> 1. Day, 2. Week, 3. Month, 4. Quarter, 5. Year
9. Label Offset
-> Finally, this option leads us to change the position of the labels into the X-axis by default 20.
This script has many options the combinations and the possibilities of making different analyses are bast.
Here some examples of what we could make:
DEFAULT SETTING:
PREVIOUS VWAP FOR TIME PERIOD >= WEEK
(work good as S&D levels)
PREVIOUS VWAP Week WITH A FACTOR OF 4
STANDARD DEVIATION BANDS - DAY
STANDARD DEVIATION BANDS - WEEK
STANDARD DEVIATION BANDS - MONTH
STANDARD DEVIATION BANDS - QUARTER
STANDARD DEVIATION BANDS - YEAR
PREVIOUS STANDARD DEVIATION - DAY SDTV 3
PREVIOUS STANDARD DEVIATION - WEEK SDTV 3
USING STANDARD DEVIATION BANDS - WEEK
WITH LOCKBACK -> PLOT ALL
WITH CUSTOM 30 DAYS
I think the options possibilities of analysis using #VWAP are truly awesome.
I like the relationship that one previous VWAP has with Standard Pivot Points.
Good Luck,
Anderson,
