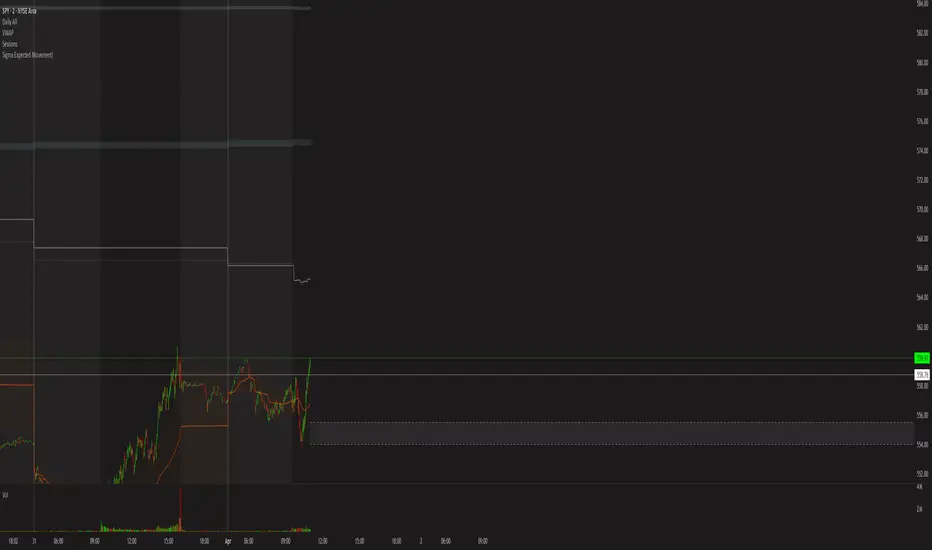
Sigma Expected Movement)Okay, here's a brief description of what the final Pine Script code achieves:
Indicator Description:
This indicator calculates and plots expected price movement ranges based on the VIX index for daily, weekly, or monthly periods. It uses user-selectable VIX data (Today's Open / Previous Close) and a center price source (Today's Open / Previous Close).
Key features include:
Up to three customizable deviation levels, based on user-defined percentages of the calculated expected move.
Configurable visibility, color, opacity (default 50%), line style, and width (default 1) for each deviation level.
Optional filled area boxes between the 1st and 2nd deviation levels (enabled by default), with customizable fill color/opacity.
An optional center price line with configurable visibility (disabled by default), color, opacity, style, and width.
All drawings appear only within a user-defined time window (e.g., specific market hours).
Does not display price labels on the lines.
Optional rounding of calculated price levels.
Cari dalam skrip untuk "国泰黄金ETF联接C相关行业指数的最新政策"
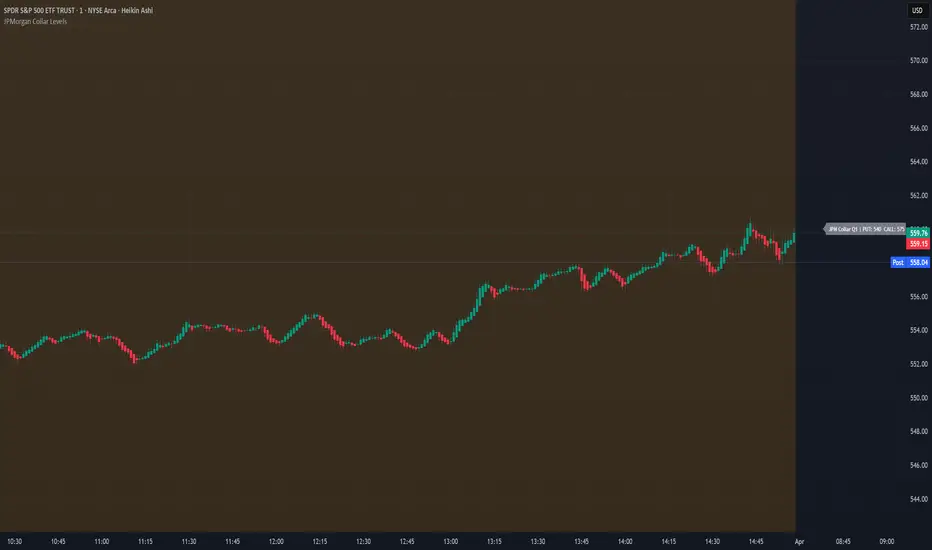
JPMorgan Collar LevelsJPMorgan Collar Levels – SPX/SPY Auto-Responsive (Quarterly Logic)
This script tracks the JPMorgan Hedged Equity Fund collar strategy, one of the most watched institutional positioning tools on SPX/SPY. The strategy rolls quarterly and often acts as a magnet or resistance/support zone for price.
Ichimoku Cloud Auto TF🧠 Timeframe Breakdown for Ichimoku Cloud Auto TF
Each timeframe in this indicator is carefully calibrated to reflect meaningful Ichimoku behavior relative to its scale. Here's how each one is structured and what it's best used for:
⏱️ 1 Minute (1m)
Tenkan / Kijun / Span B: 5 / 15 / 45
Use: Scalping fast price action.
Logic: Quick reaction to short-term momentum. Best for highly active traders or bots.
⏱️ 2 Minutes (2m)
Tenkan / Kijun / Span B: 6 / 18 / 54
Use: Slightly smoother than 1m, still ideal for scalping with a little more stability.
⏱️ 5 Minutes (5m)
Tenkan / Kijun / Span B: 8 / 24 / 72
Use: Intraday setups, quick trend capture.
Logic: Balanced between reactivity and noise reduction.
⏱️ 15 Minutes (15m)
Tenkan / Kijun / Span B: 9 / 27 / 81
Use: Short-term swing and intraday entries with higher reliability.
⏱️ 30 Minutes (30m)
Tenkan / Kijun / Span B: 10 / 30 / 90
Use: Intra-swing entries or confirmation of 5m/15m signals.
🕐 1 Hour (1H)
Tenkan / Kijun / Span B: 12 / 36 / 108
Use: Ideal for swing trading setups.
Logic: Anchored to Daily reference (1H × 24 ≈ 1D).
🕐 2 Hours (2H)
Tenkan / Kijun / Span B: 14 / 42 / 126
Use: High-precision swing setups with better context.
🕒 3 Hours (3H)
Tenkan / Kijun / Span B: 15 / 45 / 135
Use: Great compromise between short and mid-term vision.
🕓 4 Hours (4H)
Tenkan / Kijun / Span B: 18 / 52 / 156
Use: Position traders & intraday swing confirmation.
Logic: Designed to echo the structure of 1D Ichimoku but on smaller scale.
📅 1 Day (1D)
Tenkan / Kijun / Span B: 9 / 26 / 52
Use: Classic Ichimoku settings.
Logic: Standard used globally for technical analysis. Suitable for swing and position trading.
📆 1 Week (1W)
Tenkan / Kijun / Span B: 12 / 24 / 120
Use: Long-term position trading & institutional swing confirmation.
Logic: Expanded ratios for broader perspective and noise filtering.
🗓️ 1 Month (1M)
Tenkan / Kijun / Span B: 6 / 12 / 24
Use: Macro-level trend visualization and investment planning.
Logic: Condensed but stable structure to handle longer data cycles.
📌 Summary
This indicator adapts Ichimoku settings dynamically to your chart's timeframe, maintaining logical ratios between Tenkan, Kijun, and Span B. This ensures each timeframe remains responsive yet meaningful for its respective market context.
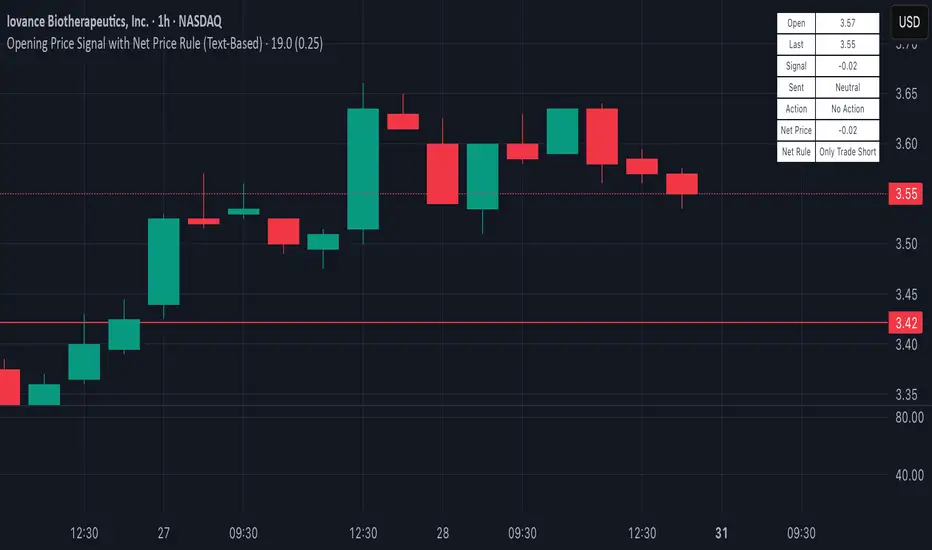
Opening Price Signal (Text-Based)Overview:
This simple yet powerful indicator quickly identifies the intraday trend direction by comparing the current price to the day’s opening price.
How it Works:
• Bullish Signal: Last price is at least +0.25 points above today’s open—suggests buying (Long).
• Bearish Signal: Last price is at least -0.25 points below today’s open—suggests selling (Short).
• Neutral: Price remains within ±0.25 points of today’s open—no trade recommended.
What’s Displayed:
• Open Price: Today’s opening price.
• Last Price: Current trading price.
• Signal: Difference between last price and today’s open.
• Sentiment: Clearly labeled as Bullish, Bearish, or Neutral.
• Action: Recommended trade direction (Long, Short, or None).
Recommended Timeframes:
• 5-Minute (ideal for precise intraday trading)
• 15-Minute (balanced clarity and noise reduction)
• 30-Minute (reduced noise, smoother signals)
Ideal Usage:
Perfect for day traders looking for a quick and clear gauge of intraday market sentiment. Use it to confirm momentum and trade confidently in the direction of the daily trend.
Happy trading! 📈✨
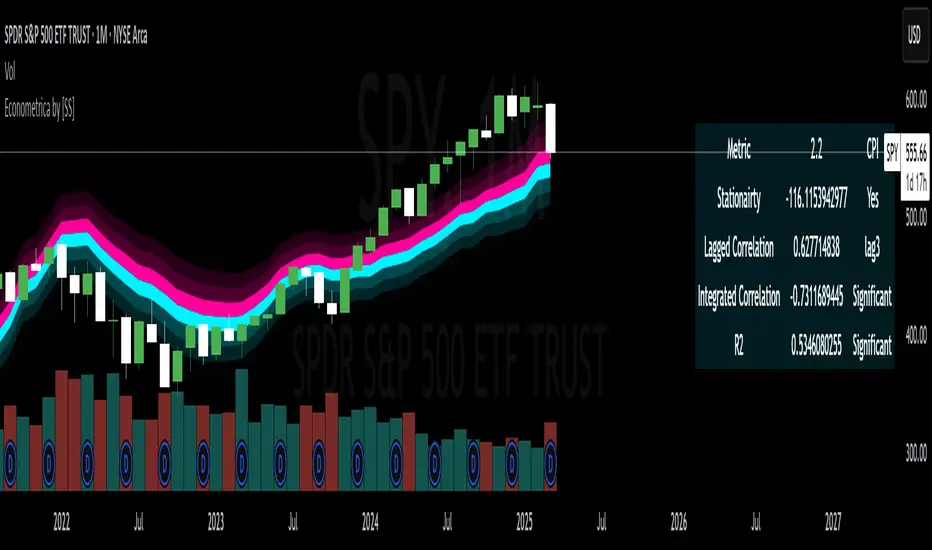
Econometrica by [SS]This is Econometrica, an indicator that aims to bridge a big gap between the resources available for analysis of fundamental data and its impact on tickers and price action.
I have noticed a general dearth of available indicators that offer insight into how fundamentals impact a ticker and provide guidance on how they these economic factors influence ticker behaviour.
Enter Econometrica. Econometrica is a math based indicator that aims to co-integrate and model indicator price action in relation to critical economic metrics.
Econometrica supports the following US based economic data:
CPI
Non-Farm Payroll
Core Inflation
US Money Supply
US Central Bank Balance Sheet
GDP
PCE
Let's go over the functions of Econometrica.
Creating a Regression Cointegrated Model
The first thing Econometrica does is creates a co-integrated regression, as you see in the main chart, predicting ticker value ranges from fundamental economic data.
You can visualize this in the main chart above, but here are some other examples:
SPY vs Core Inflation:
BA vs PCE:
QQQ vs US Balance Sheet:
The band represents the anticipated range the ticker should theoretically fall in based on the underlying economic value. The indicator will breakdown the relationship between the economic indicator and the ticker more precisely. In the images above, you can see how there are some metrics provided, including Stationairty, lagged correlation, Integrated Correlation and R2. Let's discuss these very briefly:
Stationarity: checks to ensure that the relationship between the economic indicator and ticker is stationary. Stationary data is important for making unbiased inferences and projections, so having data that is stationary is valuable.
Lagged Correlation: This is a very interesting metric. Lagged correlation means whether there is a delay in the economic indicator and the response of the ticker. Typically, you will observed a lagged correlation between an economic indicator and price of a ticker, as it can take some time for economic changes to reach the market. This lagged correlation will provide you with how long it takes for the economic indicator to catch up with the ticker in months.
Integrated Correlation: This metric tells you how good of a fit the regression bands are in relation to the ticker price. A higher correlation, means the model is better at consistent and accurate information about the anticipated range for the ticker in relation to the economic indicator.
R2: Provides information on the variance and degree of model fit. A high R2 value means that the model is capable of explaining a large amount of variance between the economic indicator and the ticker price action.
Explaining the Relationship
Owning to the fact that the indicator is a bit on the mathy side (it has to be to do this kind of task), I have included ability for the indicator to explain and make suggestions based on the underlying data. It can assess the model's fit and make suggestions for tweaking. It can also explain the implications of the data being presented in the model.
Here is an example with QQQ and the US Balance Sheet:
This helps to simplify and interpret the results you are looking at.
Forecasting the Economic Indicator
In addition to assessing the economic indicator's impact on the ticker, the indicator is also capable of forecasting out the economic indicator over the next 25 releases.
Here is an example of the CPI forecast:
Overall use of the indicator
The indicator is meant to bridge the gap between Technical Analysis and Fundamental Analysis.
Any trader who is attune to fundamentals would benefit from this, as this provides you with objective data on how and to what extent fundamental and economic data impacts tickers.
It can help affirm hypothesis and dispel myths objectively.
It also omits the need from having to perform these types of analyses outside of Tradingview (i.e. in excel, R or Python), as you can get the data in just a few licks of enabling the indicator.
Conclusion
I have tried to make this indicator as user friendly as possible. Though it uses a lot of math, it is fairly straight forward to interpret.
The band plotted can be considered the fair market value or FMV of the ticker based on the underlying economic data, provided the indicator tells you that the relationship is significant (and it will blatantly give you this information verbatim, you don't have to interpret the math stuff).
This is US economic data only. It does not pull economic data from other countries. You can absolutely see how US economic data impacts other markets like the TSX, BANKNIFTY, NIFTY, DAX etc. but the indicator is only pulling US economic data.
That is it!
I hope you enjoy it and find this helpful!
Thanks everyone and safe trades as always 🚀🚀🚀
OG Trend MeterDescription:
The OG Trend Meter gives you a visual snapshot of multiple timeframe trends in one glance. Built for speed and clarity, it helps confirm direction across key intraday timeframes: 1m, 5m, 15m, and 30m.
How it works:
Each timeframe analyzes EMA alignment, price action, and momentum.
Displays clear green/red indicators for bullish/bearish trends on each timeframe.
Great for aligning trades with higher timeframe bias.
Best for:
Traders who want multi-timeframe confirmation before pulling the trigger.
Reducing fakeouts by staying with the dominant trend.
Scalping with the 1m chart while respecting 5m–30m direction.
Pair With: OG Supertrend or EMA Stack for high-probability confluence.

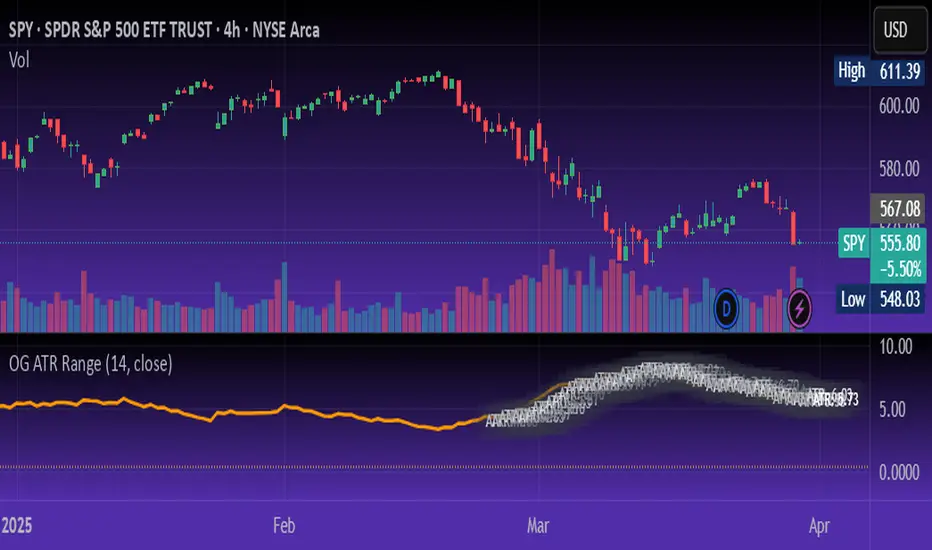
OG ATR RangeDescription:
The OG ATR Tool is a clean, visualized version of the Average True Range indicator for identifying volatility, stop-loss levels, and realistic price movement expectations.
How it works:
Calculates the average range (in points/pips) of recent candles.
Overlays ATR bands to help define breakout potential or squeeze zones.
Can be used to size trades or set dynamic stop-loss and target levels.
Best for:
Intraday traders who want to avoid unrealistic targets.
Volatility-based setups and breakout strategies.
Creating position sizing rules based on instrument volatility.
Pro Tip: Combine with your trend indicators to set sniper entries and exits that respect volatility.
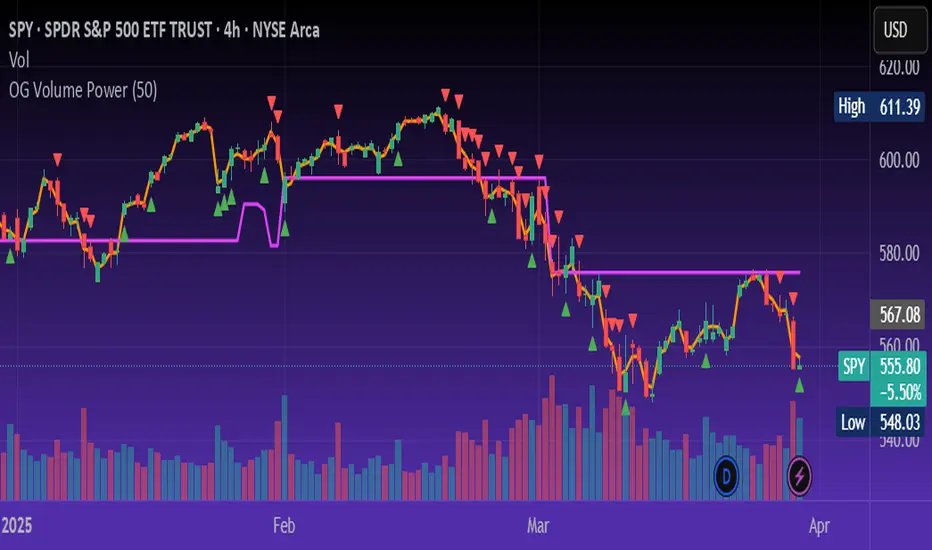
OG Volume PowerDescription:
The OG Volume Power is an elite-level volume analysis suite built for identifying momentum surges, trend continuation, and buyer/seller imbalances at critical price levels. It combines real-time VWAP tracking, a dynamic Point of Control (POC), and volume delta clusters to give traders a complete picture of price and volume interaction.
🔍 Key Features:
Real-Time VWAP:
Tracks volume-weighted average price to identify mean reversion and intraday fair value zones. Ideal for institutional-level entries and exits.
Dynamic POC (Point of Control):
Automatically finds the price level with the highest volume over the last N candles (default 50), helping traders pinpoint where market participants are most committed.
Buyer/Seller Volume Delta Clusters:
Highlights imbalances between buying and selling pressure using bullish and bearish volume deltas that exceed the 20-bar volume average — excellent for momentum detection and early trend recognition.
⚙️ How It Works:
Green triangle: Buyer surge (bullish delta + above average volume)
Red triangle: Seller surge (bearish delta + above average volume)
Magenta line: Dynamic POC (highest volume price over recent candles)
Orange line: VWAP (acts as a magnetic force for price)
📈 Best For:
Intraday scalping or swing trading on SPY, QQQ, BTC, or Forex
Volume flow confirmation before breakout entries
Filtering false breakouts with delta strength signals
🧠 Pro Tip:
Use OG Volume Power alongside your trend indicators (like OG EMA Stack or OG Supertrend) to confirm that volume is backing the move. Look for surges near VWAP or POC zones for sniper-level entries.
Reversal + Confirm ZonesThis script is written in Pine Script (version 5) for TradingView and creates an indicator called **"Reversal + Confirm Zones"**. It overlays visual zones on a price chart to identify potential reversal points and confirmation signals for trading. The indicator combines **Bollinger Bands** and **RSI** to detect overbought/oversold conditions (reversal zones) and uses **EMA crosses** and **MACD zero-line crosses** to confirm bullish or bearish trends. Below is a detailed explanation:
---
### **1. Purpose**
- The script highlights:
- **Reversal Zones**: Areas where the price might reverse due to being overbought (green) or oversold (red).
- **Confirmation Zones**: Areas where a trend reversal is confirmed using EMA and MACD signals (green for bullish, red for bearish).
- It provides visual backgrounds and alerts to assist traders in spotting potential trade setups.
---
### **2. Components**
The script is divided into two main parts: **Reversal Logic** and **Confirmation Logic**.
---
### **3. Reversal Logic (Red & Green Zones)**
#### **Bollinger Bands**
- **Parameters**:
- Length: 20 periods.
- Source: Closing price (`close`).
- Multiplier: 2.0 (standard deviations).
- **Calculation**:
- `basis`: 20-period Simple Moving Average (SMA).
- `dev`: 2 times the standard deviation of the price over 20 periods.
- `upper`: `basis + dev` (upper band).
- `lower`: `basis - dev` (lower band).
- **Purpose**: Identifies when the price moves outside the normal range (beyond 2 standard deviations).
#### **Relative Strength Index (RSI)**
- **Parameters**:
- Length: 14 periods.
- Low Threshold: 30 (oversold).
- High Threshold: 70 (overbought).
- **Calculation**: `rsiValue = ta.rsi(close, rsiLength)`.
- **Purpose**: Measures momentum to confirm overbought or oversold conditions.
#### **Zone Conditions**
- **Red Zone (Oversold)**:
- Condition: `close < lower` (price below lower Bollinger Band) AND `rsiValue < rsiLowThreshold` (RSI < 30).
- Visual: Light red background (`color.new(color.red, 80)`).
- Alert: "Deep Oversold Signal triggered!".
- **Green Zone (Overbought)**:
- Condition: `close > upper` (price above upper Bollinger Band) AND `rsiValue > rsiHighThreshold` (RSI > 70).
- Visual: Light green background (`color.new(color.green, 80)`).
- Alert: "Deep Overbought Signal triggered!".
#### **Interpretation**
- Red Zone: Suggests the price is oversold and may reverse upward.
- Green Zone: Suggests the price is overbought and may reverse downward.
---
### **4. Confirmation Logic (EMA and MACD Crosses)**
#### **Exponential Moving Averages (EMAs)**
- **Parameters**:
- Short EMA Length: 9 periods (user adjustable).
- Long EMA Length: 21 periods (user adjustable).
- **Calculation**:
- `emaShort = ta.ema(close, emaShortLength)`.
- `emaLong = ta.ema(close, emaLongLength)`.
- **Conditions**:
- **Bullish EMA Cross**: `emaCrossBullish = ta.crossover(emaShort, emaLong)` (9 EMA crosses above 21 EMA).
- **Bearish EMA Cross**: `emaCrossBearish = ta.crossunder(emaShort, emaLong)` (9 EMA crosses below 21 EMA).
#### **MACD**
- **Parameters**:
- Fast Length: 12 periods (user adjustable).
- Slow Length: 26 periods (user adjustable).
- Signal Smoothing: 9 periods (user adjustable).
- **Calculation**:
- ` = ta.macd(close, macdFastLength, macdSlowLength, macdSignalSmoothing)`.
- Only the MACD line and signal line are used; the histogram is ignored (`_`).
- **Conditions**:
- **Bullish MACD Cross**: `macdCrossBullish = ta.crossover(macdLine, 0)` (MACD crosses above zero).
- **Bearish MACD Cross**: `macdCrossBearish = ta.crossunder(macdLine, 0)` (MACD crosses below zero).
#### **Combined Confirmation Conditions**
- **Bullish Confirmation**:
- Condition: `bullishConfirmation = emaCrossBullish and macdCrossBullish`.
- Visual: Very light green background (`color.new(color.green, 90)`).
- Meaning: A bullish trend is confirmed when the 9 EMA crosses above the 21 EMA AND the MACD crosses above zero.
- **Bearish Confirmation**:
- Condition: `bearishConfirmation = emaCrossBearish and macdCrossBearish`.
- Visual: Very light red background (`color.new(color.red, 90)`).
- Meaning: A bearish trend is confirmed when the 9 EMA crosses below the 21 EMA AND the MACD crosses below zero.
---
### **5. Visual Outputs**
- **Reversal Zones**:
- Red background for oversold conditions.
- Green background for overbought conditions.
- **Confirmation Zones**:
- Light green background for bullish confirmation.
- Light red background for bearish confirmation.
- Note: The script does not plot the Bollinger Bands, EMAs, or MACD lines—only the background zones are visualized.
---
### **6. Alerts**
- **Deep Oversold Alert**: Triggers when the red zone condition is met.
- **Deep Overbought Alert**: Triggers when the green zone condition is met.
- No alerts are set for the confirmation zones (EMA/MACD crosses).
---
### **7. How It Works**
1. **Reversal Detection**:
- The script uses Bollinger Bands and RSI to flag extreme price levels (red for oversold, green for overbought).
- These zones suggest potential reversals but are not confirmed yet.
2. **Trend Confirmation**:
- EMA crosses (9/21) and MACD zero-line crosses provide confirmation of a trend direction.
- Bullish confirmation (green) occurs when both indicators align upward.
- Bearish confirmation (red) occurs when both indicators align downward.
3. **Trading Strategy**:
- Look for a red zone (oversold) followed by a bullish confirmation for a potential long entry.
- Look for a green zone (overbought) followed by a bearish confirmation for a potential short entry.
---
### **8. How to Use**
1. Add the script to TradingView.
2. Adjust inputs (EMA lengths, MACD settings) if desired.
3. Monitor the chart:
- Red zones indicate oversold conditions—watch for a potential upward reversal.
- Green zones indicate overbought conditions—watch for a potential downward reversal.
- Light green/red backgrounds confirm the trend direction after a reversal zone.
4. Set up alerts for oversold/overbought conditions to catch reversal signals early.
---
### **9. Key Features**
- **Dual Purpose**: Combines reversal detection (Bollinger Bands + RSI) with trend confirmation (EMA + MACD).
- **Visual Simplicity**: Uses background colors instead of plotting lines, keeping the chart clean.
- **Customizable**: Allows users to tweak EMA and MACD periods.
- **Alerts**: Notifies users of extreme conditions for timely action.
---
### **10. Limitations**
- No plotted indicators (e.g., Bollinger Bands, EMAs, MACD) for visual reference—relies entirely on background shading.
- Confirmation signals (EMA/MACD) may lag behind reversal zones, potentially missing fast reversals.
- No alerts for confirmation zones, limiting real-time notification of trend confirmation.
This script is ideal for traders who want a straightforward way to spot potential reversals and confirm them with trend-following indicators, all overlaid on the price chart.

Moving Average Convergence DivergenceThis script is written in Pine Script (version 6) for TradingView and implements the **Moving Average Convergence Divergence (MACD)** indicator. The MACD is a popular momentum oscillator used to identify trend direction, strength, and potential reversals. This version includes customizable inputs, visual enhancements (like crossover markers), and alerts for key events. Below is a detailed explanation of the script:
---
### **1. Purpose**
- The script calculates and displays the MACD line, signal line, and histogram.
- It highlights key events such as MACD/signal line crossovers and zero-line crosses with shapes and colors.
- It provides alerts for changes in the histogram's direction (rising to falling or vice versa).
---
### **2. User Inputs**
- **Fast Length**: Period for the fast moving average (default: 12).
- **Slow Length**: Period for the slow moving average (default: 26).
- **Source**: Data input for calculation (default: closing price, `close`).
- **Signal Smoothing**: Period for the signal line (default: 9, range: 1–50).
- **Oscillator MA Type**: Type of moving average for MACD calculation (options: SMA or EMA, default: EMA).
- **Signal Line MA Type**: Type of moving average for the signal line (options: SMA or EMA, default: EMA).
---
### **3. MACD Calculation**
The MACD is calculated in three parts:
1. **MACD Line**: Difference between the fast and slow moving averages.
- Fast MA: Either SMA or EMA of the source over `fast_length`.
- Slow MA: Either SMA or EMA of the source over `slow_length`.
- Formula: `macd = fast_ma - slow_ma`.
2. **Signal Line**: A moving average (SMA or EMA) of the MACD line over `signal_length`.
- Formula: `signal = sma_signal == "SMA" ? ta.sma(macd, signal_length) : ta.ema(macd, signal_length)`.
3. **Histogram**: Difference between the MACD line and the signal line.
- Formula: `hist = macd - signal`.
---
### **4. Key Events Detection**
#### **MACD/Signal Line Crossovers**
- **Bullish Cross**: MACD crosses above the signal line (`ta.crossover(macd, signal)`).
- **Bearish Cross**: MACD crosses below the signal line (`ta.crossunder(macd, signal)`).
#### **Zero Line Crosses**
- **Cross Above Zero**: MACD crosses above 0 (`ta.crossover(macd, 0)`).
- **Cross Below Zero**: MACD crosses below 0 (`ta.crossunder(macd, 0)`).
---
### **5. Colors**
- **MACD Line**: Green (#089981) if MACD > signal (bullish), red (#f23645) if MACD < signal (bearish).
- **Signal Line**: White (`color.white`).
- **Histogram**:
- Positive (MACD > signal): Light green (#B2DFDB) if decreasing, darker green (#26A69A) if increasing.
- Negative (MACD < signal): Light red (#FFCDD2) if increasing in magnitude, darker red (#FF5252) if decreasing in magnitude.
- **Zero Line**: Gray with 50% transparency (`color.new(#787B86, 50)`).
---
### **6. Visual Outputs**
#### **Plotted Lines**
- **MACD Line**: Plotted with dynamic coloring based on its position relative to the signal line.
- **Signal Line**: Plotted in white.
- **Histogram**: Displayed as columns, with colors indicating direction and momentum.
- **Zero Line**: Horizontal line at 0 for reference.
#### **Shapes for Key Events**
- **Bullish Cross Below Zero**: Green circle on the MACD line when MACD crosses above the signal line while still below zero.
- **Bearish Cross Above Zero**: Red circle on the MACD line when MACD crosses below the signal line while still above zero.
- **Cross Above Zero**: Green upward label at the zero line when MACD crosses above 0.
- **Cross Below Zero**: Red downward label at the zero line when MACD crosses below 0.
---
### **7. Alerts**
- **Rising to Falling**: Triggers when the histogram switches from positive (or zero) to negative.
- Condition: `hist >= 0 and hist < 0`.
- Message: "MACD histogram switched from rising to falling".
- **Falling to Rising**: Triggers when the histogram switches from negative (or zero) to positive.
- Condition: `hist <= 0 and hist > 0`.
- Message: "MACD histogram switched from falling to rising".
---
### **8. How It Works**
1. **Trend Direction**:
- MACD above signal line (green) suggests bullish momentum.
- MACD below signal line (red) suggests bearish momentum.
2. **Momentum Strength**:
- Histogram height shows the strength of the momentum (larger bars = stronger momentum).
- Histogram color changes indicate whether momentum is increasing or decreasing.
3. **Reversal Signals**:
- Crossovers between MACD and signal lines often signal potential trend changes.
- Zero-line crosses indicate shifts between bullish (above 0) and bearish (below 0) territory.
---
### **9. How to Use**
1. Add the script to TradingView.
2. Adjust inputs (e.g., fast/slow lengths, MA types) to suit your trading style.
3. Monitor the chart:
- Green MACD and upward histogram bars suggest bullish conditions.
- Red MACD and downward histogram bars suggest bearish conditions.
- Watch for circles (crossovers) and labels (zero-line crosses) for trade signals.
4. Set up alerts to notify you of histogram direction changes.
---
### **10. Key Features**
- **Customization**: Flexible MA types and periods.
- **Visual Clarity**: Dynamic colors and shapes highlight key events.
- **Alerts**: Notifies users of momentum shifts via histogram changes.
- **Intuitive**: Combines all MACD components (line, signal, histogram) in one indicator.
This script is ideal for traders who rely on MACD for momentum analysis and want clear visual cues and alerts for decision-making.

Combined EMA Technical AnalysisThis script is written in Pine Script (version 5) for TradingView and creates a comprehensive technical analysis indicator called "Combined EMA Technical Analysis." It overlays multiple technical indicators on a price chart, including Exponential Moving Averages (EMAs), VWAP, MACD, PSAR, RSI, Bollinger Bands, ADX, and external data from the S&P 500 (SPX) and VIX indices. The script also provides visual cues through colors, shapes, and a customizable table to help traders interpret market conditions.
Here’s a breakdown of the script:
---
### **1. Purpose**
- The script combines several popular technical indicators to analyze price trends, momentum, volatility, and market sentiment.
- It uses color coding (green for bullish, red for bearish, gray/white for neutral) and a table to display key information.
---
### **2. Custom Colors**
- Defines custom RGB colors for bullish (`customGreen`), bearish (`customRed`), and neutral (`neutralGray`) signals to enhance visual clarity.
---
### **3. User Inputs**
- **EMA Colors**: Users can customize the colors of five EMAs (8, 20, 9, 21, 50 periods).
- **MACD Settings**: Adjustable short length (12), long length (26), and signal length (9).
- **RSI Settings**: Adjustable length (14).
- **Bollinger Bands Settings**: Length (20), multiplier (2), and proximity threshold (0.1% of band width).
- **ADX Settings**: Adjustable length (14).
- **Table Settings**: Position (e.g., "Bottom Right") and text size (e.g., "Small").
---
### **4. Indicator Calculations**
#### **Exponential Moving Averages (EMAs)**
- Calculates five EMAs: 8, 20, 9, 21, and 50 periods based on the closing price.
- Used to identify short-term and long-term trends.
#### **Volume Weighted Average Price (VWAP)**
- Resets daily and calculates the average price weighted by volume.
- Color-coded: green if price > VWAP (bullish), red if price < VWAP (bearish), white if neutral.
#### **MACD (Moving Average Convergence Divergence)**
- Uses short (12) and long (26) EMAs to compute the MACD line, with a 9-period signal line.
- Displays "Bullish" (green) if MACD > signal, "Bearish" (red) if MACD < signal.
#### **Parabolic SAR (PSAR)**
- Calculated with acceleration factors (start: 0.02, increment: 0.02, max: 0.2).
- Indicates trend direction: green if price > PSAR (bullish), red if price < PSAR (bearish).
#### **Relative Strength Index (RSI)**
- Measures momentum over 14 periods.
- Highlighted in green if > 70 (overbought), red if < 30 (oversold), white otherwise.
#### **Bollinger Bands (BB)**
- Uses a 20-period SMA with a 2-standard-deviation multiplier.
- Color-coded based on price position:
- Green: Above upper band or close to it.
- Red: Below lower band or close to it.
- Gray: Neutral (within bands).
#### **Average Directional Index (ADX)**
- Manually calculates ADX to measure trend strength:
- Strong trend: ADX > 25.
- Very strong trend: ADX > 50.
- Direction: Bullish if +DI > -DI, bearish if -DI > +DI.
#### **EMA Crosses**
- Detects bullish (crossover) and bearish (crossunder) events for:
- EMA 9 vs. EMA 21.
- EMA 8 vs. EMA 20.
- Visualized with green (bullish) or red (bearish) circles.
#### **SPX and VIX Data**
- Fetches daily closing prices for the S&P 500 (SPX) and VIX (volatility index).
- SPX trend: Bullish if EMA 9 > EMA 21, bearish if EMA 9 < EMA 21.
- VIX levels: High (> 25, fear), Low (< 15, stability).
- VIX color: Green if SPX bullish and VIX low, red if SPX bearish and VIX high, white otherwise.
---
### **5. Visual Outputs**
#### **Plots**
- EMAs, VWAP, and PSAR are plotted on the chart with their respective colors.
- EMA crosses are marked with circles (green for bullish, red for bearish).
#### **Table**
- Displays a summary of indicators in a customizable position and size.
- Indicators shown (if enabled):
- EMA 8/20, 9/21, 50: Green dot if bullish, red if bearish.
- VWAP: Green if price > VWAP, red if price < VWAP.
- MACD: Green if bullish, red if bearish.
- MACD Zero: Green if MACD > 0, red if MACD < 0.
- PSAR: Green if price > PSAR, red if price < PSAR.
- ADX: Arrows for very strong trends (↑/↓), dots for weaker trends, colored by direction.
- Bollinger Bands: Arrows (↑/↓) or dots based on price position.
- RSI: Numeric value, colored by overbought/oversold levels.
- VIX: Numeric value, colored based on SPX trend and VIX level.
---
### **6. Alerts**
- Triggers alerts for EMA 8/20 crosses:
- Bullish: "EMA 8/20 Bullish Cross on Candle Close!"
- Bearish: "EMA 8/20 Bearish Cross on Candle Close!"
---
### **7. Key Features**
- **Flexibility**: Users can toggle indicators on/off in the table and adjust parameters.
- **Visual Clarity**: Consistent use of green (bullish), red (bearish), and neutral colors.
- **Comprehensive**: Combines trend, momentum, volatility, and market sentiment indicators.
---
### **How to Use**
1. Add the script to TradingView.
2. Customize inputs (colors, lengths, table position) as needed.
3. Interpret the chart and table:
- Green signals suggest bullish conditions.
- Red signals suggest bearish conditions.
- Neutral signals indicate indecision or consolidation.
4. Set up alerts for EMA crosses to catch trend changes.
This script is ideal for traders who want a multi-indicator dashboard to monitor price action and market conditions efficiently.

Composite Reversal IndicatorOverview
The "Composite Reversal Indicator" aggregates five technical signals to produce a composite score that ranges from -5 (strongly bearish) to +5 (strongly bullish). These signals come from:
Relative Strength Index (RSI)
Moving Average Convergence Divergence (MACD)
Accumulation/Distribution (A/D)
Volume relative to its moving average
Price proximity to support and resistance levels
Each signal contributes a value of +1 (bullish), -1 (bearish), or 0 (neutral) to the total score. The raw score is plotted as a histogram, and a smoothed version is plotted as a colored line to highlight trends.
Step-by-Step Explanation
1. Customizable Inputs
The indicator starts with user-defined inputs that allow traders to tweak its settings. These inputs include:
RSI: Length (e.g., 14), oversold level (e.g., 30), and overbought level (e.g., 70).
MACD: Fast length (e.g., 12), slow length (e.g., 26), and signal length (e.g., 9).
Volume: Moving average length (e.g., 20) and multipliers for high (e.g., 1.5) and low (e.g., 0.5) volume thresholds.
Price Levels: Period for support and resistance (e.g., 50) and proximity percentage (e.g., 2%).
Score Smoothing: Length for smoothing the score (e.g., 5).
These inputs make the indicator adaptable to different trading styles, assets, or timeframes.
2. Indicator Calculations
The script calculates five key indicators using the input parameters:
RSI: Measures momentum and identifies overbought or oversold conditions.
Formula: rsi = ta.rsi(close, rsi_length)
Example: With a length of 14, it analyzes the past 14 bars of closing prices.
MACD: Tracks trend and momentum using two exponential moving averages (EMAs).
Formula: = ta.macd(close, macd_fast, macd_slow, macd_signal)
Components: MACD line (fast EMA - slow EMA), signal line (EMA of MACD line).
Accumulation/Distribution (A/D): A volume-based indicator showing buying or selling pressure.
Formula: ad = ta.accdist
Reflects cumulative flow based on price and volume.
Volume Moving Average: A simple moving average (SMA) of trading volume.
Formula: vol_ma = ta.sma(volume, vol_ma_length)
Example: A 20-bar SMA smooths volume data.
Support and Resistance Levels: Key price levels based on historical lows and highs.
Formulas:
support = ta.lowest(low, price_level_period)
resistance = ta.highest(high, price_level_period)
Example: Over 50 bars, it finds the lowest low and highest high.
These calculations provide the raw data for generating signals.
3. Signal Generation
Each indicator produces a signal based on specific conditions:
RSI Signal:
+1: RSI < oversold level (e.g., < 30) → potential bullish reversal.
-1: RSI > overbought level (e.g., > 70) → potential bearish reversal.
0: Otherwise.
Logic: Extreme RSI values suggest price may reverse.
MACD Signal:
+1: MACD line > signal line → bullish momentum.
-1: MACD line < signal line → bearish momentum.
0: Equal.
Logic: Crossovers indicate trend shifts.
A/D Signal:
+1: Current A/D > previous A/D → accumulation (bullish).
-1: Current A/D < previous A/D → distribution (bearish).
0: Unchanged.
Logic: Rising A/D shows buying pressure.
Volume Signal:
+1: Volume > high threshold (e.g., 1.5 × volume MA) → strong activity (bullish).
-1: Volume < low threshold (e.g., 0.5 × volume MA) → weak activity (bearish).
0: Otherwise.
Logic: Volume spikes often confirm reversals.
Price Signal:
+1: Close near support (within proximity %, e.g., 2%) → potential bounce.
-1: Close near resistance (within proximity %) → potential rejection.
0: Otherwise.
Logic: Price near key levels signals reversal zones.
4. Composite Score
The raw composite score is the sum of the five signals:
Formula: score = rsi_signal + macd_signal + ad_signal + vol_signal + price_signal
Range: -5 (all signals bearish) to +5 (all signals bullish).
Purpose: Combines multiple perspectives into one number.
5. Smoothed Score
A smoothed version of the score reduces noise:
Formula: score_ma = ta.sma(score, score_ma_length)
Example: With a length of 5, it averages the score over 5 bars.
Purpose: Highlights the trend rather than short-term fluctuations.
6. Visualization
The indicator plots two elements:
Raw Score: A gray histogram showing the composite score per bar.
Style: plot.style_histogram
Color: Gray.
Smoothed Score: A line that changes color:
Green: Score > 0 (bullish).
Red: Score < 0 (bearish).
Gray: Score = 0 (neutral).
Style: plot.style_line, thicker line (e.g., linewidth=2).
These visuals make it easy to spot potential reversals.
How It Works Together
The indicator combines signals from:
RSI: Momentum extremes.
MACD: Trend shifts.
A/D: Buying/selling pressure.
Volume: Confirmation of moves.
Price Levels: Key reversal zones.
By summing these into a composite score, it filters out noise and provides a unified signal. A high positive score (e.g., +3 to +5) suggests a bullish reversal, while a low negative score (e.g., -3 to -5) suggests a bearish reversal. The smoothed score helps traders focus on the trend.
Practical Use
Bullish Reversal: Smoothed score is green and rising → look for buying opportunities.
Bearish Reversal: Smoothed score is red and falling → consider selling or shorting.
Neutral: Score near 0 → wait for clearer signals.
Traders can adjust inputs to suit their strategy, making it versatile for stocks, forex, or crypto.

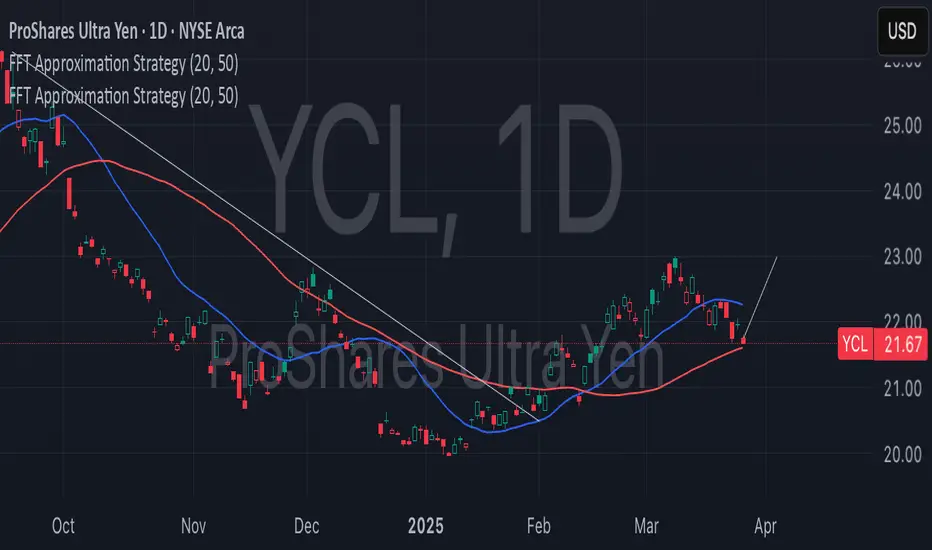
FFT Approximation StrategyExperimenting FFT Strategy on YCL (USD/JPY 2 x)
This script approximates the effects of FFT by identifying convergence between short- and long-term cycles. While it doesn't provide the precision of true spectral analysis, it captures the essence of cyclical market behavior.
How FFT Concepts Improve YCL Entry Points
Cycle Identification:
Use external FFT analysis to identify dominant cycles in USD/JPY price movements.
Apply these cycles to refine entry zones for YCL.
Noise Filtering:
High-frequency components identified by FFT can help filter out market noise.
Focus on low-frequency trends for more reliable signals.
Timing Optimization:
Combine cycle analysis with gamma exposure proxies to pinpoint moments of accelerated price movement.
alphaJohnny Dynamic RSI IndicatorAlphaJohnny Dynamic RSI Indicator (Dyn RSI)
The Dynamic RSI Indicator (Dyn RSI) is a custom Pine Script tool designed for TradingView that aggregates Relative Strength Index (RSI) signals from multiple timeframes to provide a comprehensive view of market momentum. It combines RSI data from Weekly, Daily, 4-hour, 1-hour, and 30-minute intervals, offering traders a flexible and customizable way to analyze trends across different periods.
Key Features:
Multi-Timeframe RSI Aggregation: Combines RSI signals from user-selected timeframes for a holistic momentum assessment.
Dynamic or Equal Weighting: Choose between correlation-based dynamic weights (adjusting based on each timeframe’s correlation with price changes) or equal weights for simplicity.
Smoothed Momentum Line: A visually intuitive line that reflects the strength of the aggregate signal, smoothed for clarity.
Color-Coded Signal Strength:
Dark Green: Strong buy signal
Light Green: Weak buy signal
Yellow: Neutral
Light Red: Weak sell signal
Dark Red: Strong sell signal
Visual Markers: Large green triangles at the bottom for strong buy signals and red triangles at the top for strong sell signals.
How to Use:
Apply to Chart: Add the indicator to your TradingView chart (it will appear in a separate pane).
Customize Settings: Adjust inputs like RSI period, signal thresholds, included timeframes, weighting method, and smoothing period to fit your trading style.
Interpret Signals:
Momentum Line: Watch for color changes to gauge market conditions.
Triangles: Green at the bottom for strong buy opportunities, red at the top for strong sell opportunities.
Notes:
The indicator is designed for a separate pane (overlay=false), with triangles positioned relative to the pane’s range.
Fine-tune thresholds and weights based on your strategy and the asset being analyzed.
The source code is open for modification to suit your needs.
This indicator is ideal for traders seeking a multi-timeframe perspective on RSI to identify potential trend reversals and momentum shifts.

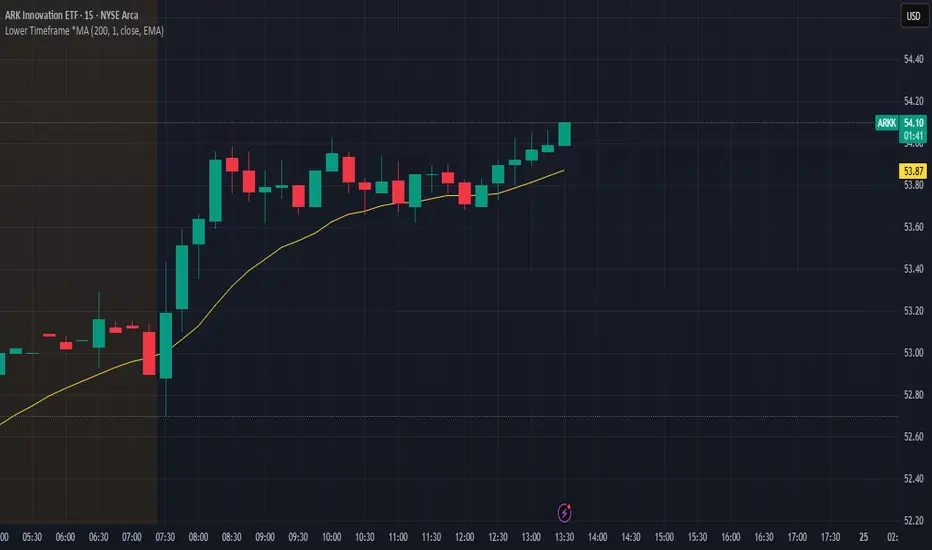
Lower Timeframe *MALower Timeframe Moving Average (MA) Indicator
This indicator calculates a moving average using data from a lower timeframe than the chart's current timeframe.
It provides potentially earlier signals and smoother price action by incorporating more granular price data. It also allows you to keep the same reference frame for your moving average regardless of your currently selected period.
Key Features:
- Uses lower timeframe data to calculate moving averages on higher timeframes
- Supports multiple MA types: SMA, EMA, WMA, VWMA, RMA, and HMA
- Allows selection of various price inputs (close, open, high, low, hl2, hlc3, ohlc4)
- Automatically adjusts MA length based on the ratio between chart timeframe and selected sub-timeframe
15m
5m
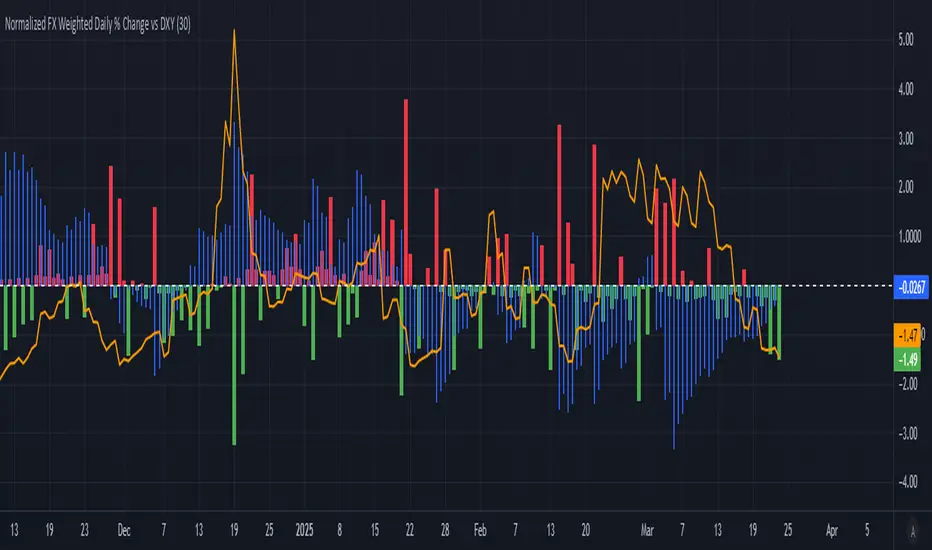
Normalized FX Weighted Daily % Change vs DXYThis indicator tracks international liquidity flows by measuring the USD’s relative strength against major currencies—EUR, CNY, JPY, GBP, and CAD. It calculates the weighted percentage change of each pair over a specified interval. A positive reading means the USD is weakening (liquidity flowing out of the US), while a negative reading indicates the USD is strengthening (liquidity flowing in). Additionally, the indicator incorporates the DXY index and VIX, with all components normalized using Z-scores for clear, comparable insights into market dynamics.
ThinkTech AI SignalsThink Tech AI Strategy
The Think Tech AI Strategy provides a structured approach to trading by integrating liquidity-based entries, ATR volatility thresholds, and dynamic risk management. This strategy generates buy and sell signals while automatically calculating take profit and stop loss levels, boasting a 64% win rate based on historical data.
Usage
The strategy can be used to identify key breakout and retest opportunities. Liquidity-based zones act as potential accumulation and distribution areas and may serve as future support or resistance levels. Buy and sell zones are identified using liquidity zones and ATR-based filters. Risk management is built-in, automatically calculating take profit and stop loss levels using ATR multipliers. Volume and trend filtering options help confirm directional bias using a 50 EMA and RSI filter. The strategy also allows for session-based trading, limiting trades to key market hours for higher probability setups.
Settings
The risk/reward ratio can be adjusted to define the desired stop loss and take profit calculations. The ATR length and threshold determine ATR-based breakout conditions for dynamic entries. Liquidity period settings allow for customized analysis of price structure for support and resistance zones. Additional trend and RSI filters can be enabled to refine trade signals based on moving averages and momentum conditions. A session filter is included to restrict trade signals to specific market hours.
Style
The strategy includes options to display liquidity lines, showing key support and resistance areas. The first 15-minute candle breakout zones can also be visualized to highlight critical market structure points. A win/loss statistics table is included to track trade performance directly on the chart.
This strategy is intended for descriptive analysis and should be used alongside other confluence factors. Optimize your trading process with Think Tech AI today!

Deviation ChannelsIndicator Name: Deviation Channels (Dev Chan)
Why Use This Indicator?
Visualize Volatility Ranges:
The indicator plots Keltner Channels at four levels above and below an average line, letting you easily see how far price has deviated from a typical range. Each “dev” line highlights potential support or resistance during pullbacks or surges.
Color-Coded Clarity:
Each band shifts color intensity depending on whether the current price is trading above or below it, letting you spot breakouts and rejections at a glance. Meanwhile, the Fast SMA (default 10) also changes color – green if price is above, red if below – adding a quick momentum read.
Adjustable Source & Length:
Choose your input source (open, close, ohlc4, or hlc3) and set your Keltner length to suit different asset classes or timeframes. Whether you want a tighter, more reactive channel or a smoother, longer-term reading, the script adapts with minimal effort.
A Simple Trading Approach
Identify Trend with Fast SMA:
If the Fast SMA (default length 10) is green (price above it), treat that as a bullish environment. If it’s red (price below), favor bearish or neutral stances.
Wait for Price to Reach Lower/Upper Deviations:
In a bullish setup (Fast SMA green), watch for price to dip into one of the lower channels (e.g., -1 Dev or -2 Dev). Such pullbacks can become potential “buy the dip” zones if price stabilizes and resumes upward momentum.
Conversely, if the Fast SMA is red, watch for price to test the upper channels (1 Dev or 2 Dev). That might be a short opportunity or a place to close out any remaining longs before a deeper correction.
Manage Risk with Channel Levels:
Place stop-losses just beyond the next “dev” band to protect against volatility. For example, if you enter on a bounce at -1 Dev, consider placing a stop near -2 Dev or -3 Dev, depending on your risk tolerance.
Take Profits Gradually:
In an uptrend, you might scale out of positions as price moves toward higher lines (e.g., 1 Dev or 2 Dev). Conversely, if price fails to hold above the Fast SMA or repeatedly closes below a key band, it might be time to exit.
Disclaimer: No single indicator is foolproof. Always combine with sound risk management, observe multiple timeframes, and consider fundamental factors before making trading decisions. Experiment with the Keltner length and Fast SMA fastLength to find the sweet spot for your market and time horizon.
MACD with TrendIndicator Name: MACD with Trend & Multi-Timeframe Dashboard
Why Use This Indicator?
Two MACDs for Double Confirmation:
It integrates both a standard MACD (fast/slow lengths of your choice) and a Trend MACD (longer lengths). The standard MACD identifies short-term momentum shifts, while the Trend MACD helps confirm the higher-level market trend.
Multi-Timeframe 50/200 SMA Overview:
A built-in dashboard quickly shows whether the 50-period moving average is above or below the 200-period moving average across multiple timeframes (Monthly, Weekly, Daily, etc.). At a glance, you can see if higher timeframes agree with your immediate trading setup.
Clear Buy/Sell Signals:
The script plots buy arrows when the MACD histogram crosses from negative to positive, plus an additional label for the Trend MACD crossing. The same goes for sell signals if momentum flips from positive to negative. This clarity can reduce guesswork.
Customizable & Intuitive:
Easily adjust moving average types (SMA or EMA), lengths, and source inputs to suit different asset classes or personal preferences. Visual color coding helps you quickly interpret bullish vs. bearish conditions.
Recommended Trading Approach
Identify Overall Trend
Check the Trend MACD histogram and the multi-timeframe dashboard (50/200 SMAs). If you see bullish alignment on higher timeframes (e.g., Daily, Weekly) and the Trend MACD is above zero, you know the market environment is supportive for long trades.
Pinpoint Entry Using Standard MACD
Wait for the standard MACD histogram to cross above zero or for a labeled “Buy Signal.” This indicates short-term momentum turning bullish in sync with the broader trend. If the market is already trending up (confirmed by the dashboard), the probability of a successful long entry often improves.
Set a Stop-Loss & Take-Profit
While not included in the code, adding an ATR- or price-based stop-loss can protect against sudden reversals. A simple approach is risking 1–2% per trade and aiming for a 1.5–2× reward relative to that risk.
Monitor Sell Signals
If the short-term MACD crosses below zero—triggering a “Sell Signal”—and the Trend MACD also turns down (or the dashboard flips bearish), consider exiting the position or tightening stops. This alignment of short- and long-term indicators often signals a shift in momentum that could threaten your open profits.
Summary
The MACD with Trend & Multi-Timeframe Dashboard is a versatile, all-in-one toolkit. It combines the immediacy of short-term MACD signals, the validation of a longer-term trend oscillator, and the broader insight of multi-timeframe moving averages. Whether you are a swing trader looking for alignment across bigger trends or a shorter-term trader wanting clear momentum triggers, this indicator helps streamline decision-making and reduce noise.
Disclaimer: As with all technical analysis tools, there is no guarantee of success. Always combine indicator signals with sound risk management and a thorough understanding of market conditions

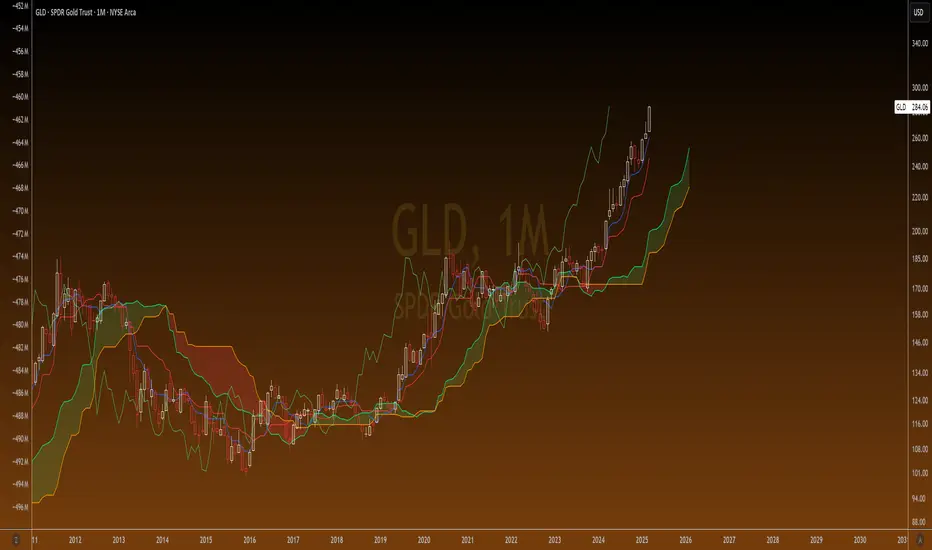
Hull Moving Average Adaptive RSI (Ehlers)Hull Moving Average Adaptive RSI (Ehlers)
The Hull Moving Average Adaptive RSI (Ehlers) is an enhanced trend-following indicator designed to provide a smooth and responsive view of price movement while incorporating an additional momentum-based analysis using the Adaptive RSI.
Principle and Advantages of the Hull Moving Average:
- The Hull Moving Average (HMA) is known for its ability to track price action with minimal lag while maintaining a smooth curve.
- Unlike traditional moving averages, the HMA significantly reduces noise and responds faster to market trends, making it highly effective for detecting trend direction and changes.
- It achieves this by applying a weighted moving average calculation that emphasizes recent price movements while smoothing out fluctuations.
Why the Adaptive RSI Was Added:
- The core HMA line remains the foundation of the indicator, but an additional analysis using the Adaptive RSI has been integrated to provide more meaningful insights into momentum shifts.
- The Adaptive RSI is a modified version of the traditional Relative Strength Index that dynamically adjusts its sensitivity based on market volatility.
- By incorporating the Adaptive RSI, the HMA visually represents whether momentum is strengthening or weakening, offering a complementary layer of analysis.
How the Adaptive RSI Influences the Indicator:
- High Adaptive RSI (above 65): The market may be overbought, or bullish momentum could be fading. The HMA turns shades of red, signaling a possible exhaustion phase or potential reversals.
- Neutral Adaptive RSI (around 50): The market is in a balanced state, meaning neither buyers nor sellers are in clear control. The HMA takes on grayish tones to indicate this consolidation.
- Low Adaptive RSI (below 35): The market may be oversold, or bearish momentum could be weakening. The HMA shifts to shades of blue, highlighting potential recovery zones or trend slowdowns.
Why This Combination is Powerful:
- While the HMA excels in tracking trends and reducing lag, it does not provide information about momentum strength on its own.
- The Adaptive RSI bridges this gap by adding a clear visual layer that helps traders assess whether a trend is likely to continue, consolidate, or reverse.
- This makes the indicator particularly useful for spotting trend exhaustion and confirming momentum shifts in real-time.
Best Use Cases:
- Works effectively on timeframes from 1 hour (1H) to 1 day (1D), making it suitable for swing trading and position trading.
- Particularly useful for trading indices (SPY), stocks, forex, and cryptocurrencies, where momentum shifts are frequent.
- Helps identify not just trend direction but also whether that trend is gaining or losing strength.
Recommended Complementary Indicators:
- Adaptive Trend Finder: Helps identify the dominant long-term trend.
- Williams Fractals Ultimate: Provides key reversal points to validate trend shifts.
- RVOL (Relative Volume): Confirms significant moves based on volume strength.
This enhanced HMA with Adaptive RSI provides a powerful, intuitive visual tool that makes trend analysis and momentum interpretation more effective and efficient.
This indicator is for educational and informational purposes only. It should not be considered financial advice or a guarantee of performance. Always conduct your own research and use proper risk management when trading. Past performance does not guarantee future results.

Air Gap MTF with alert settingsWhat it shows:
This indicator will show a horizontal line at a price where each EMAs are on on different time frames, which will remove the effort of having to flick through different time frames or look at different chart.
The lines itself will move in real time as price moves and therefore as the EMA values changes so no need to manually adjustment the lines.
How to use it:
The price gap between each of the lines are known as "air gaps", which are essentially zones price can move with less resistance. Therefore bigger the airgap there is more likely more movement in price.
In other words, where lines are can be a resistance (or support) and can expect price stagnation or rejection.
On the chart it is clear to see lines are acting as resistances/supports.
Key settings:
The time frame are fixed to: 30min, 1hr and 4hr. This cannot be changed as of now.
EMA values for each time frame are user changeable in the settings, and up to 4 different values can be chosen for each time frame. Default is 5,12,34 and 50 for each timeframe.
Line colour, thickness and style can be user adjusted. Start point for where line will be drawn can be changed in the settings, either: start of day, user defined start or across the chart. In case of user defined scenario user can input a number that specifies a offset from current candle.
Label colour, font, alignment, text size and text itself can be user adjusted in the settings. Price can be also displayed if user chooses to do so. Position of label (offset from current candle) is user specified and can be adjusted by the user.
Both the lines and labels can be turned off (both and individually), for each lines.
Alert Settings:
Manually, user can set alerts for when price crosses a specific line.
This can be done by:
right click on any of line
choose first option (add alert on...)
On the second option under condition, use the dropdown menu to choose the desired EMA/timeframe to set alert for.
Hit "create" at bottom right of option
----------------------------------------------------------------------
If anything is not clear please let me know!

MLB Momentum IndicatorMLB Momentum Indicator is a no‐lookahead technical indicator designed to signal intraday trend shifts and potential reversal points. It combines several well‐known technical components—Moving Averages, MACD, RSI, and optional ADX & Volume filters—to deliver high‐probability buy/sell signals on your chart.
Below is an overview of how it works and what each part does:
1. Moving Average Trend Filter
The script uses two moving averages (fast and slow) to determine the primary trend:
isUpTrend if Fast MA > Slow MA
isDownTrend if Fast MA < Slow MA
You can select the MA method—SMA, EMA, or WMA—and customize lengths.
Why it matters: The indicator only gives bullish signals if the trend is up, and bearish signals if the trend is down, helping avoid trades that go against the bigger flow.
2. MACD Confirmation (Momentum)
Uses MACD (with user‐defined Fast, Slow, and Signal lengths) to check momentum:
macdBuySignal if the MACD line crosses above its signal line (bullish)
macdSellSignal if the MACD line crosses below its signal line (bearish)
Why it matters: MACD crossovers confirm an emerging momentum shift, aligning signals with actual price acceleration rather than random fluctuation.
3. RSI Overbought/Oversold Filter
RSI (Relative Strength Index) is calculated with a chosen length, plus Overbought & Oversold thresholds:
For long signals: the RSI must be below the Overbought threshold (e.g. 70).
For short signals: the RSI must be above the Oversold threshold (e.g. 30).
Why it matters: Prevents buying when price is already overbought or shorting when price is too oversold, filtering out possible poor‐risk trades.
4. Optional ADX Filter (Trend Strength)
If enabled, ADX must exceed a chosen threshold (e.g., 20) for a signal to be valid:
This ensures you’re only taking trades in markets that have sufficient directional momentum.
Why it matters: It weeds out choppy, sideways conditions where signals are unreliable.
5. Optional Volume Filter (High‐Participation Moves)
If enabled, the indicator checks whether current volume is above a certain multiple of its moving average (e.g., 1.5× average volume).
Why it matters: High volume often indicates stronger institutional interest, validating potential breakouts or reversals.
6. ATR & Chandelier (Visual Reference)
For reference only, the script can display ATR‐based stop levels or a Chandelier Exit line:
ATR (Average True Range) helps gauge volatility and can inform stop‐loss distances.
Chandelier Exit is a trailing stop technique that adjusts automatically as price moves.
Why it matters: Though this version of the script doesn’t execute trades, these lines help you see how far to place stops or how to ride a trend.
7. Final Bullish / Bearish Signal
When all conditions (trend, MACD, RSI, optional ADX, optional Volume) line up for a long, a green “Long” arrow appears.
When all conditions line up for a short, a red “Short” arrow appears.
Why it matters: You get a clear, on‐chart signal for each potential entry, rather than needing to check multiple indicators manually.
8. Session & Date Filtering
The script allows choosing a start/end date and an optional session window (e.g. 09:30–16:00).
Why it matters: Helps limit signals to a specific historical backtest range or trading hours, which can be crucial for day traders (e.g., stock market hours only).
Putting It All Together
Primary Trend → ensures you trade in line with the bigger direction.
MACD & RSI → confirm momentum and avoid overbought/oversold extremes.
ADX & Volume → optional filters for strong trend strength & genuine interest.
Arrows → each potential buy (Long) or sell (Short) signal is clearly shown on your chart.
Use Cases
5‐Minute Scalping: Shorter RSI/MACD lengths to catch small, frequent intraday moves.
Swing Trading: Larger MAs, bigger RSI thresholds, and using ADX to filter only major trends.
Cautious Approach: Enable volume & ADX filters to reduce false signals in choppy markets.
Benefits & Limitations
Benefits:
Consolidates multiple indicators into one overlay.
Clear buy/sell signals with optional dynamic volatility references.
Flexible user inputs adapt to different trading styles/timeframes.
Limitations:
Like all technical indicators, it can produce false signals in sideways or news‐driven markets.
Success depends heavily on user settings and the particular market’s behavior.
Summary
The MLB Momentum Indicator combines a trend filter (MAs), momentum check (MACD), overbought/oversold gating (RSI), and optional ADX/Volume filters to create clear buy/sell arrows on your chart. This approach encourages trading in sync with both trend and momentum, and helps avoid suboptimal entries when volume or trend strength is lacking. It can be tailored to scalp micro‐moves on lower timeframes or used for higher‐timeframe swing trading by adjusting the input settings.

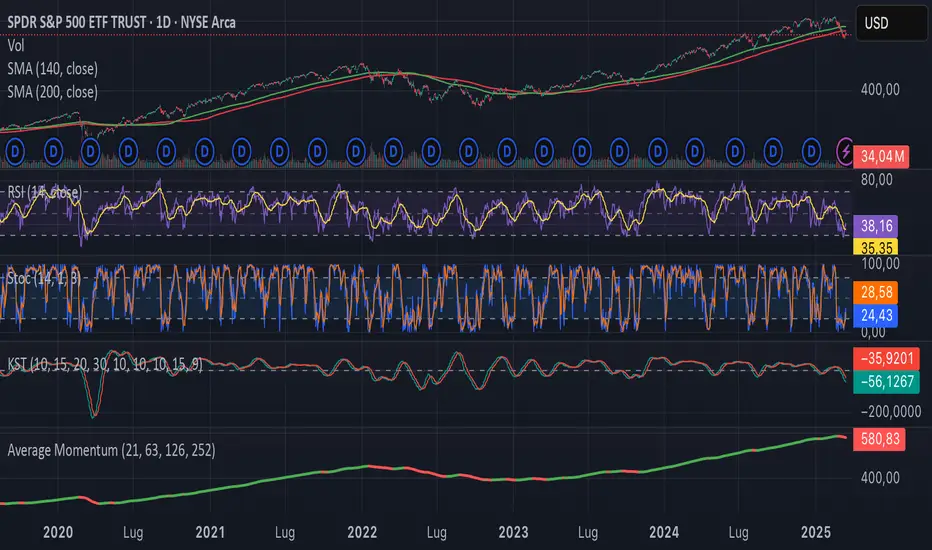
Average MomentumThis indicator will calculate for any given equity four values: the simple average of the indicated equity for a timeframe of one month, three months, six months for twelve months. Then the script will create the average value of those four averages and display it in red if the value decreases and green if it progresses. It is useful as an indicator to go risk off.