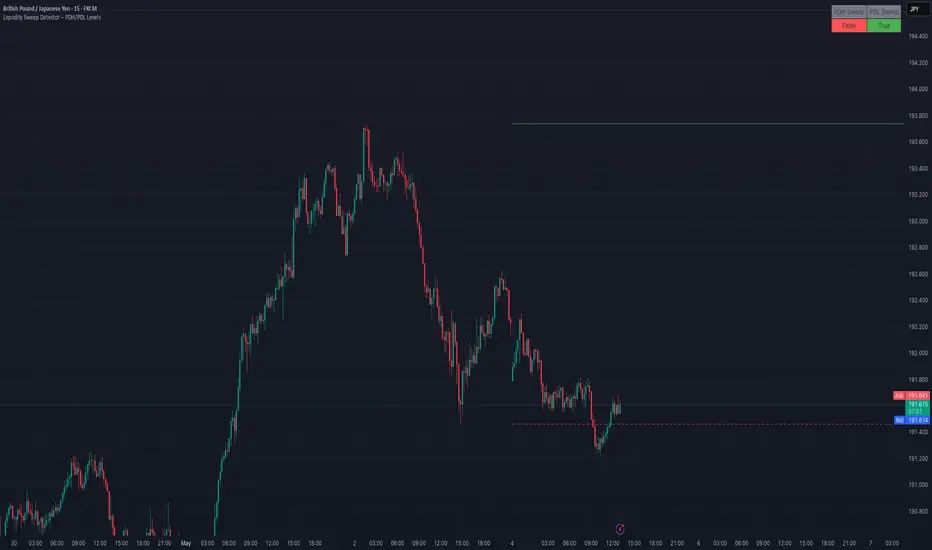
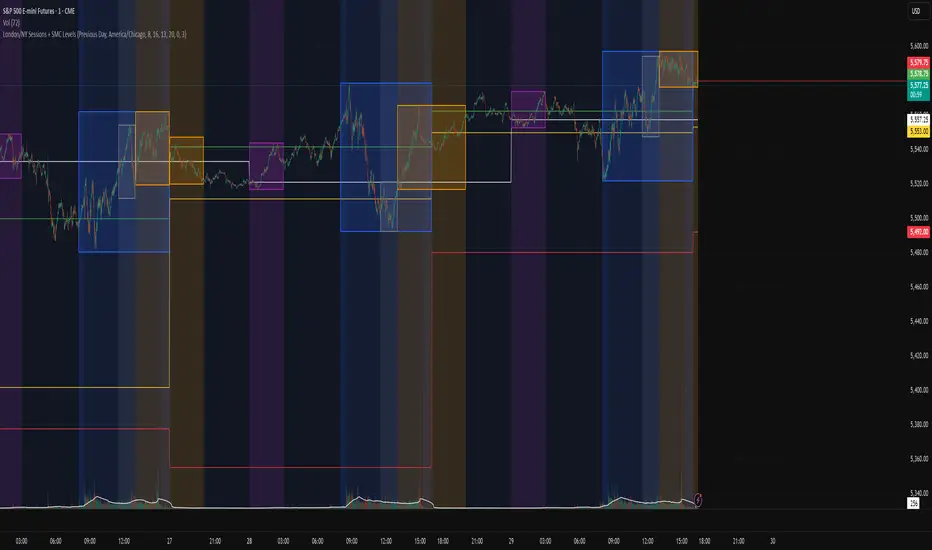
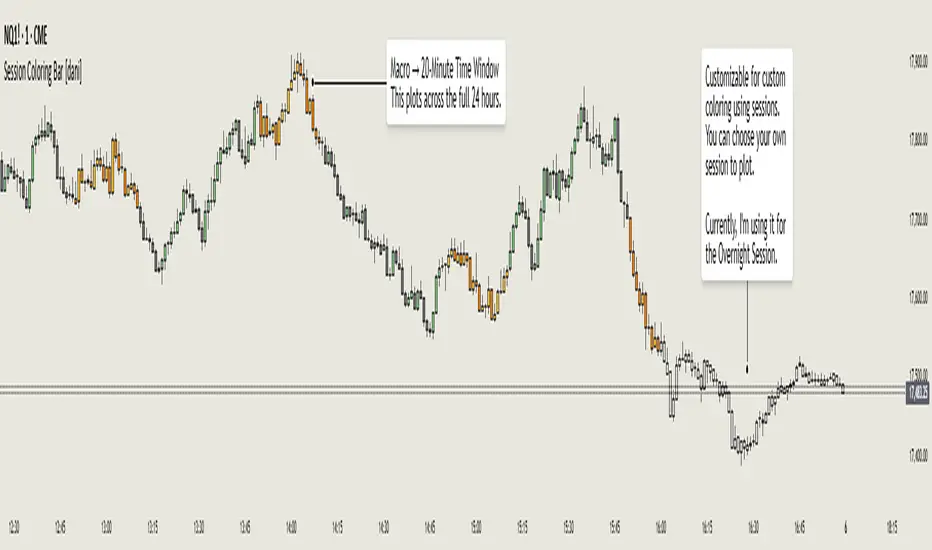
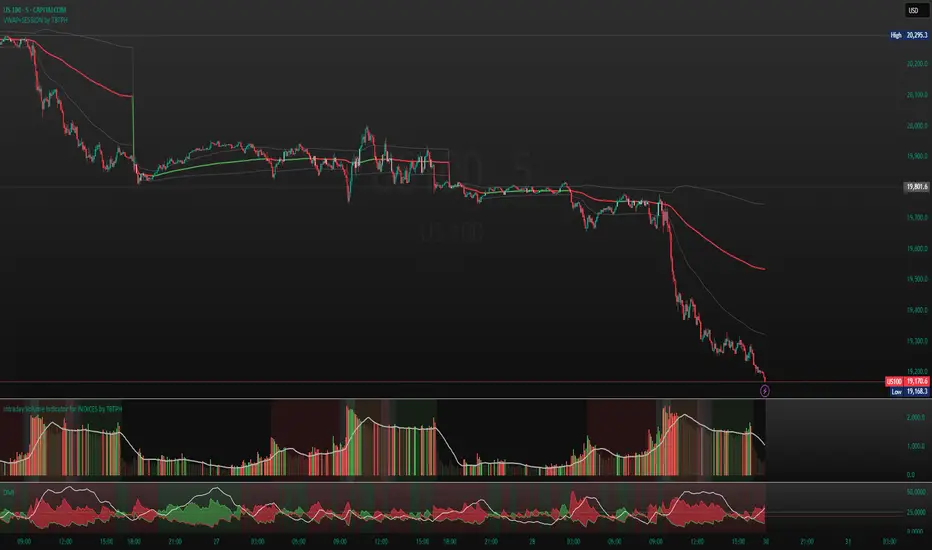
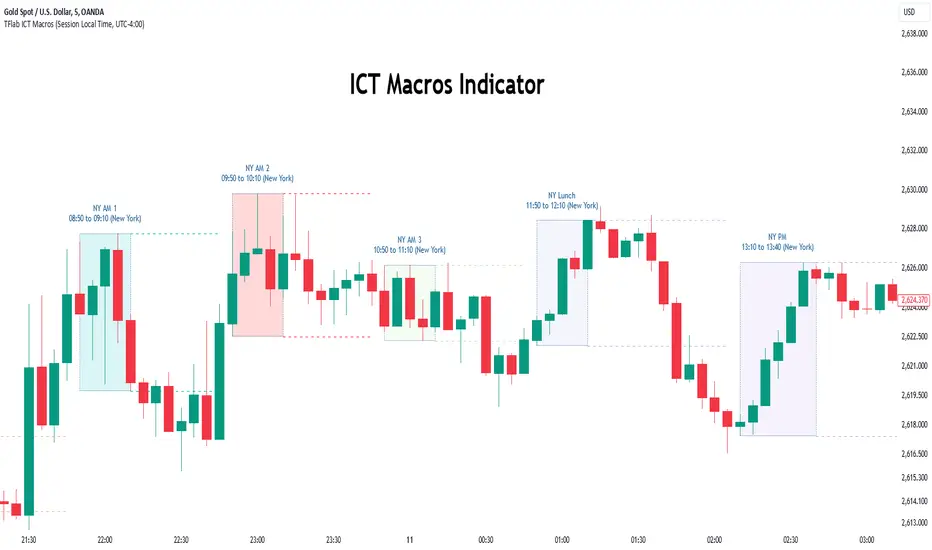
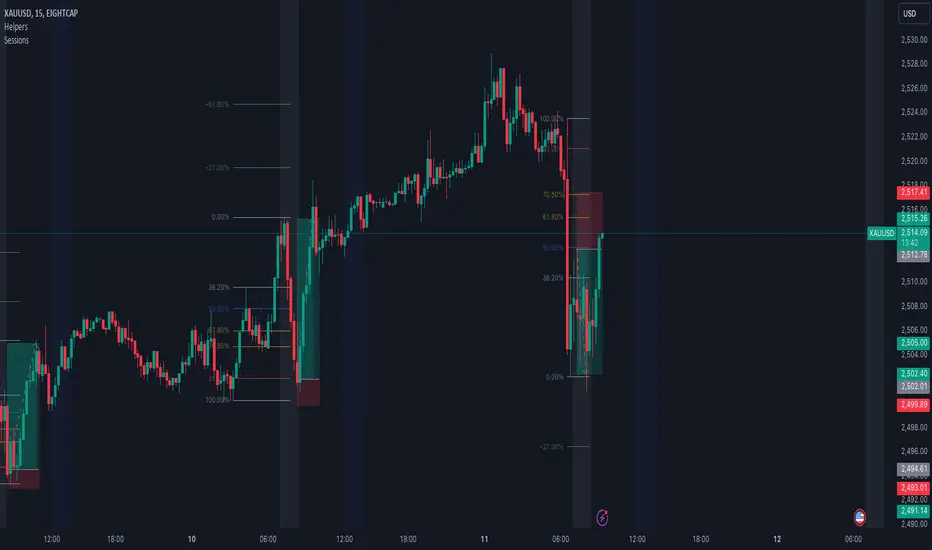
Overnight Session StateOvernight Session State
Overnight drift is a well-known concept in equities and index futures. This indicator asks a narrower question. Does that drift depend on where price sat relative to the moving averages when the session began?
"If the close prints above the 1H EMA stack, does the night behave differently than if it prints below? Is a night that starts inside the stack a coin flip, or something else?"
That is the whole question this tool was built to answer. It reads where price sits against the EMA stack (20/50/100) at the 16:00 ET close, labels the night above, below or mixed, and draws what happened. The panel then keeps score for each label: average drift, win rate and average range.
🔶 USAGE
Load the indicator on a 1H chart. It was built and tested on index futures (MNQ, MES, NQ, ES), but it runs on anything with an overnight session — set the entry and exit hours to suit the market you're on.
Each overnight session is one shaded box, from the 16:00 ET entry bar to the 07:00 ET exit bar. The box height is the session high to low. The colour is the outcome: green if the 07:00 close finished above the 16:00 entry, red if below.
Inside each box, the solid line is the entry price and the dashed line is the exit price. The gap between them is the overnight drift.
The glyph on the top edge of each box is the state the night started in:
▲ ABOVE — price above all three EMAs at entry
▼ BELOW — price below all three EMAs at entry
• MIXED — price inside the stack at entry
Look at the ▼ nights and see if they look different from the ▲ nights. Then check the panel to see if you notice any trends.
The panel shows which state the current session is in, then a row for above, below and mixed with the number of nights, average drift in bp, win rate and average range in bp across the chart's loaded history. The last bar's time is written at the bottom so you know the numbers are current.
🔶 DETAILS
The state is set once, on the 16:00 bar, using the EMA values from the bar before. It doesn't change after that. The box colour updates as the night goes on and locks in at 07:00. Nothing repaints.
Drift is measured from the 16:00 open to the 07:00 close. Range is the high to low of the whole session. Both are in basis points (1 bp = 0.01%) so the numbers compare across contracts at different price levels.
Nights with no 07:00 bar within 16 hours (holidays, data gaps) are skipped. Sunday's entry is 18:00 ET. Session times are worked out in the session timezone, not the chart's, so the numbers don't change if you switch chart timezones, but the boxes will only line up with the time axis if the chart is set to New York.
🔶 SETTINGS
EMA Stack
EMA 1 / EMA 2 / EMA 3 — the three averages that set the state (20 / 50 / 100)
Show EMA stack — draw the three lines on the chart
EMA colours follow chart theme — lines pick a neutral colour to suit light or dark charts; untick to set your own
EMA 1 / 2 / 3 colour — used when the theme option is off
Session
Session timezone — America/New_York by default; the session hours below are read in this zone
Entry hour Mon–Thu — 16
Entry hour Sunday — 18
Exit bar hour — 7
Drop segment if no exit within (h) — nights with no exit bar inside this window are skipped
Style
Night paid — box and line colour when the exit closes above entry
Night lost — colour when it closes below
Box transparency — 80 by default
Show state glyph — the ▲ ▼ • marker on each box
Panel
Show panel
Corner — move the stats table if it overlaps something
🔶 SUMMARY
Most charts don't give you a clean look at the overnight session. This one does. Each night is labelled by where it started against the averages, boxed by what it did, and counted in the panel so you can see how each group has behaved over the history you've got loaded. What you make of it is up to you. Some people will see a pattern, some won't.
It's not a buy signal and it doesn't include commission or slippage. It's just a way to see how price moved during the overnight session.
Penunjuk

MOYA Sessions & Volume Profile [RealSebastianMoya]Hello traders!
Introducing: "MOYA Sessions and Volume Profile"
This script rebuilds a full Volume Profile for any session length you choose — from a single Tokyo/London/New York session up to a full Yearly cycle — and layers on POC, Value Area High/Low, a live in-progress profile, and (new) real futures volume normalization for Forex/CFD charts.
But before getting into the settings, it's worth explaining where this way of reading the market comes from, because the indicator has no real value if you don't know what questions it's actually answering.
The Underlying Theory: Auction Market Theory
The market isn't a line going up or down. It's a continuous auction. At every moment, buyers and sellers are negotiating a "fair" price, and price moves searching for the level where both sides are willing to transact in volume.
This theory — originally developed for Market Profile by J. Peter Steidlmayer at the CBOT — starts from a simple idea:
Price tells you where the market moved. Volume tells you how much conviction was behind that move.
A regular candlestick chart only shows you the time sequence of price. A Volume Profile rotates that information 90 degrees and asks a different question at every price level: "how much actually traded here?"
The level with the most activity is the Point of Control (POC) — the price the market has "voted" for most often as fair.
The Two Market Regimes
Under this theory, the market constantly alternates between two regimes:
Balance / Equilibrium
Technical name: Balance, Rotational Value Area
What it means: Buyers and sellers accept a range and price rotates inside it without clear direction
Profile shape: Bell curve (D-Shape) — POC centered
Imbalance / Trend
Technical name: Imbalance, Trend Day, Directional Auction
What it means: One side (buyers or sellers) dominates and price refuses to rotate, moving away from the range
Profile shape: Spike (P-Shape or b-Shape) — POC at one extreme
Knowing which regime the market is in completely changes what a touch of the POC or a Value Area edge should mean to you. This is what many newer traders miss: they apply the same rule ("buy at VAL, sell at VAH") regardless of regime, and end up fading strong trends as if they were reversions.
Correct Terminology — What Each Thing Is Actually Called
Here's the real vocabulary used when trading with Volume Profile, so you know exactly which term to use and what each one means:
Levels
POC (Point of Control): the price with the highest traded volume in the session. It's the center of gravity of price.
VAH (Value Area High): the upper boundary of the zone where 70% (adjustable) of volume occurred.
VAL (Value Area Low): the lower boundary of that same zone.
Value Area (VA): the full range between VAH and VAL — the fair price zone accepted by the market.
Naked POC: a POC from a previous session that price has not yet returned to touch. These act as strong magnets because they represent unresolved business.
Price Behaviors
Mean Reversion: when price moves away from the POC but returns to it because the market is in balance. This is the dominant behavior inside an equilibrium regime.
Continuation: when price breaks a Value Area extreme and keeps moving in that direction without returning, because the market is in imbalance.
Rejection: price touches a level (VAH, VAL, or POC) and snaps back quickly, leaving a wick — a sign that level was defended.
Acceptance: price enters a zone and stays there, building new volume — a sign the market considers that new range fair.
Excess: a long, thin wick with no volume behind it — a sign of violent rejection of a price, typical at range extremes.
Breakout: when price exits the Value Area with force and increasing volume. If acceptance follows the breakout, it confirms as a trend start; if there's no acceptance, it's a false breakout (fakeout) and price returns to the range (this is mean reversion after a failed breakout attempt).
Double Distribution (B-Shape): when the profile shows two high-volume zones separated by a low-volume zone — indicates the market was in two distinct price agreements during the session, typical of a trend that paused midway.
On Buyers and Sellers
Classic Volume Profile doesn't directly measure who bought or sold (that's what Delta/CVD does, not part of pure profile reading), but dominance can be inferred by observing:
If the POC shifts upward session after session, buyers are defending higher prices, buyer control.
If the POC shifts downward session after session, seller control.
If the POC stays relatively fixed while volume grows, both sides are actively negotiating without ceding ground, balance, indecisive market.
How the Indicator Works Within This Theory
The script tracks session boundaries using exact timeframe change detection and rebuilds the price/volume grid every time a new session starts.
Each candle's volume is distributed across the price levels its high-low range actually touched (body/wick weighted model), so the profile reflects where price genuinely spent time and volume — not just where it closed.
Once a session closes, the script locates the POC and expands outward, level by level, until the configured percentage of total volume (default 70%) is captured — that boundary becomes your Value Area.
Rather than just showing you where price moved, this helps you answer:
Where did volume concentrate during the session?
Was the session accepted (balance) or rejected (imbalance)?
Where is the fair price zone for this period?
How does that zone line up against higher or lower timeframe context?
While a session is still forming, the script keeps its profile, POC, and Value Area updating in real time (Live Zone) — not just the last closed session — so you can react to developing structure instead of only analyzing it afterward.
Trading Scenarios — How This Is Actually Traded
These are the real scenarios where this reading applies. You add the chart; here's the logic behind each one.
Scenario 1 — Mean Reversion Inside Balance
Regime context: The previous session's profile shows a bell-curve shape (D-Shape), POC centered, and a wide Value Area that has stayed stable across several sessions. This indicates a market in balance.
What you see on the Volume Profile: Current price is drifting away from the POC toward the VAH without growing volume behind it (little real push).
Reading: Since we're in a balance regime, the move toward VAH is likely testing the edge of the range, not the start of a trend.
How it's traded: Look for a short on rejection at the VAH, targeting the POC. Stop above the VAH with a small buffer. This is the classic fade trade — and it only makes sense because the regime is balance; the same signal in a trending regime would be a trap.
Scenario 2 — Continuation After a Breakout With Acceptance
Regime context: Price breaks above the previous session's VAH. Instead of falling back, price stays above that level for several candles, and the new forming profile (Live Zone) starts building its own POC above the old VAH.
What you see on the Volume Profile: Acceptance — the market is actively trading in the new price range, not just passing through it.
Reading: This is evidence of directional imbalance — control shifted hands (likely to buyers) and a new Value Area is forming higher up.
How it's traded: Look for a long entry on the first pullback into the old VAH (which now acts as support — the classic resistance-to-support flip), targeting the next significant volume level from a higher timeframe (e.g., the weekly POC if you're trading on Daily). Stop below the old POC.
Scenario 3 — False Breakout (Fakeout) — Reversion, Not Continuation
Regime context: Price breaks below the VAL with a strong candle, but in the following session (or in the indicator's Live Zone) price returns inside the original Value Area without building new volume below.What you see on the Volume Profile: No acceptance — the new profile forming outside the range has very little volume compared to the prior profile, a sign nobody is defending that price.
Reading: The breakout was a liquidity grab, not a real regime change. The market is still in balance.How it's traded: Look for a long entry on the return inside the Value Area, targeting the POC and potentially the opposite VAH. This is the scenario where confusing "breakout" with "continuation" costs the most money — which is why the indicator's Live Zone is key: it lets you see in real time whether the new profile is gaining volume (real continuation) or staying empty (fakeout).
Scenario 4 — Double Distribution (B-Shape) — A Pause Inside a TrendRegime context: The session's profile shows two separate high-volume zones with a thin low-volume "neck" between them.
What you see on the Volume Profile: The market traded heavily in one range, then migrated and traded heavily again in another range, without spending much time in the middle.Reading: This typically occurs inside a trend that paused — two distinct price agreements in the same session, usually connected by a fast directional move (the low-volume "neck" is where price moved without resistance).
How it's traded: The low-volume neck (the thin part of the profile) is a low-liquidity zone — if price returns there, it tends to cut through quickly in either direction, not stay. It's not a zone to trade reversion; it's a zone to wait for price to cross through and react at the POC of whichever side it's heading toward.
Scenario 5 — Multi-Timeframe Confluence (the Indicator's Most Powerful Use)Regime context: You run the indicator on Weekly and see current price touching the weekly VAL. You switch to Daily and see a daily POC also forming right at that same level.
What you see on the Volume Profile: Two different timeframes coinciding at the same price — the "why" (weekly context) and the "when" (daily execution) are aligned.Reading: This confluence across timeframes is the highest-probability signal in the whole system, because it doesn't depend on a single profile — it depends on the market respecting the same level from two different time perspectives.
How it's traded: Take the entry on Daily (precise execution), with directional bias given by the weekly regime (if weekly price is in balance, trade the reversion toward the weekly POC; if weekly is in imbalance, trade continuation toward the next relevant volume level). Stop goes outside the daily Value Area; target is the weekly POC or the opposite VAH/VAL, depending on the identified regime.
Scenario 6 — Using Real Futures Volume to Confirm Regime on Forex/CFDRegime context: You're trading XAUUSD on your CFD broker. Your broker's tick volume is synthetic (it counts price changes, not real contracts), so a profile built on that volume can show a different shape than actual market activity.
What you see on the Volume Profile: With External Futures Volume enabled and auto-detect pointing to COMEX:GC1! (Gold futures), the profile now reflects real futures market participation, while price levels still come from your XAUUSD chart.
Reading: This matters especially when your broker's tick volume gives you a POC in one place and real futures volume gives you a POC somewhere else — the difference tells you that real institutional market activity sits at a different level than what your broker is showing.
How it's traded: Prioritize the POC/VA calculated with real futures volume over native tick volume when the two diverge, because regulated futures volume (CME/COMEX/NYMEX) is auditable and reflects real participation, while tick count only reflects your specific broker's activity.Summary — Why Use This IndicatorThis script is designed for traders who read the market through:Volume Profile and Point of Control / Value Area (Auction Market Theory)Market regime identification (balance vs. imbalance)Multi-timeframe confluenceReal vs. synthetic volume on Forex/CFD instruments
Because you can run the same profile logic across completely different session lengths — from a single hourly cycle to a full year — you can compare how conviction built across timeframes: does the Daily POC sit inside last week's Value Area? Is price accepted or rejected at last month's VAH? That layered context is where this script earns its keep.Note: every scenario assumes you identify the market regime (balance vs. imbalance) first before deciding whether to trade reversion or continuation — trading the wrong signal for the wrong regime is the most common cause of losses when using Volume Profile.
Features
56 Session Lengths — 1 to 55 Minutes (1m, 2m, 3m, 4m, 5m, 6m, 7m, 8m, 9m, 10m, 12m, 15m, 20m, 25m, 30m, 35m, 40m, 45m, 50m, 55m), Tokyo, London, New York, 1 Hour through 12 Hours, Daily through 7 Days, Weekly through 5 Weeks, Monthly through 7 Months, Quarterly, Yearly.
POC, VAH, VAL with lines and text labels.
HVN/LVN — detects multiple volume peaks and valleys per session, not just the single POC.
External Futures Volume — auto-detects the real related futures contract for your symbol (metals, forex, indices, energy, crypto).
Live Panel — POC, VAH, VAL, distance, VA position, active volume source.
Configurable Styling — independent colors, widths, and sizes for every element.
Open Source Attribution and Credits
In strict compliance with TradingViews House Rules regarding open-source code reuse, I explicitly credit and thank the original developer @LeviathanCapital for their open-source script "Market sessions and Volume profile - By Leviathan", which served as the structural foundation for the session isolation and baseline volume array logic in this indicator.
Significant Algorithmic Enhancements and Added Value:
While the primary mathematical grid expansion retains architectural roots from open source, this script introduces massive procedural improvements, structural upgrades, and new calculations developed entirely by me to transform it into an institutional-grade utility:
Automated External Futures Volume Normalization (Forex/CFD Context): Implemented a dictionary algorithm (getAutoFuturesTicker) to auto-detect and scale native tick charts against centralized futures markets (e.g., CME:6E1!, COMEX:GC1!, CME_MINI:NQ1!). This replaces synthetic broker data with authentic trading volume while maintaining local price scales.
Volume Nodes Engine (Multi-Peak HVN / LVN Detection): Developed an array scanning filter that runs on closed sessions to automatically isolate contiguous high/low volume anomalies. This effectively flags multiple supply/demand zones (like the humps of a double-distribution profile) beyond the baseline single POC.
Real-Time Live Zone Tracking: Integrated a dynamic recalculation engine for ongoing unclosed trading sessions, updating developing POCs, VAHs, and VALs seamlessly on the active bar state.
Interactive Live Dashboard Panel: Programmed a comprehensive on-screen status table displaying absolute values for POC/VAH/VAL, current distance from point of control, value area boundary status, and status indicators of the active volume feed.
Expanded Graphical and Period Customization: Redesigned aesthetic configurations, text label sizing, box boundary styles, and added resolution adjustments alongside line right-extensions.
Open Source Attribution and Credits
In strict compliance with TradingViews House Rules regarding open-source code reuse, I explicitly credit and thank the original developer LeviathanCapital for their work.
The original script "Market sessions and Volume profile - By @LeviathanCapital served as the logical foundation for the session isolation and baseline volume array logic in this indicator. All rights and original logical baselines remain under their respective ownership.
Penunjuk

[Viprasol] Gold Sniper ConfluenceOverview
Gold Sniper Confluence is a gold-only edition of the Sniper Confluence engine, which builds on "Sniper Entry/Exit with SL&TP by KhanSaab V.02" by KhanSaab (open-source). KhanSaab's script provides the fast / slow EMA crossover trigger, the ATR-based stop-loss and take-profit ladder, the VWAP overlay, RSI and MACD read-outs, a secondary-timeframe RSI and the EMA-retest candle highlight. This version keeps every one of those components and adds two layers on top: a confluence scoring gate that decides whether a crossover is allowed to become a signal, and a gold layer that only exists because gold trades differently from other markets: a symbol guard that suppresses signals on non-gold charts, a US Dollar Index (DXY) inverse-correlation factor, a London / New York session filter and an average-daily-range (ADR) exhaustion filter with dollar and point risk read-outs.
It is built for XAUUSD and GC / MGC futures traders on intraday charts who want each crossover confirmed by the dollar, the session and the day's remaining range before acting. The on-chart HOW IT WORKS legend, live checklist and summary footer explain the logic directly on the chart.
Why Gold Needs Its Own Filters (Mashup Justification)
- Gold is priced in dollars, so a rising dollar is a headwind for gold and a falling dollar a tailwind. An EMA crossover that fights the dollar is a lower-quality crossover. The DXY factor scores that relationship, but only while the two are actually moving inversely, because the link does break at times (risk-off days, rate shocks).
- Gold's volume and range are concentrated in the London and New York sessions. Crossovers during the Asian session tend to happen in thin, choppy conditions and are more likely to whipsaw.
- Gold has a fairly stable average daily range. Once the day has already travelled its usual distance, a late crossover is buying or selling into exhaustion. The ADR filter blocks those entries.
- The symbol guard keeps the DXY and ADR logic honest: it only makes sense on gold, so signals are suppressed elsewhere unless you deliberately turn gold-only mode off.
How It Works
1. EMA crossover trigger (from original)
Fast EMA (default 9) crossing above the slow EMA (default 21) is a long trigger; crossing below is a short trigger. With bar-close confirmation on (new), the cross must still hold when the bar closes.
2. Confluence score, 8 factors (factors 1-7 were displayed in the original; the scoring gate and factor 8 are new)
Each bar the indicator counts how many factors agree with each direction:
bullScore = 0
bullScore += close > VWAP
bullScore += RSI(14) > 50
bullScore += MACD line > signal line
bullScore += fast EMA > slow EMA
bullScore += ADX(14) > 25 and close > fast EMA
bullScore += volume > SMA(volume, 20) and close > open
bullScore += RSI(14) on the confirmation timeframe > 50
bullScore += DXY inverse factor (see step 3)
bearScore = mirror image (below instead of above)
a crossover becomes a signal only if its score >= Minimum score (default 5 of 8)
3. DXY inverse-correlation factor (new)
dxyClose, dxyEma = DXY close and EMA(dxyClose, 21) on the chart timeframe
corr = correlation(close, dxyClose, 20)
linkActive = corr <= -0.3
bull point if linkActive and dxyClose < dxyEma (dollar weak)
bear point if linkActive and dxyClose > dxyEma (dollar strong)
no point to either side while the link is not active
The dashboard shows the DXY value, its trend arrow, the live correlation and a tick when the link is active. Turning the factor off makes the score out of 7.
4. Gold symbol guard (new)
isGold = base currency == "XAU"
or ticker contains "XAU" or "GOLD" (non-stock symbols)
or futures root == "GC" or "MGC"
or ticker contains your custom keyword
if gold-only mode and not isGold: signals suppressed, dashboard header turns red
5. London / New York session filter (new)
inLondon = bar time inside 03:00-12:00 (New York time, editable)
inNewYork = bar time inside 08:00-17:00 (New York time, editable)
sessionOk = filter off, or chart is daily or higher, or inLondon or inNewYork
Blocked crossovers are marked with a small grey x and the dashboard shows which session (or ASIA / OFF-HOURS) the last bar belongs to. The active session can be shaded on the chart.
6. ADR exhaustion filter (new)
ADR = SMA(daily high - daily low, 14) taken from completed days only
todayRange = running high - running low of the current day, built from the chart's own bars
adrUsed% = todayRange / ADR * 100
adrOk = filter off, or adrUsed% < Block threshold (default 100%)
The ADR is requested from the daily feed with a one-bar offset so historical and live bars see the same completed-day value. Because the ADR uses finished days and today's range is accumulated bar by bar, neither value repaints. The dashboard shows ADR in dollars and the percentage used, turning amber from 75% of the threshold and red once blocked.
7. Final signal gate (new)
LONG = bull crossover and bullScore >= minimum and goldOk and sessionOk and adrOk and not already long
SHORT = mirror image
Every gate only removes crossovers; none of them creates a signal that the original crossover logic would not have produced.
8. ATR stop and take-profit ladder (from original, extended)
Stop = entry -/+ ATR(14) x 1.5. Targets sit at 1R, 2R and 3R. The number of targets (1-3) is configurable (new), target lines turn turquoise and the label gets a tick when touched (from original) and the stop moves to breakeven when TP1 is hit (new). Every label states its distance from entry in points, for example "SL: 4364.87 (-50 pts)" or "TP1: 4355.83 (+40 pts)", and the dashboard shows the same distances in dollars and points (new). The point size is configurable because brokers count gold points differently.
9. Retest candles (from original)
While a trade is active, a candle that pulls back into the fast EMA without breaking the slow EMA is coloured orange.
What Is Original (Viprasol Additions)
1. Confluence scoring gate: the seven original read-outs are turned into a score that must reach a minimum before a crossover can fire.
2. DXY inverse-correlation factor with a rolling-correlation switch, so the dollar only votes while the inverse link is real.
3. Gold symbol guard that detects spot, CFD and futures gold from the symbol and suppresses signals elsewhere.
4. London / New York session filter with editable windows and timezone.
5. ADR exhaustion filter using completed-day ranges and a live, non-repainting intraday range, plus dollar and point risk read-outs on the labels and dashboard.
6. Bar-close confirmation of the crossover.
7. Breakeven trailing after TP1 and a configurable number of take-profit levels.
8. Blocked-signal markers that show exactly which crossovers the gold filters removed and why.
Key Features
From the Original (KhanSaab):
- Fast / slow EMA crossover long and short triggers
- ATR-based stop-loss and take-profit levels with hit colouring
- VWAP overlay with directional colouring
- RSI, MACD, ADX and volume read-outs
- Secondary-timeframe RSI
- Orange EMA-retest candles
Added in This Version (Viprasol):
- 8-factor confluence score with minimum-score gate
- DXY inverse-correlation factor with live correlation check
- Gold symbol guard with custom keyword
- London / New York session filter with session shading
- ADR exhaustion filter with % used and $ / pts distances
- Bar-close confirmation, breakeven trail, 1-3 configurable targets with signed point distances on every label
- Grey x markers for crossovers blocked by a gold filter
- Dashboard with every factor, the three gold gates and the open trade
- HOW IT WORKS legend, live tick / cross checklist and strategy summary panels, each with its own position setting
- Ten alert conditions with dynamic messages
How to Use
Setup:
1. Open a gold chart (OANDA:XAUUSD, FX:XAUUSD, COMEX:GC1! or MGC1!) using standard candlesticks.
2. Keep the default 9 / 21 EMAs and minimum score 5 to start.
3. Check the Session timezone. Windows are written in New York time by default; switch to Exchange if you prefer your broker's clock.
4. Set Point size to match how your broker counts gold points (0.10 for most, so a $5.00 stop reads as 50 pts).
Reading the chart:
- BUY label below a bar = bullish crossover that passed the score and all three gold gates. SELL label above a bar = bearish equivalent.
- Grey x = a crossover that had enough confluence but was blocked by the symbol guard, the session filter or the ADR filter. The dashboard's Signal row names the reason.
- Cyan dashed line = entry, red line = stop, green dashed lines = TP1-TP3. Each line ends at a label that shows the price and the distance from entry in points. A turquoise line and a tick on the label mean that target was touched. A dotted cyan stop means it has moved to breakeven.
- Orange candle = pullback into the fast EMA while the trade is active.
- Violet shading = London window, gold shading = New York window, brighter gold = the overlap.
Panels:
- HOW IT WORKS (top left by default) explains the flow in seven lines.
- Checklist (bottom left by default) shows a tick or cross for all eight factors and the three gold gates for the currently stronger side, and states whether the engine is ARMED, BLOCKED or waiting for confluence.
- Dashboard (top right by default) shows live values, DXY, session, ADR, risk in $ and points, and trade status.
- Every panel has its own position setting (nine positions), so they can be arranged to suit any chart size.
Recommended starting points:
- Scalping (1m-5m): EMA 5 / 13, minimum score 6, ATR x 1.0, ADR block 90%
- Intraday (15m-1H): EMA 9 / 21, minimum score 5, ATR x 1.5, ADR block 100%
- Swing (4H-1D): EMA 9 / 21, minimum score 4, ATR x 2.0, session filter off
These are starting points only. Gold's volatility regime changes; test on historical data and adjust before trading live.
Settings
1 Signal Engine: fast EMA, slow EMA, bar-close confirmation.
2 Confluence Filter: enable the gate, minimum score (out of 8).
3 Gold Symbol Guard: gold-only mode, extra gold ticker keyword.
4 DXY Dollar Factor: enable, DXY symbol, DXY trend EMA, correlation lookback, inverse-link threshold.
5 Gold Sessions: enable, London window, New York window, timezone, session shading.
6 ADR Exhaustion: enable, ADR lookback, block threshold (% of ADR), point size.
7 Risk Management: stop-loss ATR multiplier, ATR period, number of take-profit levels, breakeven at TP1.
8 Confirmation Timeframe: timeframe of the secondary RSI factor.
9 Dashboard: show, position, text size.
10 On-Chart Panels: HOW IT WORKS legend, live checklist, strategy summary, each with a show toggle and its own position.
11 Visuals: EMA ribbon and transparency, VWAP, trade lines and labels, label size and offset, retest candles, blocked-signal markers.
Alerts
1. Gold Long Entry - bullish crossover passed the score and all gold gates
2. Gold Short Entry - bearish equivalent
3. Any Gold Entry - either direction
4. Strong Bull Bias - bull score crossed above 70%
5. Strong Bear Bias - bear score crossed above 70%
6. DXY Inverse Link Active - gold / DXY correlation fell back below the threshold (new)
7. DXY Inverse Link Lost - correlation rose above the threshold, DXY factor paused (new)
8. Gold Session Opened - the London or New York window just started (new)
9. ADR Exhausted - today's range reached the block threshold (new)
10. Signal Blocked by Gold Filter - a qualifying crossover was removed by a gold gate (new)
All alerts include {{ticker}}, {{close}} and {{interval}} placeholders.
Limitations & Disclaimer
- EMA crossovers lag by nature. The gates reduce whipsaws but cannot remove them; ranging days will still produce crossovers that fail.
- The DXY factor depends on the dollar-index symbol being available to your account and having data on the chart timeframe. When DXY is closed (weekends, holidays) the last known value is carried forward.
- The correlation gate uses a rolling window; at the very start of the chart history it is empty and the DXY factor scores nothing.
- The DXY factor is scored, not gated. At the default minimum of 5 the signals are a subset of the general-market Sniper engine; if you lower the minimum to 4, a cross with only three of the original factors plus the DXY point can qualify.
- A crossover that is blocked by a gold gate still ends the opposite open trade, exactly as an unblocked crossover would. Only the new entry is withheld.
- Session windows are wall-clock filters. Holidays, daylight-saving changes and broker-specific hours can shift when gold is actually liquid.
- ADR is a statistical average. Gold can and does exceed it on news days; the filter deliberately stays out of those late moves.
- The secondary-timeframe RSI uses request.security and its current-bar value can change until that timeframe's bar closes.
- Entry, stop and target lines are visual references only. The indicator does not place or manage trades.
- Past performance of any signal system does not guarantee future results. This indicator is for educational and analytical purposes only and is not financial advice. Always use proper risk management and do your own analysis before trading.
Credits & Attribution
This indicator is derived from "Sniper Entry/Exit with SL&TP by KhanSaab V.02" by KhanSaab (open-source, TradingView). The following components originate from that script:
- Fast / slow EMA crossover signal logic
- ATR-based stop-loss and take-profit calculation with target-hit colouring
- VWAP overlay
- RSI, MACD, ADX and volume read-outs
- Secondary-timeframe RSI (originally fixed to 5 minutes)
- EMA-retest candle highlighting
Viprasol additions: confluence scoring gate, DXY inverse-correlation factor, gold symbol guard, London / New York session filter, ADR exhaustion filter with $ / point read-outs, bar-close confirmation, breakeven trailing, configurable take-profit count and blocked-signal markers.
Published open-source per TradingView House Rules.
Penunjuk

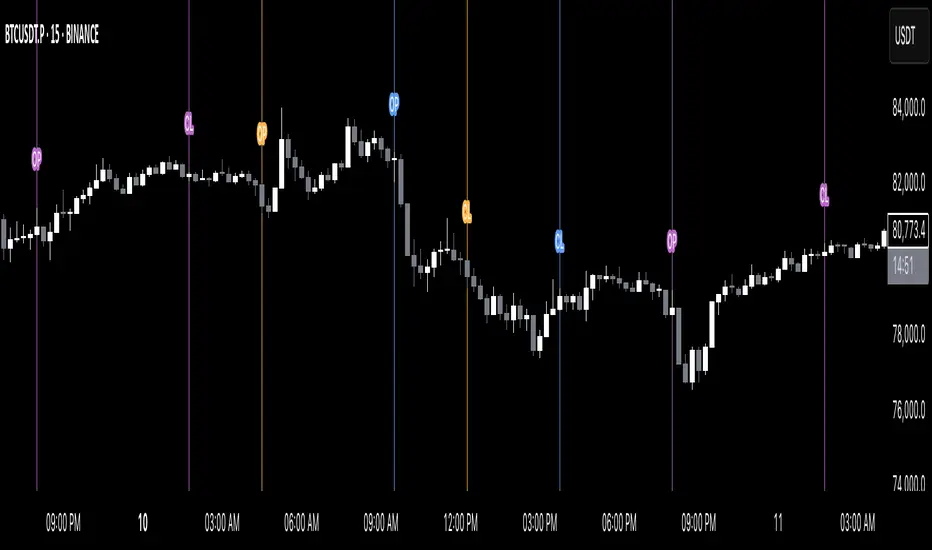
Coasyn Session AnchorCoasyn Session Anchor
Coasyn Session Anchor is an intraday session-reference tool for marking important FX trading-session events directly on the chart.
The indicator can track:
Tokyo Open
Tokyo Close
Europe Open
London Open
New York Open
New York Close
Each enabled event can create:
a vertical timing marker showing when the session event occurred
a horizontal price anchor extending from that event
an optional label identifying the session
The indicator does not generate trade signals, determine market direction, or execute orders.
Its purpose is to provide consistent session timing and price-reference levels.
How to use it
Open the indicator settings and first choose your Anchor Timezone.
The default is:
Etc/UTC
All session times entered in the indicator are interpreted using this timezone.
For each session event, you can:
Enable or disable the event.
Enter the event time using HH:MM format.
For example:
00:00
07:00
08:00
13:30
Session times
The default configuration is:
Tokyo Open — 00:00
Tokyo Close — 09:00
Europe Open — 07:00
London Open — 08:00
New York Open — 13:30
New York Close — 21:00
These times are fully editable.
If your preferred session definition, broker convention, daylight-saving adjustment, or operating timezone is different, change the values in the settings.
Horizontal anchor price
The Horizontal Anchor Price setting determines which price is used when a session event occurs.
Event Open
Uses the chart bar's opening price when the session anchor is detected.
Event Close
Uses the chart bar's closing price.
The resulting level extends to the right as a reference for later price interaction.
Vertical session markers
Enable:
Show Vertical Session Timing Lines
to draw a vertical line at each enabled session event.
This provides a visual reference for when major trading sessions begin or end.
Horizontal session levels
Enable:
Show Horizontal Anchor Levels
to extend the selected event price across the chart.
These levels can be used to observe how price behaves relative to prior session participation points.
The indicator does not assign bullish or bearish meaning to those levels.
Labels
Enable:
Show Anchor Labels
to identify each session directly on the chart.
Labels include:
TOKYO OPEN
TOKYO CLOSE
EUROPE OPEN
LONDON OPEN
NY OPEN
NY CLOSE
Historical anchors
By default, Keep Historical Anchors is disabled.
When disabled, each session event keeps only its most recent anchor.
For example, when the next London Open occurs, the previous London Open anchor is removed and replaced with the new one.
Enable Keep Historical Anchors if you want previous session anchors to remain visible.
Be aware that keeping large amounts of historical session data can create substantially more chart objects.
Display controls
The indicator allows you to configure:
session colors
line width
horizontal levels
vertical timing markers
labels
historical anchors
Each major session can use its own color so different session events remain easy to distinguish.
Example workflow
A trader operating during the London and New York sessions might enable:
Europe Open
London Open
New York Open
while disabling session events they do not use.
The chart will then maintain timing and price anchors for those specific events.
This makes it easier to observe whether price is trading:
above or below a session-opening reference
back through a prior session level
around the transition between trading sessions
The interpretation remains entirely with the trader.
Timeframe note
Coasyn Session Anchor is designed primarily for intraday charts.
The precision of an anchor depends on the chart timeframe.
On lower intraday timeframes, the bar containing the configured session time will generally provide a more precise representation of that event.
On larger chart intervals, one candle may span multiple session events, so the event price should be treated as a broader reference rather than an exact tick-level session price.
Important
Coasyn Session Anchor is an informational charting tool only.
It does not provide:
buy or sell signals
trade entries
targets
stop placement
position sizing
automated execution
directional recommendations
It provides time and price anchors around the session events selected by the user.
Built by Coasyn Market Systems. Penunjuk

Multi Cycle Session Boxes
Multi Cycle Session Boxes is an overlay tool that frames freely defined time windows with a box that grows with the price inside it.
It is built for anyone who keeps drawing the same rectangle over the same hours — a trading session, the run-up to a weekly close, a month, a season — and would rather have that window marked on every repetition without touching the chart again.
The principle is a plain comparison: each session holds a start point and an end point, and while the current bar falls between them the box tracks the highest high and the lowest low reached since the window opened.
There is no indicator arithmetic behind this; the entire calculation is calendar arithmetic carried out in a timezone of your choosing, which is what allows the same window to repeat on a daily, weekly, monthly or yearly cycle.
Seven such sessions run independently of one another, each with its own cycle, its own window and its own colors.
Timezone
Timezone: the timezone all seven sessions are evaluated in; Exchange follows the timezone of the symbol itself.
SESSION 1 (present seven times, SESSION 1–SESSION 7, each instance identically structured)
Show boxes: switches the session on or off.
Repeat: the cycle the window repeats on — Daily, Weekly, Monthly or Yearly.
It also decides which of the time fields below are evaluated.
Session 1 Time (Start:End)
Month: first and last month of the window, evaluated in Yearly only.
Day: first and last day of the window, evaluated in Weekly, Monthly and Yearly. In Weekly the day is counted from 1 for Monday to 7 for Sunday, otherwise it is the day of the month.
Hour: first and last hour of the window.
Minute: first and last minute of the window.
Session 1 Graphic
Fill: color of the box area.
Border: switches the border on or off, and sets its color and its width.
A box opens on the first bar that falls inside the window and is redrawn with every bar that follows: its upper edge sits at the highest high reached since the window opened, its lower edge at the lowest low, and its right edge moves along with the last bar still inside.
Once the window closes the box stays where it is, so what builds up on the chart is a record of what each repetition of that window actually contained.
Every session keeps its last seventy boxes and removes the oldest as new ones open, which keeps all seven of them together within what the platform allows a single script to draw.
The end of a window is exclusive: a window ending at 15:30 contains the bar before it, not the 15:30 bar itself.
A window whose end lies before its start is not discarded but crosses the boundary of its cycle instead, which is how an overnight session from 22:00 to 06:00 remains a single box.
If start and end are set to the same point, the window is open at all times and each box then spans one full cycle before the next one begins.
In Weekly the two day fields count only up to seven, and higher values are read as Sunday.
In Monthly and Yearly a day the calendar month does not have is never reached: an out-of-range start skips that repetition altogether, an out-of-range end carries the box through to the end of the month.
One point worth knowing before the first attempt: a window can only be resolved as precisely as the chart's timeframe permits.
A window from 12:00 to 15:30 needs bars that fall inside those hours — on a daily chart no bar begins at 12:00, so nothing is drawn there.
This indicator is intended solely for market analysis and does not constitute investment advice or a guarantee of success.
Use it at your own discretion and risk; past results are not indicative of future performance.
Penunjuk

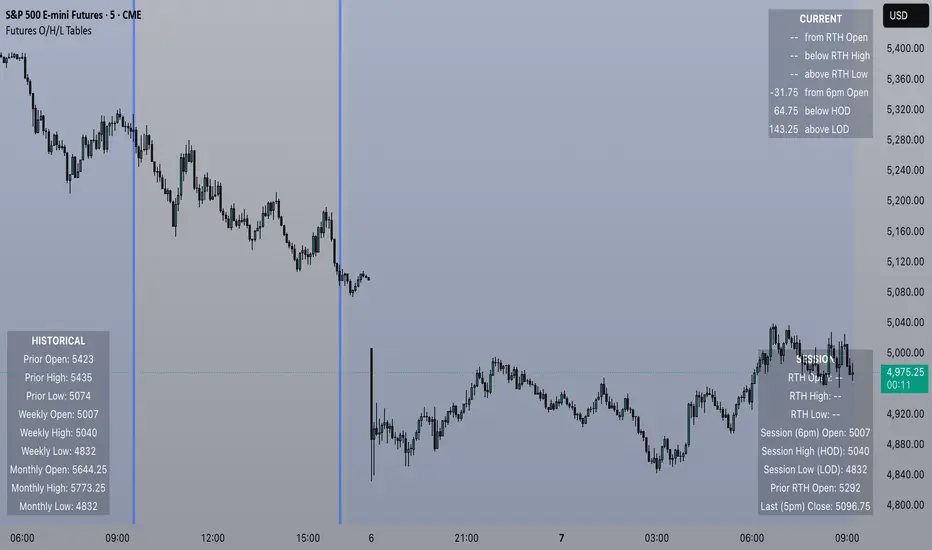
Market Mood | Session RangeMarket Mood | Session Range helps traders understand how much a market has moved during each trading session, how that movement compares with previous sessions, and whether today’s range is expanding faster or slower than usual.
The indicator combines session boxes with a compact dashboard covering Frankfurt, London, New York, Sydney, and Tokyo. Each session is calculated independently, including when sessions overlap.
The dashboard presents four core readings:
• MOVE SO FAR — The distance between the highest and lowest prices recorded since the session opened. This measures the session’s range so far, rather than the net change from its opening price or the total distance traveled by price.
• AVG. MOVE — The average range of previous completed sessions of the same type. London is compared with previous London sessions, New York with previous New York sessions, and so on. The default averaging period is 20 completed sessions and can be adjusted.
• AVG. USED — The current session’s movement divided by its historical average, expressed as a percentage. For example, a current movement of 15 pips against an average of 30 pips produces a reading of 50%. Readings above 100% mean the session has exceeded its average range.
• TODAY’S ACTIVITY — A comparison with historical movement at the same elapsed time within the session. This adds time context to the current range.
For example, suppose London has moved 20 pips after its first hour, while previous London sessions averaged 12 pips at that same point. Today’s movement is approximately 167% of the usual first-hour movement.
The activity column classifies this comparison as:
• Slower — Below 80% of the usual movement at that time.
• Usual — Between 80% and 120%, inclusive.
• Faster — Above 120% of the usual movement at that time.
These thresholds are configurable. They describe relative range expansion; they are not probabilities, trend signals, or measures of trading profitability.
Activity assessment starts after 15 minutes by default and updates on confirmed candle closes. “Starting” appears during the initial waiting period. “Learning” appears when there are not enough historical observations at the matching elapsed time. The comparison requires five completed sessions, or the selected averaging period if it is shorter than five. Hovering over an activity value reveals the supporting comparison.
Movement units adapt to the instrument:
• Forex pairs use pips, with an optional custom pip-size setting.
• Non-forex instruments, including metals, indices, energy markets, and cryptocurrencies, use percentages.
For non-forex instruments, session movement is calculated as:
Session Movement (%) = (Session High − Session Low) ÷ Session Opening Price × 100
Each historical session is measured against its own opening price before the percentage average is calculated. A 0.50% movement against a historical average of 1.00% therefore represents 50% of the average used.
Session schedules are configurable in each city’s local time. Location-based timezones automatically account for daylight-saving changes where applicable. The clock display timezone can be set separately.
Display settings include session colors, boxes, opening lines, historical drawings, text size, and dashboard position. The default dashboard shows active sessions. Detailed view also includes closed sessions and their available averages. Hiding a session’s chart drawings does not disable its calculations.
Optional alerts notify users when a session reaches 80%, 100%, or 120% of its average range. Each enabled threshold triggers once per session, on a confirmed candle close. If several thresholds are reached on the same candle, they can appear together in the alert.
The indicator uses completed sessions for historical averages and excludes incomplete sessions from those averages. The current session’s reference average remains fixed throughout that session. Available chart history determines how many past sessions can be included.
Use standard time-based candles from 1 to 60 minutes, with candle boundaries aligned to the configured session times. Missing bars or misaligned boundaries can cause a session to be marked as partial. The optional live-update mode allows movement readings to change during the forming candle; activity assessments and alerts remain close-confirmed.
Market Mood | Session Range provides context for session movement. An average is not a maximum: exceeding 100% does not imply that price must stop or reverse. Faster activity also does not indicate whether price will rise or fall.
Penunjuk

Penunjuk

Opening Range Breakout [ITA]🟠 OVERVIEW
Opening Range Breakout marks the high and low of the first minutes of the trading session, extends those boundaries forward, and flags the bar where price closes outside them. The range is built live as the session opens, tracking its running high and low, then locks once the opening period ends.
Once the range is set, the indicator measures its height and projects extension targets above and below it. Four range lengths are available, and the session open time and timezone are configurable so the tool works on any market rather than being fixed to a single exchange.
🟠 CONCEPTS
* Opening Range - The high and low established during the first minutes of the session. Represents the initial boundaries of agreement between buyers and sellers before the day develops.
* Range Lock - The moment the opening period ends and the boundaries stop updating. From that bar onward the levels extend forward unchanged.
* Extension Target - A projected level placed at a multiple of the range height above the range high or below the range low. Acts as a measured move reference rather than a prediction.
* Qualified Breakout - The first close outside the range in a given direction. Each direction is tracked independently and marked only once, so a session that breaks up, reverses and then breaks down shows both events without repeating either.
* Session Anchoring - The range window is evaluated in the selected timezone rather than the chart timezone, keeping it aligned to the actual market open regardless of the user's location.
🟠 FEATURES
* Selectable Range Length - Choose between 5, 15, 30 or 60 minute opening ranges.
* Live Range Building - The box tracks the running high and low as the opening period develops, then locks when it closes.
* Extension Targets - Projects two configurable multiples of the range height in both directions.
* Breakout Marking - Labels the first close outside the range in each direction.
* Breakout Alerts - Fires on upside and downside breaks independently.
🟠 HOW TO USE
* Match the range length to the instrument. Shorter ranges suit fast-moving markets and scalping, longer ranges suit index futures and higher-priced equities where the first minutes tend to be noisy.
* Set the session open time and timezone to your market. The default is 09:30 New York.
* Use the range boundaries as the reference for the session. Price holding inside them points to rotation, while a decisive close outside tends to set the tone for the rest of the day.
* Read the extension targets as measured moves. A tight opening range produces close targets, while a wide one produces targets that may take the full session to reach, which is itself useful when sizing expectations.
* Adjust Days to Display to keep the chart clean when reviewing several sessions of history.
🟠 CONCLUSION
Opening Range Breakout combines automatic range detection, forward-extending boundaries, and range-based extension targets in a single tool. It removes the manual work of marking the opening range each session while keeping the framework configurable enough to apply across different markets and session times. Penunjuk

Global Cash Market Open Close Handoff SequenceGlobal Cash Market Open Close Handoff Sequence is a schedule-state transition study for configurable cash-market reference hours.
The vertical line is only the presentation layer. At each unique boundary timestamp, the script generates and consolidates scheduled OPEN, BREAK, RESUME, and CLOSE events, evaluates the configured active-market state immediately before and after that timestamp, and classifies how the tracked market schedule changes.
Instead of displaying every market event as an unrelated line, the script treats the enabled markets as one chronological system. It shows how that system activates, gains overlap, changes market identity, releases overlap, and deactivates through the trading day.
The classification engine uses schedule state only. It does not use price direction, session highs or lows, volume, volatility, external symbols, higher-timeframe data, or future price assumptions.
Core transition model
Every consolidated boundary is assigned one of the following descriptive roles:
- ACTIVATE: No configured market is active before the boundary, and one or more markets are active after it.
- OVERLAP +: The number of configured active markets increases across the boundary.
- HANDOFF: The active-market count remains unchanged, but the composition of the active-market set changes.
- OVERLAP -: The number of configured active markets decreases, while at least one tracked market remains active.
- DEACTIVATE: One or more configured markets are active before the boundary, and none are active after it.
- INTERNAL: A scheduled boundary occurs, but the configured active-market set does not materially change.
HANDOFF is intentionally separate from a normal open, close, or overlap count.
For example, if one market closes while another market opens or resumes at the same timestamp, the number of active markets can remain unchanged even though the identity of the active markets changes. The script detects that composition change and classifies it as a HANDOFF rather than treating the two events as unrelated markers.
Simultaneous-event consolidation
Events that share the same absolute timestamp are merged before they are drawn.
If two or more configured markets open, close, break, or resume at the same time, the script creates one structural boundary instead of stacking multiple vertical lines and overlapping labels at the same chart position.
The merged label lists the events that occurred at that timestamp. The transition role is then calculated from the complete configured state before and after the consolidated boundary.
This makes simultaneous events readable while preserving their individual market identities.
Split-session handling
Each market can contain one or two independently editable trading segments.
When two enabled segments are separated, the script models the market day as:
OPEN
BREAK
RESUME
CLOSE
When the two segments touch or overlap, they are automatically treated as one continuous interval:
OPEN
CLOSE
This allows split cash-market schedules, such as morning and afternoon continuous-trading periods, to be represented without creating a false break when the configured intervals are actually continuous.
Default reference schedules
The default configuration contains six editable cash-market reference schedules:
- Sydney Cash
10:00-16:00
Australia/Sydney
- Tokyo Cash
09:00-11:30 and 12:30-15:30
Asia/Tokyo
- Hong Kong Cash
09:30-12:00 and 13:00-16:00
Asia/Hong_Kong
- Xetra Main Cash
09:00-17:30
Europe/Berlin
- London Cash
08:00-16:30
Europe/London
- New York Cash
09:30-16:00
America/New_York
The default weekday setting is Monday through Friday.
Every market can be enabled or disabled independently. The displayed name, short code, IANA time zone, weekdays, first segment, optional second segment, and color are all editable.
The defaults are reference schedules rather than locked assumptions. Users can adjust them for another market, venue, research convention, or historical schedule.
Time-zone and DST handling
Each market uses its own IANA time-zone identifier.
This allows regional daylight-saving changes to be applied independently. Sydney, London, Xetra, and New York do not rely on one fixed UTC offset, and Asian markets can remain on their configured local schedules.
The chart time zone does not define the market calculations. Market boundaries are generated from each market's configured IANA time zone and placed on the chart using absolute timestamps.
The Boundary Strip has a separate readout time-zone input. Changing that input changes the displayed date and time in the panel without changing the underlying boundary timestamps.
Historical research modes
Visible range is the default research mode.
In this mode, the script rebuilds its boundary sequence around the section of the chart currently being studied. Panning or zooming the chart can therefore change the processed time window and the subset of boundaries retained for display.
The right visible bar acts as the effective anchor. This makes it possible to move to a historical period and inspect the market schedule, active-market state, previous boundary, next boundary, and handoff sequence for that period rather than only for the latest bar.
A configurable visible-span cap prevents an extremely wide chart range from creating an unnecessarily large calculation window. If the displayed range exceeds the cap, the script processes the most recent permitted portion ending at the right visible bar.
Recent days is available as an alternative mode.
Its anchor can follow:
- The right visible bar
- The latest chart bar
- The real clock
This allows the same engine to support historical inspection, dataset-relative inspection, or a clock-relative schedule view.
Future schedule projection
The script can project recurring configured boundaries beyond the effective anchor.
These projected objects represent repetitions of the selected reference schedule. They are not price forecasts, volatility forecasts, liquidity predictions, or claims that an exchange will operate normally on the projected date.
Future projection can be disabled or limited through the settings. The immediate next boundary can be emphasized with a separate color and width so that it remains identifiable without turning every future boundary into a dominant chart object.
Adaptive spread
A complete multi-market schedule can generate many boundaries across a long visible range. Drawing all of them at once would reduce the readability of both the indicator and the underlying price chart.
Adaptive spread is therefore the default line-retention mode.
When the generated boundary count exceeds the selected visual budget, Adaptive spread distributes a capped subset of already generated and classified boundaries across the displayed research span. It attempts to preserve structural variety across the global market sequence and retains the immediate next boundary when one is available.
Adaptive spread changes presentation only.
It does not change:
- The configured market schedules
- The generated event timestamps
- Simultaneous-event consolidation
- The active-market state
- The transition classification
- The Last and Next calculations
The default visible line budget is seven, providing a sparse publication-ready view while leaving price visible.
Users who need a denser local study can increase the line and label budgets or select Nearest anchor. Nearest anchor favors boundaries closest to the effective anchor rather than distributing them across the complete displayed span.
Boundary lines and labels
Lines are drawn behind the chart so that candles and price remain visually dominant.
Users can control:
- Historical and projected boundaries
- Visible line budget
- Line width
- Historical and future transparency
- Directional or uniform line styles
- Market-identity or transition-role colors
- Next-boundary emphasis
- Label visibility
- Label content
- Label placement
- Label lanes
- Minimum spacing
- Maximum label count
- Text size
- Text emphasis
- Label transparency
- Native local time in tooltips
Directional line style distinguishes single-event boundary types:
- OPEN and RESUME use a solid line
- BREAK uses a dotted line
- CLOSE uses a dashed line
- Consolidated multi-event timestamps use a solid structural line
Transition-role color mode emphasizes the change in the configured active-market state.
Market-identity color mode instead preserves the market color associated with the event. Consolidated timestamps can use a dedicated simultaneous-event color.
Labels can show:
- Transition role and event list
- Event list only
- Transition role only
Lane allocation and minimum time spacing reduce label collisions without moving the actual boundary timestamp.
Boundary Strip
The fixed Boundary Strip summarizes the effective research state.
It displays:
- ANCHOR: The timestamp at which the current state is evaluated
- ACTIVE: The configured markets active at the anchor and their count
- LAST: The most recent generated boundary at or before the anchor
- NEXT: The first generated boundary after the anchor
- COUNTDOWN: The time remaining from the anchor to the next boundary
- VIEW: The active schedule scope, retention mode, and any display-cap status
The Active row refers to the effective anchor shown in the panel. Under the default configuration, this is the right visible bar and is not necessarily the current real-world time.
The panel defaults to the lower-left area and includes adjustable bottom clearance to avoid permanent chart furniture. It can also be moved to another left or right chart position, and its text size and emphasis can be changed.
Suggested use
1. Add the indicator to an intraday chart.
2. Begin with the default settings so that the published chart and the user's first view remain consistent.
3. Read the transition role first to understand whether the configured market system is activating, gaining overlap, handing off, releasing overlap, or deactivating.
4. Read the event line below the role to identify the market-specific OPEN, BREAK, RESUME, or CLOSE events that produced that transition.
5. Use the Boundary Strip to confirm the effective anchor, active markets, previous boundary, next boundary, and remaining time.
6. Pan to an earlier period when studying historical market transitions. Visible range mode will rebuild around the displayed chart section.
7. Increase the visual budgets or switch to Nearest anchor only when a more detailed local sequence is required.
8. Edit market schedules, time zones, weekdays, and segments when researching another venue or schedule convention.
This indicator can be placed on any intraday symbol. However, its boundaries remain the configured cash-market references and do not automatically become the native trading session of the charted instrument.
Why this is a separate study
This script is not a continuous session highlighter.
A conventional session highlighter answers:
"Which session interval contains this bar?"
This script instead answers:
"What scheduled events occurred at this timestamp, and how did the configured active-market state change across that boundary?"
It intentionally does not draw session backgrounds, session boxes, opening ranges, session highs or lows, price levels, volume statistics, volatility measures, directional bias, entry signals, exit signals, targets, or strategy results.
It is also different from a generic recurring time marker.
A generic time marker places independent objects at selected times. This script constructs linked market schedules, models separated trading segments, consolidates simultaneous events, evaluates the configured state immediately before and after every unique timestamp, classifies the resulting transition, and presents the result as a chronological handoff sequence.
The focus is deliberately narrow: scheduled cash-market boundary structure and active-market identity changes.
Limitations and interpretation
This is a configurable reference-schedule study, not a live exchange-status service or an official exchange calendar.
The script does not automatically model:
- Exchange holidays
- Early closes
- Delayed openings
- Unscheduled closures
- Security-specific halts
- Historical changes to exchange schedules
- Opening or closing auction phases
- Instrument-specific pre-market or post-market sessions
The Sydney 10:00 and 16:00 defaults are rounded regular-market reference boundaries. Security-level opening sequencing and the later closing auction are outside the model.
The Hong Kong defaults represent the morning and afternoon continuous-trading intervals ending at 16:00. The subsequent closing auction is outside the model.
The remaining schedules likewise represent editable main cash-session references rather than every auction, extended-hours period, or product-specific rule.
Users should verify and edit the reference hours when exact exchange-calendar treatment is required.
Market codes should remain unique. The HANDOFF comparison uses the configured active-market codes to identify changes in composition. Assigning the same code to different enabled markets can make an identity change ambiguous.
The script requires an intraday chart. On a daily or higher timeframe, the Boundary Strip reports that an intraday timeframe is required.
Projected boundaries are recurring schedule references only. They do not predict price direction or confirm that a market will open on a holiday or exceptional date.
ACTIVATE, OVERLAP +, HANDOFF, OVERLAP -, DEACTIVATE, and INTERNAL are descriptive schedule classifications. They are not buy signals, sell signals, entry instructions, exit instructions, or assessments of future market behavior.
The script does not contain strategy orders, backtesting logic, performance statistics, or alert conditions.
The source code is published openly so users can inspect, verify, study, and modify the schedule and visualization logic. Penunjuk

Candle Club - Session LevelsYesterday's high, the overnight range and today's open, drawn where they formed and kept on the chart so you can see what price did there.
WHAT IT DRAWS
Prior day high, low and close; overnight high and low; the cash-session open; an optional prior-day midline and round-number reference lines; and shelf zones, shaded pockets where recent session highs and lows cluster. Each day's lines start when that level becomes known and stop when the next one replaces it, so history stays readable.
THE IDEA
A session extreme is a place the market reached and turned away from; the overnight range is the path it took while the cash session was shut. Many traders watch these places, and this tool's only job is to put them on your chart where you can see them. It makes no claim about what price does when it returns there; what you do at a level is your call.
WHAT IS ORIGINAL
Shelf zones. The script banks each completed session's high and low, sorts the last few days of them, and groups any within your chosen width of each other. Two or more in one pocket become a box starting where its oldest member formed. One extreme is a number; a cluster is a shelf the market has revisited.
HOW TO USE
Set the cash session and timezone for your market (default: US index futures and stocks) and how many days to keep. Read it top down: the table lists every level and how far it sits from the last price, so you can see at a glance what is above and below you. Shaded boxes are shelf zones - the more session extremes stacked in one, the more times the market has stopped in that pocket. Set one alert per level, or the "any level" alert, to be told when price crosses one instead of watching. Best on 1-minute to 15-minute charts; it draws nothing on daily and above.
SETTINGS
One group per family: prior day, overnight, open, shelf zones, round lines, each with an on/off switch and colour on one row, then width and style. Neutral lines follow your chart theme. Prior day can use the exchange's daily bar or the previous cash session only.
LIMITATIONS
Intraday charts only. On stocks the overnight means the pre- and post-market bars on your chart, so extended hours must be on. The cash-session option needs one completed session first. Overnight here means everything outside the cash session you set, so if you also run a tool that starts its overnight at a fixed hour the two will not always draw the same line. The round-number lines are an evenly spaced grid, off by default. They are drawn for reference only and nothing here claims price behaves differently at them.
A standalone drawing tool with no buy or sell signals. Penunjuk

Level survival trackerEveryone trades PDH. Almost nobody knows their own numbers on it.
Description
Tracks six session reference levels every day: prior day high, prior day low, overnight high, overnight low, opening range high, opening range low. For each, over a rolling window of sessions, it reports the probability the level gets tested, the probability it breaks given a test, how failure probability changes with repeated tests, and the median rejection distance and time from first touch to break.
How it calculates
Prior day levels come from the last completed exchange daily bar via the documented non-repainting request idiom, or optionally from the previous custom chart session. Overnight high and low accumulate outside the session and freeze at the open; the opening range freezes when its window completes, and the bars that built it cannot also test it. A touch is a bar overlapping the level within a tolerance frozen at the session open, counted in episodes. A break is a confirmed close beyond the level plus tolerance, after a touch. A session whose open is already beyond a level, or where price closed through it without any bar ever overlapping it, is recorded as opened-beyond and excluded from every rate, because that level was never fairly testable. Completed sessions are written once, after the session ends.
The tolerance can be defined in ticks, points, a fraction of prior daily ATR, or a fraction of chart ATR. Statistics can be conditioned on the session's opening gap against the prior daily range, or on prior daily volatility versus its own 20-day mean. The break rate can display a 95% Wilson interval so the uncertainty is visible next to the point estimate. Break rates and touch-failure rates require their own minimum number of actual tests before anything is shown.
How to read it
Today's column shows each level's live state: untested, testing with its touch count, broke with the touch it broke on and the time, or opened beyond. P(test) is tests over eligible sessions. P(break | test) is breaks over actual tests, with the interval underneath if enabled. Touch failure answers: of past sessions that reached this many touches on this level, how often did the level eventually break. Reaction and time are the median rejection distance in points and the median minutes from first touch to confirmed break. Every figure carries its sample size, and figures below the minimums show the count instead of a percentage.
Repainting
Closed bars do not repaint. Touches and breaks are decided on confirmed bars only, and a session's outcomes enter history only after the session completes.
Originality and attribution
The levels are common knowledge. What is original is the survival accounting: episode-counted touches, conditional failure by touch number, opened-beyond exclusion, frozen per-session tolerance, regime conditioning, and interval-honest break rates with sample sizes shown. This is not derived from and does not reuse code from any existing published script.
Honest limitations
These are empirical frequencies, not forecasts or trade signals.
Intrabar path is unknowable from OHLC bars. A same-bar touch and break records as a first-touch break with zero measured rejection.
Overnight rows need extended-hours bars on the chart.
The session must not cross midnight in the chosen time zone.
Previous-RTH prior levels need one completed chart session to warm.
The chart timeframe must divide the session start and length exactly, so bars align to the session boundaries. For a 09:30 to 16:00 session that is 1, 2, 3, 5, 6, 10, 15, or 30 minutes. This is not a fixed ceiling: it follows your session. A session starting on the hour, such as 09:00 to 16:00 or 08:00 to 17:00, also accepts 20 and 60 minutes. Misaligned timeframes are refused rather than measured against fuzzy session boundaries, because a bar straddling the open would corrupt the opened-beyond classification, which reads the session-open price.
The opening range is rounded up to a whole number of chart bars, so no bar can straddle its boundary. On a 2-minute chart a 15-minute range becomes 16. The effective value is in the table header tooltip.
Results depend on instrument, session, tolerance, timeframe, and sample. Change any one and the numbers change. Penunjuk

Session Open LineA price overlay for TradingView (Pine Script v6). A horizontal line at the session's reference level - the previous session's close by default, or the session open - drawn from the first to the last bar of that session, with a label carrying the price change during the session (close vs the reference) - as a percent, as a difference in the instrument currency, or both. Alerts fire when the price crosses the line, and the reference level plus the session change are exposed as hidden series for other scripts.
█ 🧠 WHAT IT SHOWS
For every trading session the script anchors a line at the session's reference level and stretches it to the right as the session progresses:
price
│ ╭─╮
│ reference level │ │ ╭╮ ← price above the reference
│ ╭╮ ╭╮ ╰─╯ ││
│ ══╪╪═══════════════════╪╪═══════╪╪══ ─►
│ ╰╯ ╭╮ ╭╮ ╰╯ ╰╯
│ ╰╯ ╰╯ ← price below the reference
│
│ ├──────── one session ────────┤├── next session ──
└────────────────────────────────────────────── time
The line sits at the reference level - the previous session's close (default) or the session open - and never moves vertically.
Its right end follows the current bar until the session ends.
The color of the line depends on the sign of the change : up color when close >= reference level , down color otherwise. It is re-evaluated on every bar, so a session that flips from green to red repaints the whole line.
The whole session is shaded in the same up/down color (on by default, can be turned off).
Reference level
Previous session close (default) - the close of the last bar of the prior session. The change matches the day change quoted against the previous close (the way most quote screens report it), and an opening gap shows up as the distance between the line and the session's first candle.
Session open - the open of the first bar of the session. The change measures only what happened inside the session; there is never a gap between the line and the first candle.
Session detection
A new session is detected with timeframe.change('D') - the trading day boundary as TradingView defines it for the symbol. That is deliberately not "midnight": it follows the instrument's own session definition, so futures sessions that cross midnight are handled correctly (the line starts at the session boundary, not at 00:00).
Why a box, not bgcolor()
The session highlight is drawn as one box per session rather than bgcolor() . bgcolor() paints a single bar and cannot be repainted afterwards, so a session that flips sign would end up striped. A box spans the whole session and keeps a single color that is corrected on every bar. Box extend only works on the time axis, so the vertical coverage comes from the box bounds: the highest high and lowest low of the loaded data, padded by 100x that range above and below. On the last bar every box is brought to the final bounds, so sessions drawn while less data was loaded get the same coverage.
Why not simply 1e17 / -1e17 : TradingView silently skips boxes whose bounds lie extremely far from the price scale (on an instrument near 85, bounds of +-1e8 still draw while +-1e9 do not). Such boxes exist - they show up in the object tree - but never render, so the highlight looks like it is not working at all.
█ 🏷️ THE CHANGE LABEL
The label is colored by the sign of the change and sits on a fully transparent background. Two checkboxes decide what it carries:
Show percent change (default on) - the change as a percent of the reference level, formatted as +0.84% / -1.12% (always signed, two decimals).
Show change in instrument currency (default off) - the change as a price difference ( close - reference level ), formatted with the symbol's tick precision ( format.mintick ) and suffixed with syminfo.currency , e.g. +12.50 USD . For symbols without a quote currency the suffix is omitted.
With both on the label reads +0.84% (+12.50 USD) ; with both off no label is drawn at all - only the line (and the optional highlight) remains. For a reference level at or below zero (possible on futures spreads) the percent is undefined - the label falls back to the price difference, and the up/down color always follows the sign of the difference, which stays meaningful at any price.
Percent position decides where it sits, and the choice applies the same way to completed sessions and to the ongoing one:
Behind the line (default) - anchored on its left edge ( label.style_label_left ), at the reference level, right of the line end, as if continuing the line.
Above the line - anchored at its bottom-right corner ( label.style_label_lower_right ), so the text sits over the end of the line and does not stick out past the session end.
Below the line - anchored at its top-right corner ( label.style_label_upper_right ), so the text hangs under the end of the line, again inside the session.
During the ongoing session the label follows the end of the line and updates on every bar; once the session ends it stays at the last bar with the final value.
█ 🛠️ KEY PARAMETERS
General
Reference level (default Previous session close) - Previous session close / Session open, described above.
Show percent change (default on) - percent of the reference level in the label.
Show change in instrument currency (default off) - price difference in the instrument currency in the label.
Appearance
Up color (default #26A69A ) - line and label color when the session is up.
Down color (default #EF5350 ) - line and label color when the session is down.
Line style (default Solid) - Solid / Dashed / Dotted.
Line width (default 1) - range 1 - 4 .
Text size (default Small) - Auto / Tiny / Small / Normal / Large.
Percent position (default Behind the line) - Above the line / Below the line / Behind the line, described above.
Session highlight
Highlight the whole session (default on) - fills the entire session with a single color, decided by where the price stands against the reference level.
Highlight up color (default #26A69A at 90% transparency) .
Highlight down color (default #EF5350 at 90% transparency) .
█ 📈 HOW TO READ IT
The line is a reference level, not a signal. Trading above it means buyers have controlled the day so far; below it, sellers have.
Reclaims and rejections at the line are the interesting part - price returning to the level and being pushed away often marks who is defending the day.
With the previous-session-close reference (default) the line doubles as the gap-fill level : a session that opens with a gap and later crosses the line has closed that gap.
The label value gives an instant sense of the session's magnitude without measuring anything by hand, and the sign color makes a flip visible at a glance. The percent is comparable across instruments; the currency difference maps directly to points or ticks on the symbol you trade.
With the session highlight on , a screen full of alternating green and red blocks makes runs of consecutive up or down sessions obvious.
█ 🔔 ALERTS
Cross above the reference level - the price crossed the current session's line from below.
Cross below the reference level - the price crossed the current session's line from above.
Those are exactly the reclaim/rejection moments described above (with the default reference: the gap-fill / day-flip moments). The first bar of a session - where the line jumps to the new reference - never fires either alert. Crosses are evaluated on close , so on the live candle a cross can appear and un-cross before the candle closes; set the alert trigger to Once Per Bar Close if you only want confirmed crosses.
█ 📤 HIDDEN SERIES
The script exposes two hidden series, visible in the Data Window and usable as an external source in other indicators and strategies (any input.source field):
Reference level - the level the line sits at: the previous session's close (default) or the session open.
Session change % - the session change as a percent of the reference level.
█ ⛔ LIMITATIONS
Intraday timeframes only. On D and above every bar is its own session, so the script draws nothing and instead shows a hint table in the top-right corner: Session Open Line: the indicator works on intraday timeframes .
Drawing objects are capped at 500 lines, 500 labels, and 500 boxes - older sessions drop off the left side of the chart.
Both values are computed from close against the reference level, so during the ongoing session they move with every tick and only become final at the session close.
The first session in the loaded history starts at the first loaded bar, which is not necessarily the true session start. With the default reference (previous session close) it has no prior close at all, so it draws nothing; with the session-open reference its "open" (and therefore its change) can be off. Every later session is exact.
© Piotr Kowalski "piecioshka". License: Mozilla Public License 2.0. Penunjuk

Session block profileEvery part of the trading day has a personality. See yours in one table.
Description
Splits the trading session into fixed-length blocks and, for each block, keeps a rolling history of what that part of the day has done over the last N sessions. Three descriptive measures per block: how large its range tends to be relative to the average block, how much volume it tends to carry relative to the average block, and how directional it tends to be, measured as the average of the block's body over its range.
How it calculates
Each bar is assigned to a block from its minute of the day in the chosen time zone. A block's high, low, open, close, and volume accumulate on confirmed bars. When the first confirmed bar of a different block or a different day arrives, the completed block is written into its rolling history and that block's means are recomputed once. Range and volume indices are each block's mean divided by the average across all blocks with enough history, so 1.00 is an average block. Body ratio is the mean of |close - open| divided by (high - low) for the block, so 0 is a doji and 1 is a full-body bar.
How to read it
Range and volume shade toward green as they rise above the average block. Body shades toward amber as blocks become more directional. The current block's label is amber. Alternate blocks can be shaded on the chart so the grid is visible against price. This is a description of what each part of the day has tended to do. It is not a forecast.
Repainting
Closed blocks do not repaint. History is written only when a block completes. The current block is marked but its partial values are not shown as a statistic.
Originality and attribution
Session statistics by time of day are a familiar idea. What is original here is the block-keyed rolling history with cached per-block means, the three-measure normalization against the session's own average block, and the heat-table presentation. This is not derived from and does not reuse code from any existing published script.
Honest limitations
The session must start and end on the same calendar day in the chosen time zone. Sessions that cross midnight are not supported.
A partial first day in chart history contributes a partial block. The minimum-sessions setting exists to absorb that.
Half days, holidays, and early closes pollute a block's history for as many sessions as the lookback.
Range and volume are relative to the average block within this session window, so the indices are only comparable inside one configuration.
Body ratio is not a trend measure. A block can have a high body ratio and still be a small, meaningless move.
Nothing here is a signal. A high-range block is not a direction. Penunjuk

Time-of-day volume normalizerHigh volume at 9:31 is not high volume. See each bar against its own time of day.
Description
Raw volume is not comparable across the trading day. The first minutes of the regular session routinely print several times the volume of a midday bar, so reading "high volume" off the raw histogram usually just tells you that it is early in the session. Most relative volume tools compare a bar against a trailing average of the last N bars regardless of clock time, which carries the same problem forward.
This compares each bar's volume only against the same clock time on prior sessions, and returns the result as a z-score.
How it calculates
Every bar is assigned to a time slot from its minute of the day, in the time zone you choose, and the chart timeframe. Each slot keeps an independent rolling history of volume, one observation per prior session. For the current bar the script reads that slot's cached center and spread and returns how far current volume sits from the center in spread units. The cache is refreshed only when the slot receives a new observation, so the current bar is never part of its own baseline. Median with median absolute deviation, scaled by 1.4826, is the default. Mean with population standard deviation is the alternative.
How to read it
A reading of 0 means this bar is doing what this time of day normally does. A reading of +2 means it is two spread units above its own slot's history. Green marks readings above the norm, amber marks unusually high, and a lighter grey marks unusually quiet. The pane shades faintly while a slot is still warming or has no spread. The table shows the current slot, its warmup state, its norm, and the current reading.
Repainting
Closed bars do not repaint. The live bar updates until it closes. History is written on confirmed bars only.
Originality and attribution
The z-score is textbook. What is original here is the slot-keyed baseline: one independent rolling history per minute-of-day bucket, with the current bar excluded from its own baseline, and per-slot statistics cached and recomputed only when that slot's history changes. This is not derived from and does not reuse code from any existing published script.
Honest limitations
Nothing plots until a slot reaches the minimum sample count. The table reports warmup progress.
If a slot's stored volumes are near-identical the spread collapses to zero and no z-score is defined. The table reports this as flat.
Half days, holidays, and session changes pollute a slot's history.
Futures roll and contract changes shift volume levels.
Slots and the session filter both key to the time zone you choose.
Requires an intraday timeframe of 1 minute or higher and a symbol that reports volume.
This is not a signal, it says nothing about direction, and a high reading is not inherently bullish or bearish. Penunjuk

ICT Kill Zones and Session High LowICT Kill Zones and Session High Low
What it does
This indicator draws the intraday sessions as boxes with their high and low, marks the three daily opening levels, and reports which time state the chart is currently in. Its point is not the feature list, which you can find elsewhere; its point is being right at the edges. Everything is anchored to New York wall-clock time, so the sessions keep their place through every daylight-saving changeover, including the weeks when the United States and Europe have not both switched yet. On those weeks the panel says so.
How it works
Every window is resolved through the named time zone America/New York rather than a fixed offset, the chart time zone or your local time. That single choice is what makes the boxes sit correctly in March and October, and it is the reason a session cannot drift by an hour without anyone noticing.
A session starts on the first bar that falls inside its window, not on a bar whose clock reads exactly the start time. On a 45 minute chart no bar lands on 07:00, and a script that waits for one draws nothing that day.
While a session runs, its box grows and its high and low move with it. That state is drawn with a dashed border, because a level that can still change must not look like one that cannot.
When the session ends, the high and low are fixed and never move again. The border turns solid and the two levels extend to the right.
The bar that ends a session can already trade through what that session just fixed, so both things are allowed to happen on the same bar. A level that was taken immediately is never shown as untouched first.
A level is taken when price trades strictly beyond it, by wick or by close depending on the setting. A value exactly on the level is not a take, and each level changes state only once.
The New York to London offset is recalculated per trading day from the calendar itself. It is displayed, never applied: the sessions sit right because they are anchored to New York, not because anything is shifted.
Short trading days and holidays are read from the bars that exist, not from a stored calendar that would need maintenance and would eventually be wrong.
How to use it
Add the script to an intraday chart. Sessions cannot be resolved above 60 minutes, and on higher timeframes the script says so instead of drawing something misleading.
Read the dashed box as the session in progress and the solid one as finished. The two lines running to the right are the finished session's high and low.
Watch the panel in March and late October. When it reads 4h instead of 5h, the two regions are out of step and the London session sits an hour away from where it was the week before. The gap can last up to three weeks in spring and about a week in autumn, depending on the year.
If a day reads Early close or No RTH session, that day was short or closed. Both are recognised after the day is over, so the label refers to the last completed day.
Inputs
Sessions group - one row per session with a switch, its start and end time in New York wall-clock time, and its colour. London Close is off by default so the standard chart shows four boxes that do not overlap.
Session Levels group - show the fixed high and low, extend them to the right, and choose whether a wick or a close counts as taking them.
Time Markers group - Midnight Open, True Day Open and RTH Open, each switchable. The last two are hidden automatically where they have no meaning. Extend Markers Right lets the newest marker of each type run past the latest candle so its line and label stay visible in front of the price action; range 0-500, default 10. Older markers still end where the next marker of the same type begins.
Level Line Style and Marker Line Style - solid, dashed or dotted. The markers are dotted by default so they read as references rather than as structure.
Label Background - off by default, so only the label text shows. Turn it on where a label sits over the candles and the bare text is hard to read.
Days Retained - how many trading days stay drawn, the current one included. Range 1-10, default 2. Older days are deleted, not hidden. On futures the Sunday evening open counts as its own day, so on a Monday the default keeps Sunday and Monday rather than Friday and Monday.
Display group - session labels and where they sit: Above Box by default, Inside Box or Below Box, always centred on the width of the box. Plus text size in points, the time state panel and its corner.
Style group - how far the boxes fade for finished and running sessions, line widths, and one colour per time marker.
Alerts group - each of the four alert conditions can be switched off.
Signals and alerts
Session opened - fires on the first closed bar of a tracked session. Off by default, because the clock is not news.
Session closed - fires when a session has ended and its levels are fixed. Off by default for the same reason.
Session high taken and Session low taken - fire when price trades through a fixed level. On by default, because this is the one event of the four that is not predictable from a clock.
All four fire on the close of the bar that produced the change, and each level can only be taken once.
Repainting
Sessions start, end and levels are taken only on closed bars. A running session is the one thing that changes while it runs, and that is its purpose rather than a defect: its box grows with each bar and is drawn with a dashed border to say so. Once a session is finished its box and its two levels are fixed and are never rewritten, and the offset shown in the panel changes nothing that is already on the chart.
Limitations
A short trading day or a holiday is recognised only after the day is over, because it is read from the bars that exist rather than from a stored calendar. The panel therefore reports the last completed day. On futures that means a short Friday is reported during the Sunday evening session and is replaced once Monday begins.
Sessions need an intraday timeframe. Above 60 minutes the windows cannot be resolved and nothing is drawn.
On instruments without a regular trading session - spot forex, crypto and CFDs - the True Day Open and RTH Open markers are hidden because they are not defined there. The panel says so.
Only the most recent day's time markers carry a label. Older ones keep their line but would otherwise stack their labels on the same spot at the right edge.
A session with no bars inside its window produces nothing at all, which is correct but means an empty session leaves no trace to explain itself.
Days Retained set to 1 together with a window you moved across midnight keeps only the session that is still running. Its completed form is never shown, because the day it belongs to is already outside the retention. Raise Days Retained to 2 if you want to see it finished.
Only the bars of the chart timeframe are used. There is no higher timeframe layer, no intrabar data and no volume.
The script describes when things happened and whether a level was traded through. It does not compare sessions, rank them, or suggest entries, exits or targets.
This script is a charting tool for educational purposes. It does not provide financial advice and does not predict future price movement. Trading carries risk; decisions and their outcome remain yours. Penunjuk

VWAP Suite [vault]VWAP Suite
Most traders treat VWAP like a single line. This tool treats it the way Auction Market Theory treats it: as a developing value area with a center, an upper edge and a lower edge, tracked across every timeframe that matters, with the previous period frozen next to the current one so you always know where price sits relative to value.
Everything is inside one indicator. Session VWAPs from daily to yearly, standard deviation bands that form the value area, previous period levels, right side labels for every higher timeframe level, and rolling VWAPs over 7, 30, 90 and 365 days.
WHAT IT PLOTS
1. Session VWAPs (Daily, Weekly, Monthly, Quarterly, Yearly)
Each period has its own anchored VWAP that resets at the start of the period. The reset follows the exchange session of the symbol, not midnight UTC, so on CME futures a new daily VWAP starts at 18:00 New York, on OANDA gold at 17:00 New York, and so on. Weekly, monthly, quarterly and yearly resets follow the same logic.
You can enable any combination of these, each with its own color. By default the VWAP lines are drawn dotted so they do not compete visually with the bands and rolling lines. A "Dotted VWAP Lines" toggle switches them back to solid.
The lines break at the period change instead of drawing a vertical jump to the new starting level, so every session or week or month shows as its own clean block.
2. Standard Deviation Bands (Value Area)
Pick one period under "Anchored to Period" and the indicator draws its standard deviation bands around that VWAP:
- VWAP plus 1 SD = VAH (value area high)
- VWAP minus 1 SD = VAL (value area low)
- optional plus and minus 2 SD outer bands
The area between VAH and VAL is filled. Fill transparency is adjustable and defaults to a very subtle 95 so the band reads as a shadow behind price rather than a colored block.
The deviation is calculated with volume weighting from the same cumulative data as the VWAP itself, so VAH and VAL are the true volume weighted 1 SD edges of the developing value area. Bands also break at the period change.
3. Previous Period Levels
At the start of every new period the indicator freezes the VWAP and standard deviation of the period that just closed. Those frozen values are carried forward as flat lines through the current period:
- previous VWAP
- previous VAH and VAL (plus and minus 1 SD)
- optional previous plus and minus 2 SD
These are the levels that matter most from an Auction Market Theory point of view. Price opening inside the previous value area, above it, or below it tells you what kind of day or week you are likely dealing with. The previous value area can be filled as well, with a separate "Fill Prev Bands" toggle.
Each of the five periods keeps its own frozen values, so the previous weekly VAH is genuinely the VAH of last week, not of the last day.
4. HTF Labels (Weekly, Monthly, Quarterly, Yearly)
This is the part that keeps the chart clean. Instead of plotting eight or ten extra lines you get labels on the right side of the chart for the higher timeframe levels:
- current VWAP, VAH, VAL for each of W, M, Q, Y
- previous VWAP, VAH, VAL for each of W, M, Q, Y
Every single label has its own checkbox, so you can show exactly the ones you use and nothing else. Each period has its own color, and previous period labels are automatically dimmed so you can tell them apart at a glance. Two group switches, "Show Current Labels" and "Show Previous Labels", turn whole sets on and off.
Each label comes with a short horizontal tick line drawn at the price level, so you can see where the level sits even when the line itself is not plotted.
5. Rolling VWAPs (7, 30, 90, 365 day)
Rolling VWAPs do not reset. They always look back a fixed number of days and give you the volume weighted average of that whole window. They are calculated by time, not by bar count, so a 30 day rolling VWAP is the same 30 days whether you are on a 5 minute chart or a 4 hour chart. Each one has its own toggle, color and label.
Note on history: the 365 day line needs roughly a year of bars on your chart. On low timeframes with limited history it will be calculated from the first available bar. It is off by default for that reason.
LABEL CONTROLS
- Label Offset: how many bars to the right of the current bar the labels sit
- Label Size: tiny, small, normal or large
- Label Tick Length: length of the short line drawn in front of each label
- Show Right-Side Labels: one master switch that hides every label on the right in one click. Lines and fills stay. Useful when you want to screenshot a clean chart or when the labels start stacking up during a tight range.
HOW WE USE IT
The core idea is that VWAP is fair value for the period and the 1 SD bands are the edges of value. Price accepted inside the bands is balance. Price outside the bands is either an imbalance that will be faded back to value or the start of a trend that leaves the old value area behind.
A few things to watch for:
- Price opening the day or week outside the previous value area and holding there. That is acceptance away from old value and usually the start of a directional move.
- Price opening outside the previous value area and coming straight back inside. Failed breakout, look for a rotation to the other side of the value area.
- Daily VAH or VAL lining up with a weekly or monthly VWAP or value area edge. Stacked value edges from multiple timeframes are where the strongest reactions happen.
- Rolling 7D and 30D crossing or converging. That is medium term value shifting and it often precedes a larger move on the session timeframes.
The labels on the right are there so you never have to guess which level a line represents or scroll around to find the monthly VWAP.
CALCULATION NOTES
- Source is hlc3 by default and can be changed.
- VWAP is the volume weighted average of the source since the period start. Standard deviation is the volume weighted deviation of the source around that VWAP.
- Session boundaries come from the symbol's own exchange calendar.
- On symbols without volume (some CFDs and spot pairs), the indicator falls back to equal weighting so it still plots a time weighted average and bands rather than nothing.
- No repainting. Every value is computed from closed data and a period's frozen levels never change once the period has ended.
- Written in Pine Script v6.
INPUTS OVERVIEW
General: source, label offset, label size, label tick length, right side labels master switch
Session VWAPs: Daily / Weekly / Monthly / Quarterly / Yearly with colors, line width, dotted or solid
Standard Deviation Bands: on/off, anchored period, fill on/off, 2 SD bands on/off, colors, fill transparency
Previous Period Levels: prev 1 SD levels, prev 2 SD levels, prev labels, fill prev bands, color
HTF Labels: current / previous group switches, then per period color and six individual checkboxes (VWAP, VAH, VAL, pVWAP, pVAH, pVAL)
Rolling VWAPs: 7 / 30 / 90 / 365 day with colors
Works on any market and any timeframe. Built for futures and gold on intraday charts but the logic is the same on crypto, forex and stocks. Penunjuk

AM - 7h Session CandlesVersion 2.0.0
This is a major version because two defaults changed, so the tool behaves differently out of the box than v1.0.0 did.
NEW: SESSION BOUNDARY LINES
• Vertical lines on the real price bars showing where each 7-hour bucket starts, so it is obvious which stretch of chart each drawn candle is made of: the daily open (A starts), plus 7 hours (L starts), plus 14 hours (N starts), and where N ends.
• They cover exactly the buckets the strip is showing and no more, so raising "Sessions back" extends the lines along with the candles. There is no second control that can fall out of step with the first.
• The times come from the same daily-open arithmetic that decides which minute belongs to which bucket, never from a fixed clock, so a line cannot drift away from the candle it marks on any symbol or across a daylight saving change.
• Drawn on 1 hour charts and below only. Above that a 7-hour boundary falls too far inside a single bar for the line to mark anything useful. The candles themselves are unaffected on every timeframe.
• Own input group: show, colour, style and thickness. Drawn light grey at a fixed 25 percent opacity, so a boundary reads as a reference mark rather than competing with the price action.
CHANGED DEFAULT: THE 3 HOUR OVERNIGHT STUB IS NOW PART OF N
• New "NY 7h Candle Data Composition" dropdown. The new default, "NY plus 3h Overnight Stub", folds the last three hours of the day into the same N candle, so N runs from hour 14 to the end of the day and nothing is discarded.
• Why: dropping those hours left three hours of price action in no candle at all, so one day's N closed and the next day's A opened with a hole between them that nothing on the strip accounted for. Including them gives an unbroken day, with every minute in some candle and the bodies joining up.
• What it costs, stated plainly: a 10-hour N is no longer TradingView's own 7-hour bar, and it is no longer the three-equal-block model this tool credits to AMTrades. Choose "NY 7h Candle" to restore both. That setting is exactly what v1.0.0 shipped as.
• The letter stays N either way and no fourth candle ever appears. Only N's high, low and close can move, and it keeps updating for three hours longer than before. Where a day never reaches hour 21 at all, a short regular session for instance, there is no stub and the setting has no effect.
REMOVED: VERTICAL POSITION
• The "Vertical Position" input and its "Centred on Current Price" mode are gone. The strip now always sits at true prices, so a session high or low reads straight across to where that level falls in the price action.
• Why: centred mode added a constant to every drawn price and recomputed it on every tick, so the whole strip slid up and down as price moved and the completed A, L and N candles looked as though they were still forming. It was the default, so that was the out of the box behaviour.
• If you had already selected "Relative Position", your strip is unchanged.
• The cost is that a wide strip is now counted by the chart's auto scale and can compress the price action. Pine cannot exempt an overlay drawing from the scale, so the levers are a lower "Sessions back" or turning auto scale off.
SETTINGS PANEL
• Every tooltip rewritten in short lines, with anything that is a list set out one item per line instead of running on as a paragraph. A settings dialog does not wrap a paragraph usefully and a long one arrived as a dense slab.
• Laid out one row per element rather than one control per line. The boundary lines are a single row: the toggle carrying the name, then the colour, the style, and the width. The three candle colours share a row, and Wick Width shares one with Label Size. Fifteen rows became six, and each field now sits against its own label instead of in the dialog's shared left aligned column.
• Both Opacity inputs are gone. The candles are fixed fully solid and the boundary lines fixed faint, each at exactly what its input used to default to, so a chart on the defaults looks the same as before. Two fewer controls to set.
SMALLER CHANGES
• Candle Width and Gap Between Candles are no longer inputs. They are fixed at 2 bars and 1 bar, down from the 6 and 3 v1.0.0 shipped with, for a tighter strip. The wick still sits on true centre because 2 is even. Offset From Last Bar is now the only layout control.
• The originator is now credited as AMTrades throughout, rather than "AM".
• Documented that Extended hours is not the same as 24 hours and what it contains depends on the feed. US equity extended hours are 04:00 to 20:00, which is 16 hours, so even with the setting correct N gets only the two hours left after A and L and is a 2-hour candle presented as a New York 7-hour one.
FEEDBACK
Please let me know if you experience any issues, or have feedback for improvements or additions in the comments below. Thank you, Tom Penunjuk

Precision Volume Profile [AxeAlgo]OVERVIEW
Precision Volume Profile is a native Pine Script volume
profile tool: it rebuilds a full price-by-volume histogram for whatever
range you anchor it to — the visible chart, a fixed bar count, the
current day, week, month, or a custom trading session — and derives the
Point of Control (POC), Value Area High/Low (VAH/VAL), a Prior Period
Value Area with open-type and POC-migration classification, and a
session VWAP with standard-deviation bands, all from the same underlying
bar history.
This is the classic Market Profile / Volume Profile toolkit used to
judge where the market has actually traded the most volume — not just
where price is right now — and how today's activity compares to the
period before it. Everything here runs natively on your own chart data;
there are no external requests, no repainting of confirmed history, and
no hidden calculations.
This script is free and open-source, published so the full methodology
described below is verifiable directly in the source code.
============================================================
HOW IT WORKS
============================================================
Volume Profile Histogram
----------------------------
For the selected range, price is divided into rows (automatically sized
to the range, or set manually) and every historical bar's volume is
distributed across the rows its high-low span touches. Each bar's
volume is split into an estimated buy side and sell side based on where
that bar's close sits between its low and high — a bar that closed near
its high is treated as more buy-weighted, one that closed near its low
as more sell-weighted. The row with the most total volume becomes the
POC; rows are colored on a gradient between two configurable colors
based on that estimated buy/sell split, with opacity scaled to each
row's relative strength versus the POC.
Value Area
----------------------------
The Value Area is expanded outward from the POC two rows at a time —
comparing the volume of the next pair of rows above versus the next
pair below and adding whichever pair holds more volume — until the
accumulated volume reaches the configured Value Area percentage (70% by
default, the standard Market Profile convention). This is the same
textbook two-row-pair expansion method used for both the live profile
and the Prior Period snapshot below, so the two stay directly
comparable.
Anchor Modes
----------------------------
Six ways to define what range the profile is built from: Visible Range
(whatever's currently on screen), Fixed Bars (a set lookback), Day,
Week, Month, or a fully custom Session (configurable start/end time and
timezone, e.g. 0930-1600 for US regular trading hours). A dotted
vertical line marks exactly where the current profile's lookback
begins whenever that boundary isn't simply the edge of your screen.
Prior Period Value Area, Open Type & POC Migration
----------------------------------------------------
At each period boundary (Day or Week, configurable), the script
snapshots the period that just closed: its Value Area is drawn as a
dashed box extending forward, today's open is classified as Above,
Below, or Inside that prior value, and the new POC is compared against
the previous one to report whether it's migrating up, down, or holding
flat. This is the standard "open-type" read used to gauge whether a
session is likely to be rotational or trending.
Session VWAP & Standard Deviation Bands
------------------------------------------
A running volume-weighted average price with up to two configurable
standard-deviation bands on each side, calculated with the same
volume-weighted variance formula as TradingView's own VWAP tool. It can
reset either at calendar midnight or at your custom session's open
time — the same session window used by the Session anchor mode above,
so the two can be kept in sync.
Stats Panel
----------------------------
An optional on-chart table summarizing the active anchor mode, bar/row
count, POC, VAH/VAL, Value Area width, estimated buy/sell split and
delta, total volume, open type, POC migration, and current VWAP —
everything the script computes, in one place, without needing to
hover over individual lines.
Alerts
----------------------------
Two alert conditions: price crossing the POC, and price entering or
exiting the Value Area.
============================================================
ACCURACY NOTE — HOW BUY/SELL VOLUME IS ESTIMATED
============================================================
Pine Script does not have access to real trade-by-trade tape or
bid/ask data on standard bars, so no volume profile indicator can
measure "true" buy versus sell volume directly. This script — like
essentially every volume profile tool on TradingView — estimates it
from each bar's own OHLC: where the close sits between the low and the
high. This is a widely used, reasonable proxy, but it is an estimate,
not measured order flow. Treat the buy/sell split and Delta reading as
directional context, not a precise execution metric.
============================================================
HOW TO USE IT
============================================================
Add the indicator, pick an Anchor mode that matches how you trade
(Visible Range for manual exploration, Day/Week/Session for a
consistent recurring reference), and set the Value Area percentage if
you want something other than the 70% default. Every input has an
in-editor tooltip explaining exactly what it changes. The Prior Period
panel rows (Open Type, POC Migration) are most useful checked once at
the start of a session; the POC/VAH/VAL lines and histogram are
intended as a persistent reference for the rest of the period.
============================================================
REPAINTING & REAL-TIME BEHAVIOR
============================================================
The profile, its lines, and the stats panel are only (re)computed on
the most recent bar (barstate.islast) — not on every historical bar —
for performance, and are cleared and redrawn from scratch each time
they update. In Visible Range or Fixed Bars mode this means the profile
legitimately changes as you scroll, zoom, or as new bars form — that's
the tool responding to a different input range, not repainting of a
fixed historical value. In Day/Week/Month/Session mode, once a period
has closed its POC, VAH, and VAL are fixed and do not change on
subsequent reloads; only the currently forming period's profile updates
live as new bars print. The Prior Period Value Area snapshot is
computed once, at the moment its period closes, and is never
recalculated afterward.
============================================================
LIMITATIONS — PLEASE READ
============================================================
- Buy/sell volume is an OHLC-based estimate, not real tape data (see
the Accuracy Note above).
- The Value Area expansion is a discrete two-row-pair algorithm; on
very coarse row counts it can land a percentage point or two away
from the exact target rather than hitting it precisely.
- "Max Bars Stored" caps how much history is kept in memory for
performance; extremely long Fixed Bars or Visible Range lookbacks on
very low timeframes can exceed it and get truncated.
- The custom Session anchor and VWAP session-open reset depend on the
Session Time and Timezone inputs actually matching your instrument's
real trading session — mismatched inputs will produce a
technically-correct but practically meaningless boundary.
- This is a discretionary analysis tool intended to support your own
read of the market, not a mechanical, guaranteed-signal system.
============================================================
RISK DISCLAIMER
============================================================
This script is provided for educational and informational purposes
only. It is not financial advice, and it is not a recommendation to buy
or sell any security or instrument. Trading and investing involve
substantial risk of loss and are not suitable for every investor. Past
performance is not indicative of future results. Always do your own
research and consider consulting a licensed financial advisor before
making trading decisions. Use this indicator, and any alerts it
generates, entirely at your own risk.
============================================================
ORIGINALITY
============================================================
This is original work: the row-building and Value Area expansion
algorithms, the Prior Period snapshot and open-type/migration logic,
the session-anchor handling, and the visual design are all written
from scratch for this script. It is published free and open-source so
the full methodology described above is verifiable directly in the
source code.
Penunjuk

Trading Sessions [EDGE]Trading Sessions .
A continental trading-session engine that marks the four global sessions - Pacific, Asia, Europe, USA - in both Forex and Stocks mode, and shows at a glance which session is live, how long until each one opens or closes, and where price sits relative to each session open. Built for intraday traders who structure the day around session opens and want a single, timezone-correct view of the session clock.
How it works:
Every session is defined in the local business hours of its region and detected with an IANA timezone name (Australia/Sydney, Asia/Tokyo, Europe/London, America/New_York), so daylight-saving transitions are resolved automatically - the windows shift with each region's own clock and never need a manual seasonal adjustment. Detection is restricted to Monday through Friday. Two market modes share the same four continental sessions with hours native to each market type: in Forex mode they map to the Sydney, Tokyo, London and New York dealing desks; in Stocks mode they map to the region's anchor cash market - ASX Sydney (Pacific), a combined Tokyo/Hong Kong window (Asia), LSE London (Europe) and NYSE/Nasdaq (USA).
For each active session the script tracks a live high and low, drawing a range box that updates every bar and a horizontal line at the session open. The dashboard reads live clock time in each session's own timezone, so its open and close countdowns stay correct through every daylight-saving change, and it reports each session open price together with the current price's signed percent distance from it. All context is anchored to price - session boxes and open lines - plus the dashboard; there is no background shading.
What it calculates:
- Session state - which continental sessions are open right now, marked with a dot and a session-colored row in the dashboard
- Countdown - time until each session opens (when closed) or closes (when running), in the session's own timezone
- Session range box - the live high-to-low band of each session, kept on the chart as a prior-session reference
- Session open price - the price at which each session opened, shown in the dashboard
- Open Δ% - the current price change from the session open as a signed percent, green above the open and red below
- Session open line - a horizontal level at each session open, a widely watched institutional reference for retests
- Europe/USA overlap flag (Forex) - a dashboard note during the four-hour overlap, the deepest liquidity window of the day
Key features:
- Two market modes - Forex and Stocks - selectable from a single input, each with its own native session hours
- Four continental sessions - Pacific, Asia, Europe, USA - with per-session visibility toggles and editable hours
- Automatic daylight-saving handling through IANA timezones; no manual seasonal switching
- Combined Asia stock session spanning Tokyo and Hong Kong as one continuous window
- Live dashboard with active-session highlighting, per-session open/close countdowns, session open price and the signed percent change from it, with configurable position and text size
- Session range boxes and session open price lines, both fully colorable, with a configurable history depth to limit chart clutter
- Alerts for every session open and close, plus the Europe/USA overlap start
- Intraday-only operation with a clear on-panel notice on daily and higher timeframes
Who it's for:
Intraday and short-horizon traders who structure the day around session opens - Asia-range and London-breakout players, New York-open traders, and index or futures traders who track the Pacific-to-USA handover. The tool answers the questions that matter at the open: which session is driving price now, how long until the next one turns over, and how far price has travelled from each session open - a clean, timezone-correct session clock without the visual noise of overlapping session tools. Penunjuk

EMA + VWAP + Sessions + ORB v2EMA + VWAP + Sessions + ORB
An all-in-one intraday toolkit combining trend, mean-reversion, session-timing, and opening-range tools in a single overlay — every element independently customizable.
📈 Triple EMA
Three fully independent EMAs, each with its own length, color, visibility toggle, and line style (Solid / Dashed / Dotted). Defaults: 9 (red) / 21 (white) / 50 (blue).
⚖️ VWAP
Session-anchored VWAP with adjustable color, line width, and style (Solid / Dashed / Dotted). Default: yellow.
🎨 Adjustable Dash/Dot Spacing
Dashed and Dotted styles use a custom-built rendering method so they show exactly as much chart history as Solid lines — no artificial history limit. Dash length, dash gap, and dot gap are all independently tunable to match your timeframe.
🌍 Session Overlay
Highlights the London, New York, Tokyo, and Sydney sessions directly on the chart. Each session has its own show/hide toggle, editable time window, and color. Choose between full background shading or a band that hugs just the session's high/low range — useful for spotting session overlaps and volatility windows at a glance.
🎯 Opening Range Breakout (ORB)
Define any custom time window (not locked to fixed 5/15/30-min presets) and the script plots the resulting opening range as a shaded box with extending high, low, and halfway (50%) lines. Includes:
Optional breakout and retest signals, with failed-retest detection
Previous-day range visibility
Built-in alert conditions for both simple level crosses and confirmed breakouts
🎯 ORB-Based Take-Profit Levels
Six auto-calculated TP lines — TP1/TP2/TP3 for both long and short scenarios — measured as configurable multiples of the ORB range, projected from the ORB midpoint. Default multiples are 1x / 2x / 3x, each independently adjustable, so you can size targets to your own risk model.
Fully customizable colors and toggles across every component — EMAs, VWAP, all four sessions, and every ORB element — so the indicator can be tuned to match any chart theme or trading style. Penunjuk

XauLabs Sessions & Kill ZonesENGLISH
What it does
Gold does not behave the same way around the clock. This indicator draws one box around each trading session — Asia, London, New York — covering exactly the price range that session has traded, and highlights two narrower windows inside them, commonly called Kill Zones, where volatility and participation concentrate. It answers one question only: what time is it, in market terms — and what has each part of the day actually done?
How it works (full method)
Session definition. Five time windows are defined in UTC and are all user-editable. Defaults: Asia 23:00–08:00, London 07:00–16:00, New York 12:30–21:00, London Kill Zone 07:00–10:00, New York Kill Zone 13:30–16:00. UTC is used deliberately so the display does not shift with the chart's timezone or with daylight saving changes in a single region.
Range boxes. When a session opens, a box is created at that bar. On every following bar of the session, the box extends to the right and its top and bottom are pushed to the highest high and lowest low reached so far. When the session ends, the box stops: what remains is the session's true footprint — its duration and its full price range.
Visual hierarchy. Sessions are drawn as thin outlines with no fill, one colour each (Asia blue, London amber, New York violet). Kill Zones are the only filled boxes, in red with a thicker border, and carry their name. A Kill Zone lives inside its parent session: you see a red block inside a thin frame, not two shapes fighting.
Dashboard. A panel in the top-right corner names the window currently active, then lists all five windows with a colour swatch and a countdown: "ends in 1h04" for an open window, "in 7h15" for the next occurrence of a closed one. The panel doubles as the colour legend.
Timeframe guard. Above H1 the whole display is suppressed and the panel says so. A four-hour candle spans several sessions, so a session reading on it would be meaningless. Rather than draw something wrong, the tool draws nothing.
No repainting
Boxes are anchored to bar timestamps and only ever extend forward as bars close; the countdown panel is informational and recomputed on the last bar. Nothing is redrawn after the fact: a box you see in history is exactly what was drawn live.
On-chart output
One outlined box per session occurrence, kept in history for day-to-day comparison.
Filled red boxes on both Kill Zones, with their names.
The dashboard panel with current window and countdowns, selectable text size.
Two alert conditions: London Kill Zone opening, New York Kill Zone opening.
Suggested use
M15 or M5. Watch how narrow the Asian box builds overnight, how the London open attacks its boundaries, and how often the day's real move starts inside a red window. Comparing box heights across days gives an immediate feel for which sessions are carrying the volatility. Used as a context filter, it answers when a setup is worth taking, not what the setup is.
All colours, fill strengths, session hours and display options are user-configurable.
This is an educational timing tool. It gives no buy or sell signals and makes no performance claim. Trading involves substantial risk of loss.
FRANÇAIS
Ce que fait l'indicateur
L'or ne se comporte pas de la même façon selon l'heure. Cet indicateur dessine une boîte autour de chaque session de cotation — Asie, Londres, New York — couvrant exactement l'amplitude de prix parcourue par cette session, et met en évidence deux fenêtres plus étroites à l'intérieur, communément appelées Kill Zones, où la volatilité et la participation se concentrent. Il répond à une seule question : quelle heure est-il, au sens du marché — et qu'a réellement fait chaque partie de la journée ?
Comment il fonctionne (méthode complète)
Définition des sessions. Cinq fenêtres horaires sont définies en UTC et toutes modifiables par l'utilisateur. Par défaut : Asie 23h00–08h00, Londres 07h00–16h00, New York 12h30–21h00, Kill Zone Londres 07h00–10h00, Kill Zone New York 13h30–16h00. L'UTC est un choix délibéré : l'affichage ne se décale ni avec le fuseau du graphique, ni avec les changements d'heure d'une seule région.
Boîtes d'amplitude. À l'ouverture d'une session, une boîte est créée sur cette bougie. À chaque bougie suivante de la session, la boîte s'étend vers la droite et ses bords haut et bas sont poussés jusqu'au plus haut et au plus bas atteints. À la fin de la session, la boîte s'arrête : il reste l'empreinte réelle de la session — sa durée et son amplitude complète.
Hiérarchie visuelle. Les sessions sont tracées en contour fin sans remplissage, une couleur chacune (Asie bleu, Londres ambre, New York violet). Les Kill Zones sont les seules boîtes remplies, en rouge avec bordure renforcée, et portent leur nom. Une Kill Zone vit à l'intérieur de sa session : on voit un bloc rouge dans un cadre fin, pas deux formes qui se disputent.
Tableau de bord. Un panneau dans le coin supérieur droit nomme la fenêtre en cours, puis liste les cinq fenêtres avec une pastille de couleur et un décompte : « finit dans 1h04 » pour une fenêtre ouverte, « dans 7h15 » pour la prochaine occurrence d'une fenêtre fermée. Le panneau sert aussi de légende des couleurs.
Garde-fou d'unité de temps. Au-dessus de H1, tout l'affichage est supprimé et le panneau l'indique. Une bougie de 4 heures couvre plusieurs sessions : y lire une session n'aurait aucun sens. Plutôt que d'afficher quelque chose de faux, l'outil n'affiche rien.
Aucun repaint
Les boîtes sont ancrées sur l'horodatage des bougies et ne font que s'étendre vers l'avant à mesure que les bougies clôturent ; le panneau de décomptes est informatif et recalculé sur la dernière bougie. Rien n'est redessiné après coup : une boîte visible dans l'historique est exactement celle qui a été tracée en direct.
Affichage
Une boîte en contour par occurrence de session, conservée dans l'historique pour comparer les journées.
Des boîtes rouges remplies sur les deux Kill Zones, avec leur nom.
Le tableau de bord avec fenêtre en cours et décomptes, taille de texte réglable.
Deux conditions d'alerte : ouverture de la Kill Zone de Londres, ouverture de celle de New York.
Utilisation suggérée
M15 ou M5. Observer comme la boîte asiatique se construit étroite pendant la nuit, comment l'ouverture de Londres attaque ses bornes, et combien de fois le vrai mouvement du jour démarre dans une fenêtre rouge. Comparer la hauteur des boîtes d'un jour à l'autre donne une lecture immédiate des sessions qui portent la volatilité. Utilisé comme filtre de contexte, il répond à la question de savoir quand un setup vaut la peine d'être pris, pas de quel setup il s'agit.
Toutes les couleurs, intensités de remplissage, heures de session et options d'affichage sont réglables.
Outil éducatif de lecture horaire. Il ne donne aucun signal d'achat ou de vente et ne formule aucune promesse de performance. Le trading comporte un risque de perte important. Penunjuk

Sessions - New York, London & AsiaOVERVIEW
This indicator draws price range boxes for the main trading sessions (Asia, London/Europe, and New York) and an optional full-day box with daily high/low labels and open/close lines. It is a chart-context tool: it shows where price traded during each session window, not buy/sell signals.
PURPOSE / WHY THIS EXISTS
Many traders need a clear visual of:
1) which session produced the day’s high or low,
2) how large the session range was,
3) how sessions overlap (for example London–New York),
4) and where the daily open sits relative to those ranges.
This script combines three session range boxes with a daily structure layer (00:00–24:00 in a fixed timezone). The components are meant to work together so you can read session behavior against the same day’s overall range without stacking several separate scripts.
WHAT IT DOES
• Asia session box — tracks high/low while the Asia window is open; freezes the box when the session ends.
• London (Europe) session box — same logic for the London window.
• New York session box — same logic for the RTH-style New York window.
• Daily box — full calendar day high/low in the same timezone.
• Daily high/low labels — marks the bar time of the daily high and low.
• Optional daily open and close/last lines with labels.
Sessions are only drawn on intraday charts. On daily and higher timeframes, session boxes are disabled (the daily layer can still apply depending on your settings).
DEFAULT SESSION TIMES
All times use the America/New_York timezone (TradingView handles daylight saving for that zone). Defaults can be edited in the inputs:
• Asia: 20:00–05:00
• London (Europe): 03:00–12:00
• New York: 09:30–16:00
Overlaps are intentional. For example, Asia and London can share a morning window, and London and New York share a large mid-day window. The boxes stack so you can see concurrency visually.
HOW IT WORKS (CONCEPT)
1) Session membership
For each session, the script checks whether the current bar’s time falls inside the configured session string, evaluated in America/New_York.
2) Session start / end
• Session start: first bar that is inside the session after being outside.
• Session end: first bar that is outside the session after being inside.
3) Range tracking
While inside a session, the script updates running high and low from bar high/low. The live box left edge is the session start bar; the right edge follows the current bar. When the session ends, the box is fixed for that day/session instance and kept in an optional history list.
4) Daily layer
The daily open is taken from the 1D open of the symbol. Daily high/low are tracked from bar values until the New York calendar day changes, then the previous day is finalized as a historical daily box (if enabled).
5) Object limits
History depth is capped by internal safety limits so the chart does not exceed TradingView drawing object limits on low timeframes.
HOW TO USE IT
Typical workflow on a 1m–15m chart:
1) Load the symbol you trade (indices, FX, metals, etc.).
2) Keep default session times if your process is U.S.-anchored; otherwise edit the three session inputs.
3) Use GLOBAL visibility toggles if you only need one or two sessions on screen.
4) Compare the current New York (or London) box size to recent historical boxes of the same color — this is visual context for range expansion/contraction, not a trade rule by itself.
5) Use daily high/low labels to see whether extremes printed in Asia, London, or New York.
6) Use open/close lines if you track acceptance above/below the daily open as part of your own rules.
Suggested reading order on any day:
Daily structure first (open, D Hi, D Lo) → then session boxes → then your own entry method (structure, levels, etc.). This script does not define entries, stop-loss, or take-profit.
INPUTS (MAIN GROUPS)
• Session time strings and colors for Asia / London / New York.
• Per-session show historical vs current boxes; outline-only options.
• GLOBAL toggles for each session.
• Daily box: historical and current day display.
• Daily high/low labels and colors.
• Daily open/close lines and their labels.
COLORS (DEFAULT IDEA)
• Asia — yellow tones
• London — blue tones
• New York — red tones
• Daily — lime tones
Colors are customizable so you can match your chart theme.
WHAT THIS SCRIPT IS NOT
• Not a strategy and not a signal generator.
• Not a guarantee of profitable trades or future price direction.
• Not a replacement for risk management or a complete trading plan.
• Session times are conventions (liquidity-focused windows), not a claim that one session is inherently “better” to trade.
TIPS FOR A CLEAN CHART
• Publish/use with this script alone on the chart for clarity.
• Prefer outline-only if fills feel heavy.
• Reduce historical session display if the chart becomes crowded.
LIMITATIONS
• Session logic depends on the bar timeframe: on higher intraday TFs, box edges align to those bars, not tick-perfect open/close of the clock window.
• Some symbols have thin overnight liquidity; box size then reflects that microstructure, not “quality” of a setup.
• Past session ranges do not predict the next session’s range.
DISCLAIMER
This tool Sessions - New York, London & Asia is for educational charting and visual analysis only. Markets involve risk. Past behavior on a chart does not guarantee future results. Always validate any idea on your own charts and risk parameters. Penunjuk

Session Sentinel [JOAT]A round-the-clock session watchtower — Asia, London and New York, each tracked live with its own range, rails and color.
◆ WHAT IT IS
Where price sits relative to the session ranges is core context for intraday trading — Asia builds the range, London and New York tend to expand it. Session Sentinel tracks all three sessions simultaneously, each with a live box, high/low rails and midline, in its own signature color. It is a pure context tool and prints no buy/sell signals.
This is 100% original code, written from scratch. It does not copy any other session script.
◆ HOW IT WORKS
1. Three independent watches. Each session (Asia, London, New York) has its own fully adjustable window and a shared timezone selector. As a session runs, the tool records its running high and low into a live box and draws:
• Session high/low rails — the levels other traders watch
• A midline — the session's equilibrium
• A name tag on the box
2. Session lifecycle. When a session ends, its box is finalized and archived. Only a configurable number of recent sessions are kept per watch, so history stays readable across all timeframes.
3. Day-open reference. A neutral daily open line provides a permanent intraday reference — price above or below the day's open is a simple, powerful bias filter.
◆ WHAT YOU SEE
• Live, color-coded session boxes — Asia, London, New York — with high/low rails and midlines
• A daily open reference line
• A resizable dashboard showing which watch is on duty, each session's high/low and range size, live/closed status, and the day open with price's distance above or below it
◆ HOW TO USE IT
• Use the Asia range as the reference other sessions break out of; London and New York frequently sweep or expand it.
• Session high/low rails act as intraday support/resistance and as breakout levels.
• The day open is a clean bias line — trading above or below it frames your directional lean.
• Adjust each session window to your instrument and exchange. Designed for intraday timeframes .
◆ NOTES & LIMITATIONS
Sessions are evaluated in the timezone you select — set it to match your market. On daily and higher timeframes the intraday session concept does not apply. This is a context tool, not financial advice; session levels are references, not predictions. Combine with your own method and risk management.
— made with passion by officialjackofalltrade
Penunjuk