Daye @joshuuuThis indicator is based on Dayes studies about 90minute cycles and true opens.
Similar to how ICT teaches the true day open at 0.00, Daye came up with his true year, true month, true week and true session opens.
True Year - April 1st
True Month - 2nd Monday
True Week - Monday, 6pm
True Day - 12am (Midnight)
True Session - 1:30am (London), 7:30am (New York), 1:30pm (Afternoon)
Ideally, for a bearish scenario, we would like to see price trade above the opening price to then reverse and trade lower.
Ideally, for a bullish scenario, we would like to see price trade below the opening price to then reverse and trade higher.
The moves into the opposite direction are used my smart money to accumulate their positions and trap traders into wrong positions.
This indicator also shows 90 minutes cycles.
90min Cycle Cheat Sheet:
Q1. (A)ccumulation - Consolidation
Q2. (M)anipulation - Judas Swing (Trade this)
Q3. (D)istribution - LRLR (Trade this)
Q4. (X) - Continuation/Reversal of previous q.
Or
Q1. (X) - Continuation/Reversal of previous q.
Q2. (A)ccumulation - Consolidation
Q3. (M)anipulation - Judas Swing (Trade this)
Q4. (D)istribution - LRLR (Trade this)
This shows that if q1 consolidates and q2 takes out one side and reverses we anticipate q3 to have a strong move.
however, if q2 consolidates, we anticipate q3 to take out one side, reverse and then have a strong move in q4.
Session

Sessioned EMA - Frozen EMA in post market hoursWhy I develop this indicator?
In future indices, post market data with little volume distort the moving average seriously. This indicator is to eliminate the distortion of data during low volume post market hours.
How to use?
There is a time session setting in the indicator, you can set the cash hour time, moving average outside the session will be frozen.
What this indicator gives you
This indicator give you a more make sense ema pattern, the ema lines are more respected by the prices when you set the session properly.
Setup
1. Session setting
In US indices, such as NQ, ES etc, when there was data release at 0830 hr, huge volume transaction order appears, that makes the 0830 price data important that should be included in your ema trend line calculating. If that is the case, I will set the session begin from 0830, otherwise, I start the session at 0930. Golden rule : Price with huge volume counts.
2. Time zone
The coding is decided for GMT+8 time zone, you may amend the code to fit your timezone.

Session Bar Color (US Time)This script is designed to change the color of bars on a trading chart based on different trading sessions in Eastern Time (ET). It is different from currently published scripts in that it specifically focuses on US time sessions and provides a customizable approach to defining and coloring each session.
To use this script, you can apply it to a chart by selecting it from the list of available indicators or overlays.
The script is meant for traders who are interested in visualizing different trading sessions on their charts. By coloring the bars based on session boundaries, it can help traders quickly identify session changes and potentially adjust their trading strategies accordingly. Mostly it's used to draw the high and low zones of each session.
The markets this script is suitable for are those that operate within the US time zones, as it specifically focuses on Eastern Time (ET) sessions. It can be used for various types of markets, including stocks, futures, and forex.
The conditions for each session are defined using the input. session function, which allows you to specify the start and end times for each session. The script includes four sessions: Asian, London, USA, and New York. By modifying the defval parameter for each session input, you can customize the session times to fit your specific trading preferences or time zone.
The script uses the time function to check if the current bar falls within a particular session. If the condition is met, it sets the color of the bar using the bar color function. Each session is assigned a different color: black for the Asian session, teal for the London session, a custom RGB color (dark red) for the USA session, and red for the New York session.
It's important to note that this script assumes the time zone of the trading platform is set to "Etc/GMT+4" to align with Eastern Time (ET). If your platform uses a different time zone, you may need to adjust the time function calls to match your desired time zone.

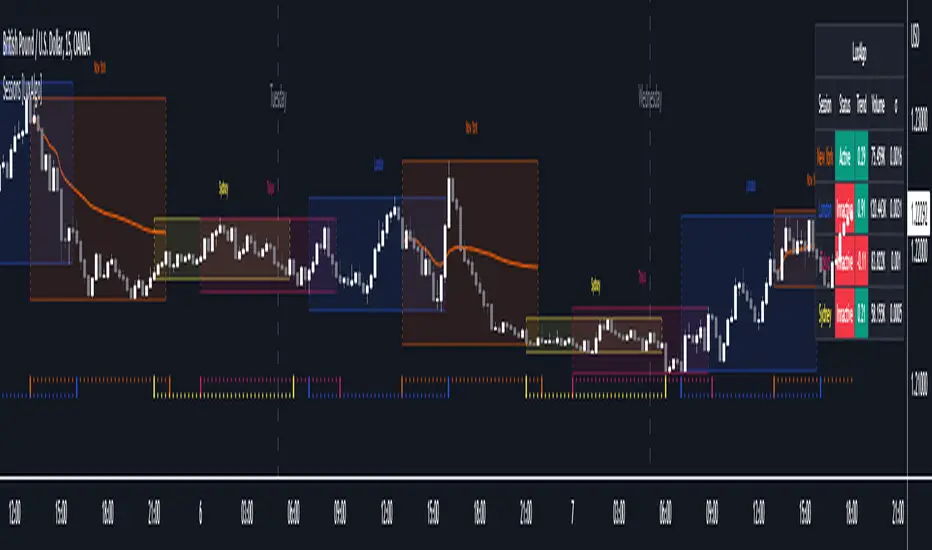
Sessions[Lenny Kiruthu]The script below is designed to show up to 4 different trading sessions i.e. London, New York, Tokyo and Sydney sessions, it also displays the days each session is taking place in as well as two horizontal lines one for the previous days high and the other for the previous days low.
It also displays a table that shows the user the highest and lowest price for 4 different currency pairs the previous day as well as their current prices and below it a confirmation row that shows whether price is currently above, below or within yesterdays range. Note that it only states "High Broken" or "Low Broken" if the current close is above or below the lines.
What you can change
Your time zone for example GMT -4 or GMT +3
The session start and end time
The colors, border type and border width of the session ranges
Displaying the table
Ability to choose the 4 symbols to view on the table

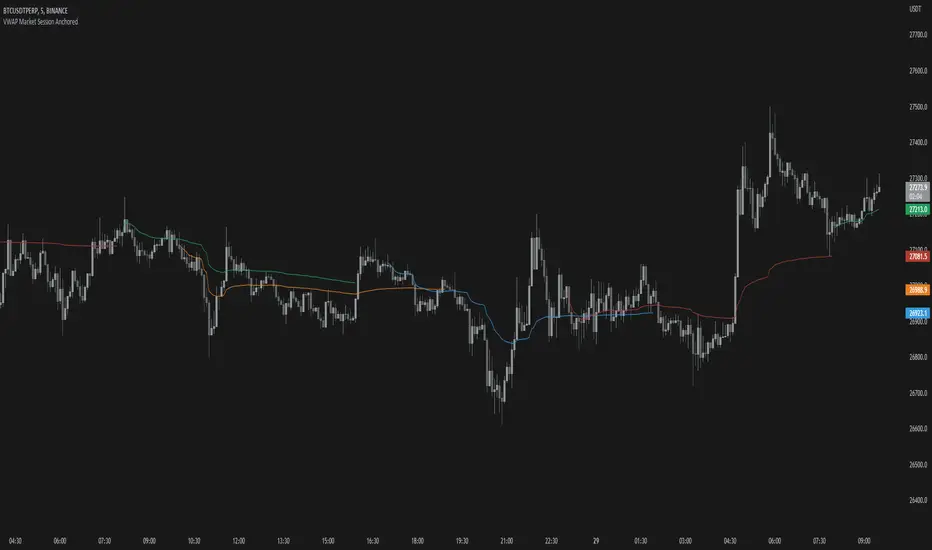
VWAP Open Session Anchored by HampehThe VWAP Open Session Anchored indicator differs from traditional VWAP indicators by automatically anchoring the Volume Weighted Average Price calculation to three market session starts Morning, Evening, and Night. Each session represents a distinct time period within the trading day, offering traders and investors a more comprehensive view of the volume-weighted average price within specific sessions.
What Is the Volume-Weighted Average Price (VWAP)?
The volume-weighted average price (VWAP) is a technical analysis indicator used on intraday charts that resets at the start of every new trading session.
VWAP is important because it provides traders with pricing insight into both the trend and value of a security.
KEY TAKEAWAYS
1. The volume-weighted average price (VWAP) is a single line on intraday charts.
2. It looks similar to a moving average line but smoother.
3. VWAP represents a view of price action throughout a single day's trading session.
4. Retail and professional traders may use the VWAP to help them determine intraday price trends.
5. VWAP typically is most useful to short-term traders.
VWAP is calculated by totaling the dollars traded for every transaction (price multiplied by the volume) and then dividing by the total shares traded.
VWAP = Cumulative Typical Price x Volume/Cumulative Volume
Where Typical Price = High price + Low price + Closing Price/3
Cumulative = total since the trading session opened.
How Is VWAP Used?
VWAP is used in different ways by traders. Traders may use VWAP as a trend confirmation tool and build trading rules around it. For instance, they may consider stocks with prices below VWAP as undervalued and those with prices above it, as overvalued. If prices below VWAP move above it, traders may go long on the stock. If prices above VWAP move below it, they may sell their positions or initiate short positions.
Institutional buyers including mutual funds use VWAP to help move into or out of stocks with as small of a market impact as possible. Therefore, when they can, institutions will try to buy below the VWAP or sell above it. This way their actions push the price back toward the average, instead of away from it.
Source: www.investopedia.com

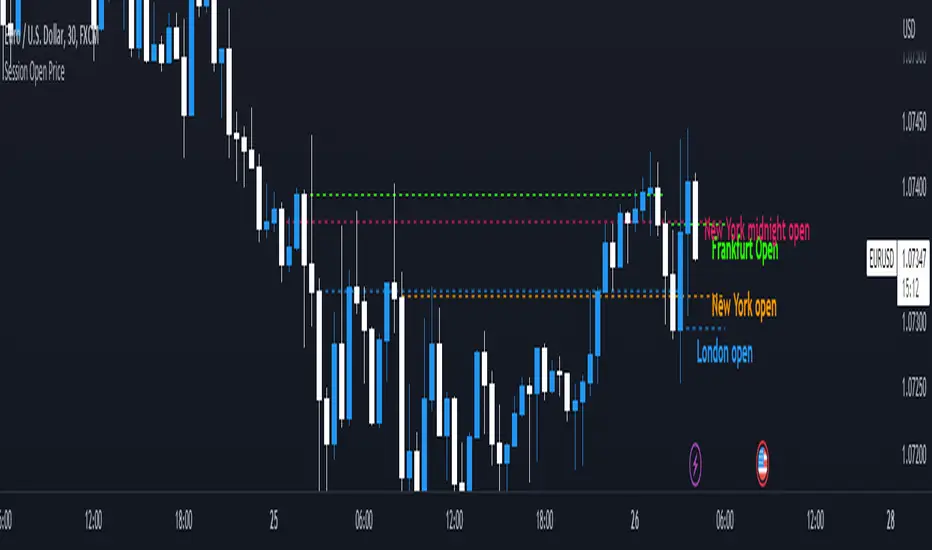
Session Open PriceThis Indicator displays the ICT kill zones' open price
You will be able to see the following open prices (ALL TIMES ARE IN NEW YORK TIME)
All times and appearances are customisable to your own liking.
The default time setting is recommended
- 00:00 AM Midnight New York Open Price (RED DASH LINE)
- 2:00 AM Frankfurt Open Price (GREEN DASH LINE)
- 3:00 AM London Open Price (BLUE DASH LINE)
- 8:30 AM New York Open Price (ORANGE DASH LINE)
HOW TO USE SESSION OPEN PRICE IN YOUR TRADING
If the price is above the opening price you only look for sells whereas if the price is under the opening price you only look for buys
BUY EXAMPLE
Wait for Midnight New York and Frankfurt open price to display
The price must be under both prices
Look for a Market maker buy model or your own entry model
Stoploss will be at the swing low and Take profit can be a fixed RR or how you calculate your take profit level
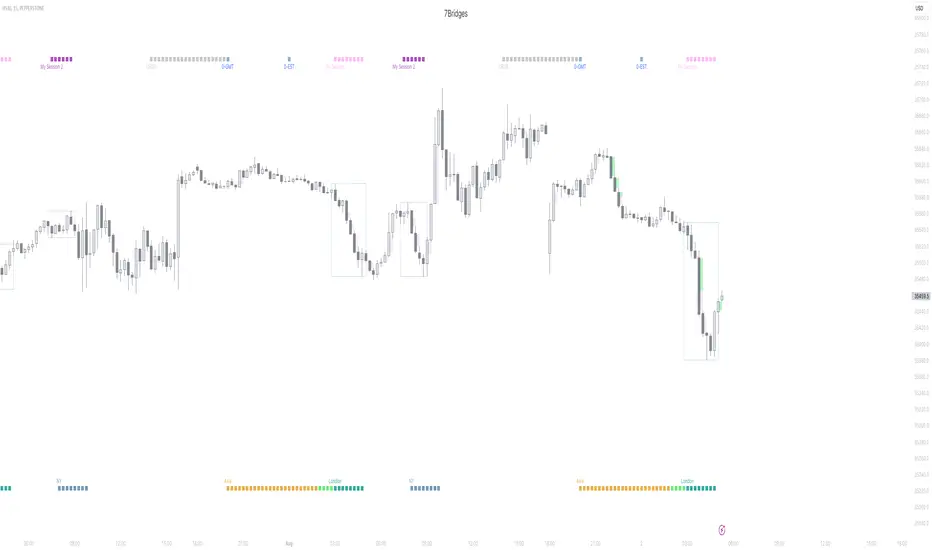
Session KillZones [7Bridges]Session Killzones by 7Bridges indicator display the killzones of asian, LND and NY sessions. There is also a custom session of your choice.
The times of each killzone are GMT time and you can adjust it in the settings.
You have also the beginning of the day, GMT and EST timezones.
By default the killzones are set like that on the GMT/UTC timezone :
-> Asia : 00:00 - 06:00
-> Pre London : 06:00 - 07:00
-> London : 07:00 - 10:00
-> New York : 12:00 - 15:00
-> Custom session : choose your own time
What makes the indicator very different is that the session is not overlapping the price but you have bars below and above the price.
Settings:
-> you can chose to display the Killzones (Asia, pre LND, LND and NY)
-> you can manages the time of the sessions
-> you can chose to display the start of the day (GMT/UTC and EST )
The indicator is displayed by default only for all the timeframes below 60min.
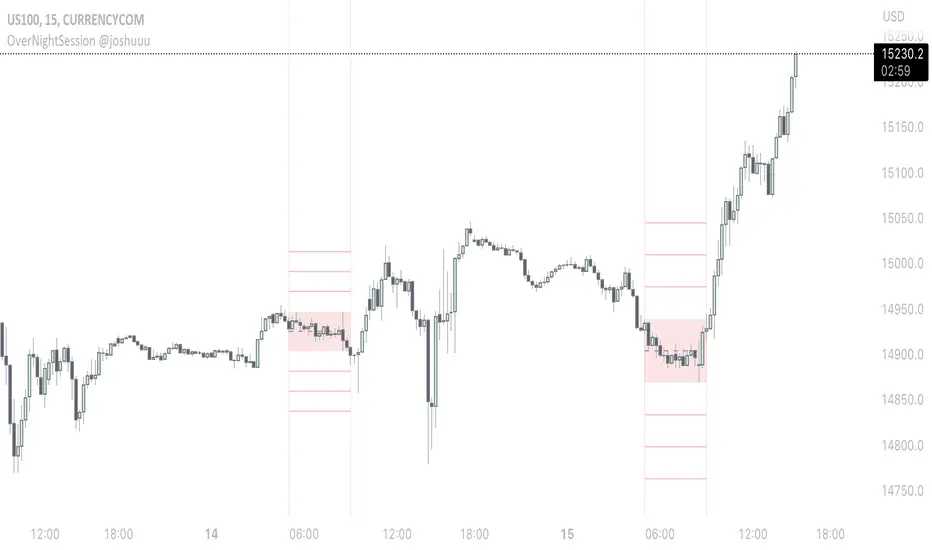
OverNightSession @joshuuuThis indicator highlights the Overnightsession (ONS), taught by TheCurrenyMerchant.
The Overnightsession is from 4-8 am UTC-5. This session can be used to form trades, e.g. after one side has been taken out.
It has the options to display Projection and the equilibrium level. Equilibrium level (50%) can be used to identify if price is currently in premium/discount of the range and the projections (standard deviations of the range) can be used to identify possible targets.
A classic setup he teaches is:
Price trades agressively out of the range taking liquidity. As soon as we trade above the high of the candle that took liquidity, that candle can be considered an orderblock, where the 50% level can be used for long setups.
⚠️ Open Source ⚠️
Coders and TV users are authorized to copy this code base, but a paid distribution is prohibited. A mention to the original author is expected, and appreciated.
⚠️ Terms and Conditions ⚠️
This financial tool is for educational purposes only and not financial advice. Users assume responsibility for decisions made based on the tool's information. Past performance doesn't guarantee future results. By using this tool, users agree to these terms.
market sessions by sellstreetIndicator of trading sessions:
Indicator created to track the opening of trading sessions:
Asia, Frankfurt, London, New York.
Tracking the opening of these key levels
- Day Opening (DO), Week Opening (WO), Month Opening (MO).
- New York (NYM) openings display.
- Highs and lows of the previous day (PDH/PDL).
- Day of the week display.
- Formation of the Сentral Bank Dealers Range (CBDR).
Indicator settings.
The open source code will help traders to understand the technical part of the script.
Flexible visual and technical setup of the indicator:
- Ability to enable/disable the display of trading sessions on the history.
- Enabling/disabling the display of the key opening levels on the chart history for a convenient backtest.
- Automatically switch to summer/winter time.
To use this indicator, add it to your favorites after the chart
TradingView must be overloaded to work correctly.

[MiV] Trading SessionHello, everyone!
Today I want to present my new script, which I hope will help not only me!
I'm sure that many people, like me, went through such a stage as "building their strategy". This is when you sit and test on the history how you would enter or exit a trade.
Recently I was doing the same thing and realized that my "tests" involve night time, when in reality I would be asleep and not trading! So I decided to create an indicator that would display my "working hours" so that the backtest I conduct would be as realistic as possible.
Also this indicator is able to display sessions of major exchanges and forex working hours, so it will be useful not only for cryptocurrency lovers.
In addition, we don't always trade every day and, for example, I don't trade on Sunday. That's why we added a feature that "turns off" the day and does not highlight it in color if you're not planning to trade on that day.
And finally, I added a notification of the beginning and end of the trading session. A small thing, but it may also be a useful feature for those who like to sit at the chart!
I will be glad to receive any comments and suggestions!
-----
Всем привет!
Хочу сегодня представить свой новый скрипт, который, надеюсь, поможет не только мне!
Уверен, что многие, как и я, проходили такой этап как "постройка своей стратегии". Это когда ты сидишь и тестируешь на истории то как бы ты входил или выходил из сделки.
Вот недавно я ровно также занимался этим и осознал, что мои "тесты" затрагивают и ночное время, когда в реальности я бы спал и не торговал! Поэтому я решил создать индикатор, который будет отображать мои "рабочие часы", чтобы бектест, который я провожу, был максимально реалистичным.
Также данный индикатор умеет отображать сессии крупных бирж и время работы форекса, так что полезным он будет не только для любителей криптовалюты.
Кроме того, мы же не всегда торгуем каждый день и например я не торгую в воскресенье. Поэтому добавлен функционал, который "выключает" день и не подсвечивает его цветом, если ты в этот день не планируешь торговать.
Ну и в заключении, добавил уведомление о начале и завершении торговой сессии. Мелочь, а тоже может быть полезной фичей для тех кто любит засесть за графиком!
Буду рад любым замечаниям и предложениям!

Extended Session High/Low - Intraday and daily chartsThis script plots the extended session highest high and lowest low levels. It works on any time frame from 1 minute to daily.
Please note that during the extended session, TradingView stops updating the daily chart. This means that once the script is loaded on a daily chart, it will not be updated until the market opens, unless you manually reload the layout (Ctrl+R). For this reason, it is recommended to use a multi-timeframe layout, so when the pre/post market line is near the extended session high/low on the daily chart, you can compare these values with those on an intraday chart of the same ticker.
The extended session high/low are important for day traders because they represent the maximum and minimum limits within which the trades have taken place during the extended trading hours. This can make them levels of support/resistance that can be useful for planning trend following, reversal and range-bound strategies.
By displaying the extended session high/low on the daily chart, traders can also see if there are any significant levels nearby that are related to the daily time frame, such as trendlines, support/resistance levels, or moving averages. This can help the trader evaluate whether there is enough room for a price movement in the direction of his trading strategy.

Sessions Indicator [CodeDNL]A sessions indicator that doesn't cover the whole trading screen, and continues into the future.
Made to be easier on the eyes than existing solutions.

FX Sessions & Killzones ETJust another sessions indicator. Among all the many existing ones, I didn't find anything simple that would cover my needs and that would actually be correct.
New York time is forced here for plotting the stripes so you don't need to worry about the time zone currently set on your chart. The indicator will be accurate during Daylight Saving Time (which, in 2023 for example, started on Sunday, 12 March , 02:00:00 and will be in effect until Sunday, 5 November, 02:00:00).

30 Second Futures Session Open RangeThis indicator displays 30 second opening ranges from Globex, Europe, and RTH sessions.
From the RTH session range, it also displays infinitely generating Price Targets based on a % of the opening range size.
I am retrieving the 30 second data using the new "request.security_lower_tf()" function.
The importance of these levels is based on the idea that when the market opens, algorithms establish their positions within the first 30 seconds.
These areas can also be seen as potential areas of support and resistance throughout the sessions.
Enjoy!

Stock Data Table█ OVERVIEW
This is a table that shows some information about stocks. It is divided into four sections:
1) Correlation
2) Shares
3) Daily Data
4) Extended Session Data
The table is completely modular, which means you can add or remove each element from the settings menu, and it will automatically rearrange its spaces.
It is also highly customizable, to the extent that you can change almost any color, remove or change titles, invert section rows, and much more.
1) Correlation
The script checks if the stock is listed on NASDAQ, and if so, uses the QQQ (Nasdaq-100 ETF) as the reference index in the first cell; otherwise, it uses the SPY (S&P 500 ETF). The length of the correlation is shown in the second cell. The table then displays the correlation between the reference index and the other index, and the correlation between the reference index and the stock.
To make it easier to interpret the correlation values, each row's last cell is color-coded with a gradient to highlight the type of correlation, and the direction of the gradient can be customized.
The correlation coefficient is a statistical measure that quantifies the strength and direction of the relationship between two variables, indicating how changes in one variable are associated with changes in the other variable, so it can be used to identify patterns and trends.
If you are interested in correlation, I suggest taking a look at my dedicated indicator:
2) Shares
This feature provides you with quick access to key information about shares and market capitalization.
On one row, you can view the total shares outstanding and the market capitalization for the fiscal year or the quarterly year. The total shares outstanding represents the total number of shares of the stock that have been issued and are currently outstanding, regardless of whether they are held by insiders or public investors. The market capitalization is a widely used measure of the company's value as determined by the stock market, calculated by multiplying its current stock price with the total number of outstanding shares.
The other row shows the float, which is the number of shares of a company that are available for public trading, and the corresponding free-float market cap, calculated by multiplying the company's current stock price with the float. Because Pine Script does not allow retrieving information about quarterly year float, you can view the float and the free-float market cap of the fiscal year only. The data can be displayed at all times or only when the difference between the total shares outstanding and the float is significant enough to result in a difference between the market cap and free-float market cap.
The classification for market cap and free-float market cap is set in this way:
Mega Cap: $200 billion or more
Large Cap: between $10 billion and $200 billion
Mid Cap: between $2 billion and $10 billion
Small Cap: between $300 million and $2 billion
Micro Cap: less than $300 million
Penny Stocks: less than $5 (customizable)
Comparing the free-float market cap to the market cap can provide insights into the liquidity of a stock. In fact, if the float is relatively small compared to the total shares outstanding, it may be more difficult to find buyers or sellers, which could lead to increased volatility. On the other hand, a larger float indicates that the stock is more liquid and may be easier to trade, potentially resulting in lower volatility. However, market conditions can change quickly and significantly, especially for intraday traders, and the free-float can also change as insiders or other large shareholders buy or sell shares. Therefore, comparing the data of the fiscal year with that of the quarterly year may not provide the most up-to-date and accurate information for making trading decisions. This limitation can be mitigated by combining those data with other indicators and tools, such as technical analysis or news events, to gain a better understand of the stock's performance and potential trading opportunities.
3) Daily Data
This section is available on daily charts only due to the lack of accuracy of real-time daily data on other time frames. Here, you can view the Average Daily Volume (ADV) over a preferred time range (20 days by default), and the Daily Change, which represents the percentage difference between the closing price on two consecutive trading days.
ADV is useful in measuring the stock's volatility, as it provides an indication of how much trading activity there is in it. Generally speaking, stocks with higher trading volume tend to be less volatile than stocks with lower trading volume. High trading volume means there are more buyers and sellers actively trading the stock, which makes it easier for investors to buy and sell shares at fair prices. This increased liquidity can help to stabilize the stock price, reducing the potential for large swings in either direction. On the other hand, stocks with lower trading volume may experience greater volatility, as there are fewer buyers and sellers actively trading the stock. This can result in larger price swings, as it may be more difficult for investors to buy or sell shares at fair prices.
The daily percentage change can provide an indication of the stock's volatility, with larger values indicating greater volatility and risk. It can also be compared to that of a benchmark such an index or other stocks in the same sector, helping to determine whether the stock is outperforming or underperforming relative to them.
4) Extended Session Data
The fourth section is available on intraday charts only. This section provides two pieces of information: the Extended Session Change and the Pre-Market Volume.
The Extended Session Change indicates the percentage difference between the previous day's closing price and the latest price in the extended session. This gives you the extent and the direction of the price gap that occurred during extended trading hours.
The Pre-Market Volume shows the sum of all shares traded during the pre-market session. This can be helpful in understanding how much interest the stock gained before the market opened.
By default, the two rows will be visible at all times. They will stop updating after the end of their respective time range, and resume updating when it starts again. However, you can choose to automatically hide them outside of their time ranges.
Both the extended session and pre-market time ranges can be customized. Please note that if you select time ranges outside of the regular market session (as set by default), you must enable the extended session to view the corresponding rows.
█ GENERAL NOTES
• Total Shares Outstanding, Float, Average Daily Volume and Pre-Market Volume cells use a customizable color system based on two thresholds, to help you quickly identify whether the value is "too low/acceptable/too high" or "too low/not enough high/acceptable".
• If you cannot see certain data, that simply means it is not available.

ICT MacrosThis script allows traders to visualize the range of time when a macro (an automated series of instructions/trades from large fund traders, executed by an algorithm) will likely occur in the market. It does this by drawing vertical lines and labels on the chart at these specific times:
(Macro Open) - 9:50 AM EST
(Macro Close) - 10:10 AM EST
(Macro Open) - 10:50 AM EST
(Macro Close) - 11:10 AM EST
(Macro Open) - 1:10 PM EST
(Macro Close) - 1:40 PM EST
(Macro Open) - 3:15 PM EST
(Macro Close) - 3:45 PM EST
The theory behind the use of these macros - is that the market will either seek buy side or sell side liquidity, or seek to rebalance price at a point of interest in between the open and close of the macro. Traders who follow this theory can use that information to anticipate how price might behave.
When a macro occurs, the script draws a vertical line on the chart using a dotted line style with a user-defined color. Additionally, a label is placed above the line to indicate whether it is a Macro Open or Macro Close event.
To preserve space, the labels are abbreviated on chart - "Macro Open" (M.O.) and "Macro Close" (M.C.) for both the morning and afternoon trading sessions. The labels may be turned on/off by the user.
The script also includes alerts that can notify traders when a macro occurs. These alerts can be set to go off once per bar close, and the alert message indicates the specific macro type and time.
This script is entirely open-source, meaning that traders can read the code and modify it as needed. Credit to the foundation of this script goes to TradingView user @rickyzcarroll for his open source Strat Assistant Hour Flip script. Important changes include the specific time changes and alert function.

Take Session High/Low Alert [MsF]Japanese below / 日本語説明は英文の後にあります。
-------------------------
This indicator that displays High/Low lines for each session. The Key Levels of each session can be visually recognized, which is useful for PD Array analysis. You can display the last 3 days. Based on trinity by ICT.
The biggest feature is that the color shape of the line changes when reaching High/Low. Of course, you can also set alerts.
Unreached High/Low lines can be extended to the right. hides all timeframes over 1 hour. (alert is alive)
You can choose 4 sessions. If you only want to use 3 sessions, you can do that by setting the same session time for 2 of the 4 session settings.
About Parameter Settings
Session Time: Please set it to be a 24-hour cycle. You can also specify the time zone. The default is NY time.
Basis/Other color: The first time specified in "Session Time" in this indicator's parameter is the "Basis color". "Other color" is a line other than that.
Enable Time Lines: You can turn on/off the display of vertical lines.
High/Low color: High/Low line setting that has not been reached.
Taken color: High/Low line setting that has already been reached.
Extend Lines: Allows unreached High/Low lines to be extended to the right in the chart.
-------------------------
セッションごとのHigh/Lowをライン表示するインジケーターです。
過去約3日分を表示することができます。
最大の特徴はHigh/Low到達時にラインの色形が変わることです。もちろんアラート設定も可能です。
未到達のHigh/Lowラインは右側に延長することができます。
チャート表示がビジーとなる為、1時間を超える時間足ではすべて非表示とする仕様です。(アラートは生きてます)
セッションは4つ指定できます。
もしセッションを3つのみ使用したい場合は、4つのセッション設定の内2つに同じセッション時間を設定することで実現可能です。
■パラメータ設定
Session Time:24時間周期となるように設定してください。またタイムゾーンが指定できます。デフォルトはNY timeです。
Basis/Other color:パラメータの"Session Time"にて一番最初に指定した時間が基準=Basisとなります。Otherはそれ以外のラインとなります。
Enable Time Lines:垂直ラインの表示ON/OFFが可能です。
High/Low color:未到達のHigh/Lowライン設定となります。
Taken color:到達済みのHigh/Lowライン設定となります。
Extend Lines:未到達のHigh/Lowラインを右に延長できます。

Session LiquidityThe “Session Liquidity” TradingView indicator by Infinity Trading creates dynamic horizontal lines at the high and low points of a specified time span within the trading day. This indicator gives the user control of three separate time spans so the user can dynamically see the highs and lows of their favorite daily time spans.
Purpose
This indicator is similar to my TradingView indicator “Futures Exchange Sessions 3.0”. In that indicator the user gets control of dynamic price boxes. For me, these boxes made it difficult to spot ICT’s Orderblocks. So instead of boxes I made independently controllable lines and now I can spot ICT Orderblocks and easily identify Liquidity Pools.
Inputs and Style
Everything about the three dynamic lines can but independently configured. Start & End Times, Line Color, Line Style, Line Width, Text Characters, Text Size, Text Color can all be adjusted. The high and low lines as well as their text labels can be individually toggled on or off for maximum control.
Timezone
All of the start and end times are in EST. Additionally, each time span line needs a specific start of each day. This is controlled by a setting called “Line Start Day Timezone” where the user sets a timezone that corresponds with the start time. In general if a timespan resides within a particular Session pick the corresponding timezone. If the users line fits in the Asian Session then choose Asia/Shanghai. If the line is within the London Session then choose Europe/London. And the same goes for the New York Session.
Special Notes
If the Line Start Time is within one candle of the Start Day Timezone in the Settings, then the line/box won’t display. So choose the previous timezone
Lines only display when the timeframe is <= 30 minute
Gallery

Sessions [LuxAlgo]This indicator shows when user set sessions are active and returns various tools + metrics using the closing price within active sessions as an input. Users have the option to change up to 4 session times.
The indicator will increasingly lack accuracy when the chart timeframe is higher than 1 hour.
Settings
Sessions
Enable Session: Allows to enable or disable all associated elements with a specific user set session.
Session Time: Opening and closing times of the user set session in the hh:mm format.
Range: Highlights the associated session range on the chart.
Trendline: Returns the associated session trendline on the chart.
Mean: Returns the associated session mean average on the chart.
VWAP: Returns the associated session volume weighted average price on the chart.
Ranges Settings
Range Area Transparency: Transparency of the area highlighting sessions ranges.
Range Outline: Highlights the borders of the session range area.
Range Label: Shows the session label at the mid-point of the session interval.
Dashboard
Show Dashboard: Enables sessions dashboard on the chart.
Advanced Dashboard: Returns more information regarding user set sessions on the dashboard.
Dividers
Show Session Divider: Highlights active sessions using intervals on the bottom of the chart (this can lead to less responsive charts)
Show Daily Divider: Highlights days on the chart.
Usage
This tool is versatile and allows the user to perform a wide variety of tasks all focusing on highlighting and analyzing price movements within a specific user set session in a periodic fashion.
Significant forex trading sessions are used by default, but the users are free to choose the opening and closing time of their choices.
Using ranges can indicate which sessions returned the most volatile price movements.
Trendlines can be useful to estimate the underlying trend of a specific session, but they can also offer a quick way to see which session started a trend reversal.
The session Mean highlights the equilibrium level within a session, extrapolating these levels can provide potential support and resistances levels of interest.
Finally, users can use the sessions VWAP's for real time applications, using them as trailing supports and resistances.
Using The Advanced Dashboard
The advanced dashboard returns useful information regarding the user set sessions. Each dashboard elements are described below:
Status: Highlights whether the user set session is active (open) of inactive (closed).
Trend: Shows correlation coefficient between the session prices and a linear sequence of values. Values above 0 indicates an up-trending session, while values under 0 indicates a down-trending session. Values closer to (1, -1) indicates a more trending session.
Volume: Shows accumulated volume within the session
σ (Standard Deviation): Shows standard deviation of the session, while this value is not bounded it can be useful to compare it with the other ones to see which session was the most volatile.
Note that when a session becomes inactive the value on the dashboard will hold until the specific session becomes active again.
Session ZonesHow is this different?
After reviewing a handful of session zone based indicators I decided to create this one not seeing exactly what I wanted, even this one only comes partially to my goals. This indicator will add session coloring on the chart in a vertical orientation, up to five sessions currently can be utilized. Timezones can be supplied that are compatible with Trading View so that session times specified in settings can be non-market timezone specific. In a future update I plan to add alerts for price reaching certain sessions, styling of the session zones may change overtime as PineScript feature enhancement allows.
How to use this?
Supply session ranges, color and disable any unneeded, the table at the top right will display whether or not price action is in or out of enabled sessions.
Which market is it meant for?
Any market.
What market conditions does this apply to?
Any condition.

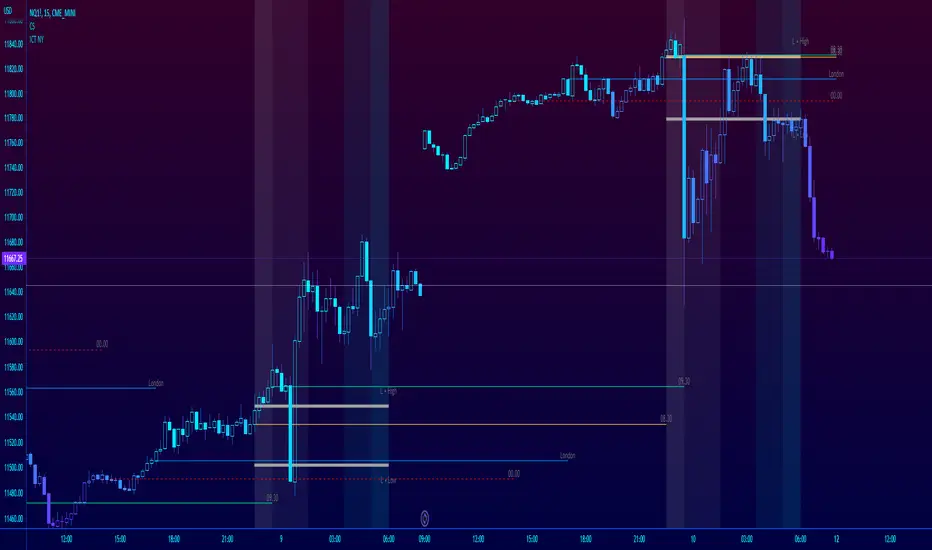
ICT NY Futures Indices Session Model - YT New York MentorshipThis indicator plots out the time periods and open lines as outlined in ICT's 2022 Mentorship and is designed specifically for the New York futures trading session.
Time zone is set to GMT-4 (NY) by default but can be changed for accommodate daylight saving in the menu.
Please note this indicator is to be used only on the 30min timeframe and below.
Here are its features:
The background color shows the morning session, in two parts (8.30am to 9.30am and 9.30am to 11.30am), then a two hour gap for lunch (ICT calls this "Dead time") and finally, the afternoon session, also to two (1.30pm to 3pm and 3pm to 4pm).
It not only shows the current killzones, but future zones as well.
These times are important; trades can be framed within these zones as taught in the mentorship.
Next are the open lines. These lines are automatically plotted and can be areas for price to react off of; they are the opening price of a candle at these times:
00.00 (New York Midnight, also known as "True Day Open")
8.30am (New York Equities pre-open)
9.30am (New York Equities open)
2.00am (London Stock Exchange open)
And lastly, London's trading session High and Low are projected forward onto the New York trading session.
These two price points are areas of liquidity that were pooled during London, but they can also often set the high or low of the day.
Please let me know if there are any bugs or if you have suggestions for the next update.
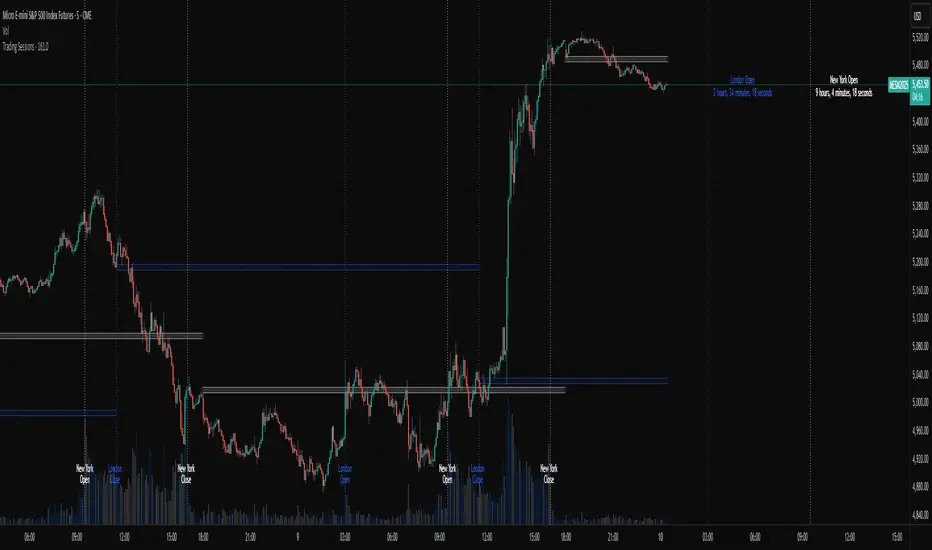
Trading SessionsThis indicator has the following base features:
Plots the session breaks of the Tokyo, London, and New York trading hours.
Plots the lunch break locations of the Tokyo session.
Plots the previous closes at the end of the Tokyo, London, and New York sessions. The New York previous close can optionally use the settlement close value from the exchange.
Plots a countdown and time location of the next session open and close for the Tokyo, London, and New York sessions.
By default, all sessions are prescribed in their local time zone. Daylight savings time is also accounted for. This makes the plots operate as expected no matter what your own local time zone setting is in Trading View.
VWAP Market Session AnchoredVWAP Market Session Anchored differs from the traditional VWAP or VWAP Auto Anchored indicator in that the Volume Weighted Average Price calculation is automatically anchored to four major market session starts: Sydney, London, Tokyo, New York.
Settings
Source: the source for the VWAP calculation.
Offset: changing this number will move the VWAP either Forwards or Backwards, relative to the current market. Zero is the default.
Band: enabling this will show Standard Deviation bands.
Band Multiplier: the value the Standard Deviation bands will be multiplied by before being plotted on the chart.
Sessions : enabling the sessions will plot the respective anchored VWAP on chart.
Custom: enabling this will show a custom user-defined session.
Custom UTC : the custom session is defined by a starting UTC hour followed by the ending UTC hour.
Usage
Similar to the traditional VWAP, VWAP Market Session Anchored is a technical analysis tool used to measure the average price weighted by volume. VWAP Market Session Anchored can be used to identify the trend during a specific market session.
Limitations
When setting a custom session, be mindful that calculations are based off of the Coordinated Universal Time (UTC) time, you must convert your local time zone to UTC in order to have an accurate representation of your custom session.
It is not recommended to use this indicator on timeframes above 1 hour as market sessions only last a few hours.