Volume Directional OscillatorVolume Directional Oscillator is an indicator that combines several types of metrics for a convenient understanding of price movements.
The indicator displays a histogram of red, dark red, green, dark green and yellow columns, as well as a red-green line.
Red columns indicate an increase in selling volumes as the price moves.
Dark red indicates a decline compared to the previous candle.
Green indicates an increase in buy volumes.
Dark green indicates a decline from the previous candle.
Yellow columns appear when the market moves without volume, in other words, by inertia.
The red-green line passing through the tops of the columns indicates that buyers or sellers currently prevail. Green are buyers and red are sellers.
It is also possible to display overbought and oversold levels. By default, they correspond to the values 50 and -50. When the indicator goes beyond one of the levels, the background turns orange. Line and background colors can be changed in the settings.
Also, the indicator can be used to determine divergences and convergences and use them in a trading strategy.
-------------------------------------------
Volume Directional Oscillator - индикатор осциляторного типа, который объединяет в себе несколько видов показателей для удобного понимания движения цен.
Индикатор отображает гистограмму из красных, темно-красных, зеленых, темно-зеленых и желтых полос, а также красно-зеленую линию.
Красные полосы обозначают увеличение объемов на продажу по мере движения цены.
Темно-красные обозначают снижение, по сравнению с предыдущей свечой.
Зеленые обозначают увеличение объемов на покупку.
Темно-зеленые обозначают снижение, по сравнению с предыдущей свечой.
Желтые полосы появляются, когда движение рынка происходит без объёма, другими словами — по инерции.
Красно-зеленая линия проходящая через вершины полос указывает на то, покупатели или продавцы в данный момент преобладают. Зеленая — покупатели, а красная — продавцы.
Еще есть возможность отобразить уровни перекупленности и перепроданности. По умолчанию, они соответствуют значениям 50 и -50. Вы выходе индикатора за один из уровней, фон окрашивается в оранжевый. Цвета линий и фона можно изменить в настройках.
Также, по индикатору можно определять дивергенции и конвергенции и использовать их в торговой стратегии.
Signals

Negative Correlation SignalsThank you to Hendrik Fuchs who coded this for me - I highly recommend you...
The AUDUSD/EURUSD has a negative correlation with the DXY as does the GBPJPY/USDJPY have with the JPYX. This indicator is very simple and uses opposite candle pinbars (pinbar/doji structure can be set by you) of the two instruments on the chart whilst the stochastic RSI should be above 80 for overbought on the one but below 20 on the other for oversold (or vice versa) to generate a signal.
This indicator works as follow:
1. Choose an instrument that has an opposing negatively correlated instrument (EURUSD & DXY, GBPJPY & JPYX, US100 & VIX, etc.)
2. Add indicator to the chart and open settings.
3. Open the settings and add the correct instruments (default is set to GBPJPY & JPYX).
4. Enter your desired Stochastic RSI & candle formation settings.
You will see buy and sell signals appear on the charts. Alerts are possible (Any alert() function call). Does not repaint after close of candle. Better on higher timeframes but can also be used for scalping. Best used as confluence or as part of a trend trading system.
There are obviously many many variations that I have not even thought off - please let us know in the comment section if you find settings/timeframes/instruments that work particularly well.

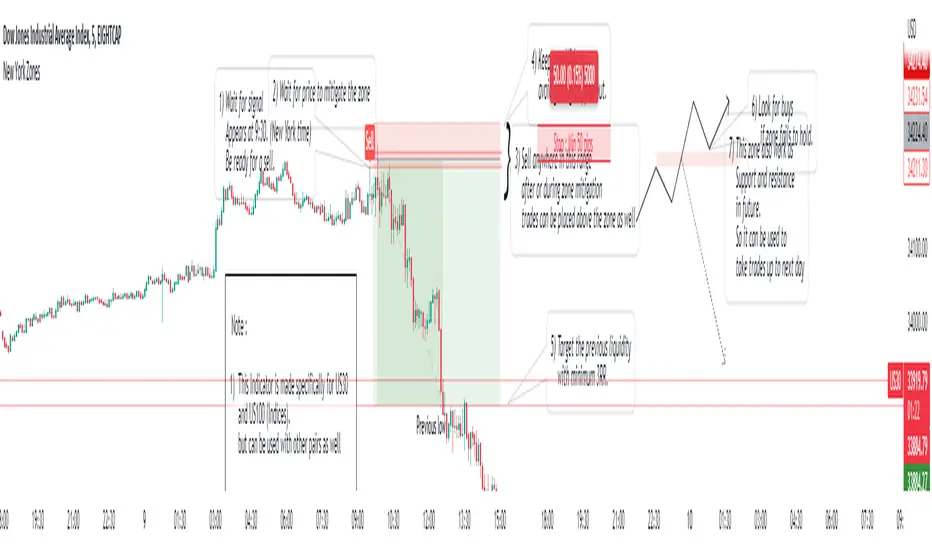
New York ZonesHello traders, here is a indicator which is based on a strategy I found on a forum. I hope you will find it useful.
Rules to Follow:
1) Wait for signal . Signal appears at 9:30. (New York time)
2) Wait for price to mitigate the zone
3) Sell anywhere in this range after or during zone mitigation.
4) Keep stop Wide to avoid getting stopped out.
5) Target the previous liquidity with minimum 3RR.
6) Look for opposite trade if zone fails to hold , with proper analysis
Note :
1) This Indicator is made specifically for US30 and US100 (Indices) but can be used with other pairs as well (need back testing)
2) I would not recommend to place the trade right away as soon as signal appears , wait for liquidity to be taken out and place a trade after confirmation.
3) Trades can be placed below the zone as well but the probability of entry may decrease ,while increasing the accuracy.
4) Use timeframe <= 5 min to take entries.
Trade scenarios
Perfect trade :
Price failed to hold, you got stopped out and market changes direction :
Price respect zone in future:
How To Limit Repeating SignalsAn example of how to limit the input number of allowed signals using a function containing a condition counter with a reset.

Fibonacci Step IndicatorThe Fibonacci Step Indicator assumes irregularity in calculating a moving average. It is measured as the mean of the previous lows and highs situated at Fibonacci past periods. For example, the mean of the lows from 2, 3, 5, 8, etc. periods ago form the Fibonacci step indicator.
The indicator uses the formula for the first twelve Fibonacci numbers on highs and lows so that it creates a moving support/resistance zone. Afterwards, the zone is stabilized by taking the highest highs of the upper indicator and the lowest lows of the lower indicator part.
The indicator is used as a trend following way. It can be compared to the Ichimoku Kinko Hyo cloud (without the future projection). The zone form a support and resistance area. During ranging periods, the market will fluctuate within the area which is a bad time to follow the trend (if any).

Cloak & Dagger Heikin-ashiThis indicator is intended to reduce market noise by averaging "Heikin-ashi" a few more times.
You can set the number of averages and how the closing price is calculated.
The Modes:
There are several presets.
The "Mode 1" is more conservative and flips fewer times, but with less noise.
(Averaged by 5 times, Close calculated by oc2)
The "Mode 2" is more aggressive, with more flips and faster timing.
(Averaged by 10 times, Close calculated by ohlc4)
Triggers:
Triggers the inversion of the bar. It can be visualized and alerts can be set.

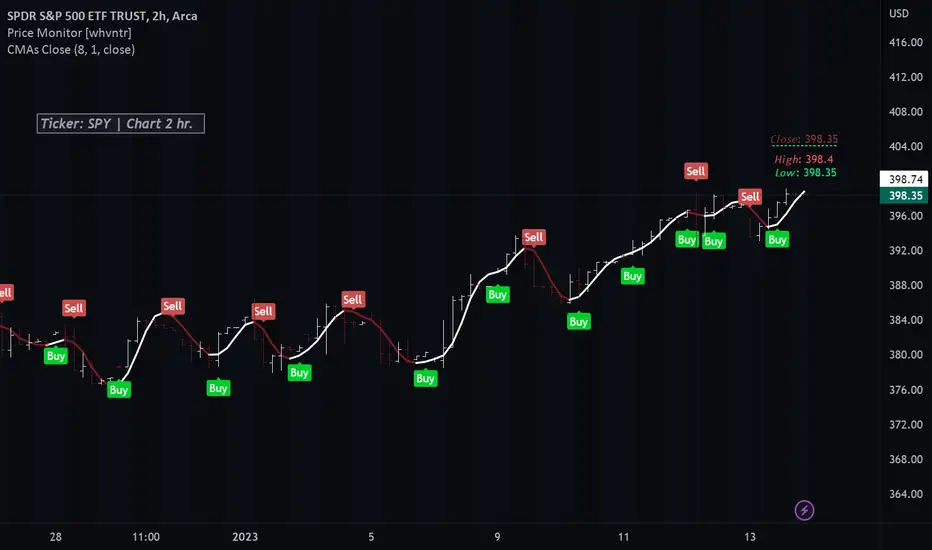
Colored Moving Averages With Close Signals[Whvntr][TradeStation]Plots the first time the close price is above or below the colored portion of the chosen MA. The MA's formula is from TradeStation's indicator: "Colored Moving Averages Can Help You Spot Trends" . I modified that indicator with customizations that include: Buy and Sell signals. Each time the current bar closes above the MA, while it's red (bearish), there's a Sell label at the start of that MA trend. Likewise: each time the current bar closes below the MA, while it's white (bullish), there's a Buy label at the beginning of that MA trend. You can now, also, easily see which MA you are selecting by hovering your cursor over the tooltips icon. I've included a modified Hull MA as default because I've found this SMA combination with the WMA to be a very smooth oscillation. I've also added some different types of MA's. Colored moving averages are helpful to determine when a trend may be reversing.
MA's
1 · Modified Hull MA: (SMA of the WMAs Hull Formula)
2 · Hull MA
3 · Exponential Moving Average
4 · Weighted Moving Average
5 · RMA Moving Average used in RSI
6 · Volume Weighted MA
7 · Simple Moving Average
This indicator isn't endorsed as a guarantee of future, favorable, results.
Swing Rapat Jik ( LOW-HIGH ) Smart Money TrendBandSWING RAPAT JIK ( LOW-HIGH ) Smart Money TrendBand
( 2023 updated edition )
The Swing Rapat Jik indicator is a method of knowing whether the current market is either at the highest or the lowest price.
It is also a relatively less risky strategy and suitable for long-term traders such as swing traders.
The analysis tool used is based on the Relative Strength Index ( RSI ) indicator as a parameter to measure the lowest price and the highest price in each cycle. If the price is at the extremely oversold level, then it shows the lowest price signal (LL/HL). Vice versa, if the price is at the extreme overbought level, then the signal will show the highest price signal (HH/LH).
It should be noted that this indicator is a repaint where it will make a re-mark if the price is at the lowest level of the previous signal. So, the solution is that I’ve added the Moving Average parameter as confirmation of the reversal of the LL price to the uptrend. That means the signal to enter the market only occurs when there is an Entry Price (EP) signal after LL/HL signal appears.
Please, do not enter the market when the EP signal is released if the LL/HL signal is not yet released. Make sure these two signals come out consecutively, starting with HL/LL and then the EP signal.
Key Signal;
LL = LOWER LOW
HL = HIGHER LOW
HH = HIGHER HIGH/TAKE PROFIT
LH = LOWER HIGH/TAKE PROFIT
EP = ENTRY PRICE
Hopefully, it can help traders to track the price at the lowest level before making a reversal and the highest price during the market supply situation.
*So far, the invention of the entry market is for the stock market only, which is to use buy signals only. Any updates for other markets will be notified from time to time.
Major updates;
1. Update version to Version 5 pine script
2. variable value used for the EP signal, to obtain a more significant weighted value.
3. Change of label color
4. Colored bars- bullish and bearish trends detected
SOPs and strategies
colored bars are pointers of the current trend and the period in which it occurred.
Use this combination as a strong confirmation
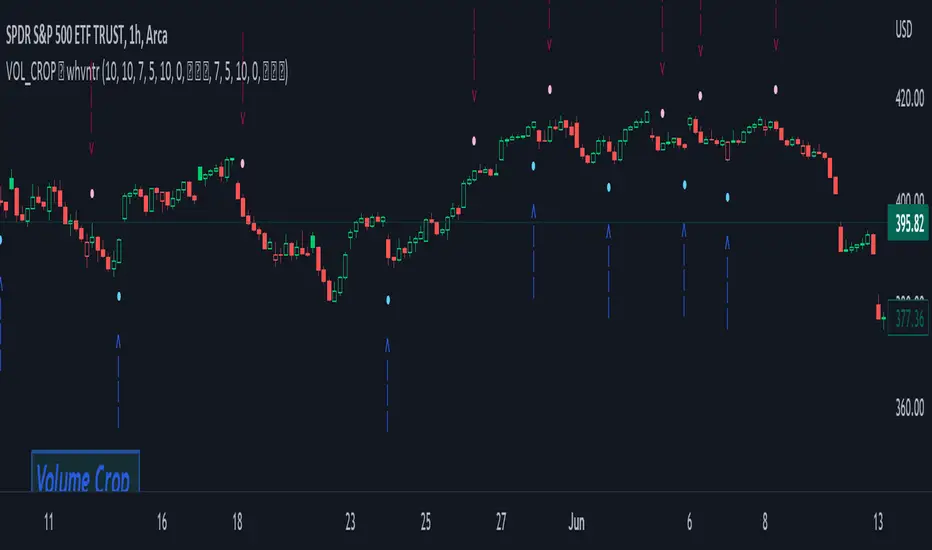
Volume Crop ━ Hidden Volume Divergence [whvntr] Volume Divergence
• Formula originated from: "Hidden Price Divergence" (circles) by TheLark. I did two things to harness its
effectiveness:
• Firstly, I developed a unique way to filter out the divergence signals that were appearing on both sides of the
midline. This filter will be known as the "Midline Tool" . It filters out a lot of the false signals commonly
associated with oscillators.
• Then, I modified the default format from Price to Volume.
• The midline formula "Midline Tool" was developed by me . It adjusts in the thousands since it's volume.
Let me know in the comments if you would rater have a smaller step value than 10,000. How does it work?
Crossover then Crossunder, the arrows only appear during the first sign of hidden volume divergence once
crossing the midline. Normally, these signs appear on both side of the midline both bearish and bullish no
matter if it's on an oversold or overbought side of the spectrum... Also, let
me know in the comments if you would like for me to release an oscillator version of this
indicator for co-witnessing.
Features:
• Volume divergence
• Midline Tool©
• Disclaimer: This indicator does not constitute investment advice. Trade at your own risk with the investments
you can afford to lose because all financial investments have risks and this is not a
guarantee that the volume divergence will be 100% all the time.
Bender Stochastic MTF With Buy & Sell SignalsA stochastic indicator is a technical analysis tool that uses random data points to forecast price changes in a financial security. It compares the closing price of a security to its price range over a set period of time. The indicator is designed to indicate when a security is overbought or oversold by comparing the closing price to the price range over a certain number of periods. A stochastic indicator can be used to identify potential buying or selling opportunities. It is often used in conjunction with other technical analysis tools to provide a more comprehensive analysis of market conditions.
Configurable Indicator Signals
Signal on k & d Stochastic Line Crosses
Invalidate Signal if not in a overbought or oversold pressure zone
Invalidate signal on neutral zone breach
Invalidate signal on reverse cross
Invalidate signal after a user set number of bars
Delay signal until the cross is considered strong by calculating the distance between the stochastic lines the a user set threshold
Please Note:
This indicator is also embedded in the Bender Bot strategy script. Signals and confluence identified by this indicator can be used to autonomously mange strategies. The below settings will not have any effect on this indicator's functionality when used as a stand alone indicator.
Bender Bot Strategy Confluence
Close any open trade on reverse k & d Stochastic line crosses
Require any signal and Stochastic directional confluence before opening any trade
Require any signal and Stochastic pressure to be in confluence before opening any trade
Require any signal to be in directional confluence with the Stochastic signal

Bender Filtered MA Cloud with Buy Sell SignalsBender MA Cloud is a powerful indicator that uses two moving averages filtered by standard deviation to create a "cloud" on the chart. The upper and lower bounds of the cloud could be key levels of support and resistance, and the indicator plots lines on the chart that reflects the average price of the stock over a specified period of time. The standard deviation is used to filter out noise and identify significant trends. Bender MA Cloud also generates signals based on the direction changes of the fast moving average, crosses of the cloud, and breaches of the cloud boundaries. This indicator is a useful tool for traders who want to make informed decisions based on reliable market trends and anticipate potential trade opportunities. (Video Demo Coming Soon)
Configurable Indicator Signals
Signal on :
Pullbacks
A pullback begins when the fast MA1 line changes direction and moves opposite to the cloud. The pullback is confirmed when the fast MA1 line returns to the direction of the cloud on the close of the bar. These signals can be fine-tuned using the invalidation settings below.
Breaches
A breach is signaled when the price closes beyond the slow MA2 line in the opposite direction of the cloud. These signals can be optimized using the invalidation settings.
Crosses
A cross is signaled by a change in the direction of the cloud. The strength of the cross can be evaluated using the settings below..
Signal Filters
Confirmed pullbacks allowed after a cross
The number of confirmed pullbacks allowed after a cross can be set using this option. If the number of confirmed pullbacks since the last cross exceeds the specified value, the pullback signal will be invalidated.
Allowed Number of bars in Pullback
The pullback signal is considered invalid if the specified number of bars form within the pullback without a reversal occurring. This limits the number of bars allowed in the pullback.
Invalidate Pullback if price breaches the slow MA2
The pullback signal is considered invalid if the price crosses the slow MA2 during the pullback. This indicates that the trend may be reversing and the signal is no longer reliable.
Require Strong Cloud During Pullback
This option allows you to invalidate the pullback signal if the cloud is not considered strong using the ATR strength threshold. This can help to ensure that the signal is reliable and accurate..
Require Strong Cross. _ look-back bars.
This option allows you to invalidate the cross signal if the cloud is not considered strong over a specified number of look-back bars. The strength of the cloud is measured using the ATR strength threshold, and the signal will be invalidated if the cloud is not considered strong. This can help to ensure that the signal is reliable and accurate..
Strength Threshold ATR Length
This option allows you to specify the ATR length that should be used to gauge the strength of the cloud. Keep in mind that the ATR is a dynamic measure, so if there is a spike in the ATR, the cloud strength calculations will also change. This can affect the reliability and accuracy of the signals generated by the indicator.
Cloud Size Must Be _ times the size of the Threshold ATR to be considered strong
This option allows you to specify the minimum size that the cloud must be relative to the Threshold ATR in order to be considered strong. If the distance between the fast MA1 and the slow MA2 is less than the specified value multiplied by the Threshold ATR, the cloud is considered weak. For example, if the cloud size is not at least 2 times the ATR, it will be considered weak.
This indicator is also incorporated into the Bender Bot strategy script and can be used to autonomously manage strategies based on signals and confluences identified by the indicator. When used as a standalone indicator, the features below will not affect the indicators functionality.
Bender Bot Strategy Confluence
Require Signal Confluence before opening any position
This option requires that all of the signal conditions are met before opening any position. If all conditions are satisfied, the signal will remain "Long" or "Short" until it is invalidated.
Require MA Cloud Directional Confluence before opening any position
This option requires that the direction of the cloud (either "Long" or "Short") is in agreement before opening any position. The direction of the cloud changes on crosses.
Close Position if Pullback is started
This option closes the position if a pullback is started and causes the fast MA1 line to change direction and oppose the open position.
Please feel free to contact me if there are any questions

[LazyBear] SQZ Momentum + 1st Gray Cross Signals ━ whvntrI have modified LazyBears Squeeze Momentum Indicator with enhancements, plus added signals
LazyBear mentioned that in John F. Carter's book, Chapter 11, "Mastering the Trade", that "Mr. Carter suggests waiting till the first gray after a black cross, and taking a position in the direction of the momentum (for ex., if momentum value is above zero, go long). Exit the position when the momentum changes (increase or decrease --- signified by a color change)." I have done just that. Now at each "first gray after a black cross", there are now Bearish and Bullish signals.. The signals only appear in the direction of the momentum.
Disclaimer: This indicator does not constitute investment advice. Trade at your own
risk with this method of identifying changes in stock market momentum.

SignalBuilderSignalBuilder
Utility for building a collection of signal values. Provides a default view for displaying signals.
Simplified API for aggregating signal values.
Flexible for use with indicators and strategies.
See the demo section for an example.

Auto Trend Lines Breakouts and Bounces Signals and AlertsAuto Trend Lines Breakout with Confirmation Bounce Signals and Alerts
This indicator draws trend lines automatically based on the 2 pivot points, which are calculated based on the specified number of bars (length), which is of course customizable. The indicator then shows you when these trend lines get touched (potential bounce) or “almost touched” (Yes! The script can do that as well!) by the current price of the instrument or broken and then confirmed by the “after break come back touch” – classic! Everything is shown on the chart, and for everything - alarms can be set up with just a few clicks!
Now there are 2 modes here (you can hide all signals as well and just use the trend lines):
1) Current/recent trend lines only: will only show 2 current upper/lower trend lines as well as previous 2 for reference.
2) All time (historical) trend lines: will show 2 current upper/lower trend lines as well as the historical lines from the past and these lines are often very respected by the price!
Besides that, you can set the indicator to show you exactly what you want: Just the trend lines touches/bounces, breaks with confirmation touches/bounces or BOTH.
In addition to that, you can set the indicator to only show you these touches/bounces and breaks with additional confirmations, only if confirmed by :
- Moving Average (customizable length): LONG signals based off the trend lines will only be shown if above EMA, SHORT if below.
- Signals where the candle color confirms the direction of the trade, but the candle type is opposite (like a green colored bearish hammer for example) will be avoided (such candles can be very uncertain/deceptive)
- Signals where the signal candle is doji will be avoided (uncertain)
- Signals will only be shown if supported by the trend line slope (for example, with this feature turned on, if there is an upper line trend line, but the line is actually above, touching the top of the candles and the price touches/crosses it or it gets broken – there will be no signal as even though the trend line is an upper line above candles, it’s slope is positive (going up), if the slope would be down, like a classical down/bearish trend line and the price touches/bounces off it or the line gets broken, only then the indicator will show the signal/alert.
- OFFSET: this one is really cool! With this feature you can hunt these conditions when the price comes very near the trend line, but never touches it. With this setting turned on, with a correct offset amount – you will be able to catch these! You will need to play around with the offset amount, depending on the timeframe/instrument, be quick-n-easy!
The indicator also includes Round Number lines on the chart, which are customizable for any instrument. As you know round numbers are appreciated by the price and can be very nicely used with this indicator looking for combos or using trend lines for signals, while round numbers as partial profit price targets or stop-loss areas.
Important economic events are also shown on the chart as red vertical lines (during these events, volatility can suddenly spike, so it’s best to stay away from trading!)
This is a very powerful indicator with plenty of customizations to find the best approaches, can be used for any instrument and on any timeframe! Awesome for scalping and could be used with swing trading as well! Enjoy!
To add the alerts
-Right-click anywhere on the TradingView chart
-Click on Add alert
-Condition: Auto Trend Lines Breakout with Confirmation Bounce Signals and Alerts
-Alert name: DO NOT TOUCH THIS
-Hit “Create”
-Note: If you change ANY Settings within the indicator – you must DELETE the current alert and create a new one per steps above, otherwise it will continue triggering alerts per old Settings!
A few strategies how this indicator can be used (these were actually tested and showed awesome results!):
1) Bounce Scalping: Simply hunting bounces off the trend lines. Often the price will slightly cross the trend line and then immediately bounces from it for nice little price move, which is great for scalping or if you for example take 2/3s off the position and leave the remaining, often with such bounces – the price may reverse from the trend line and go in the opposite direction considerably.
2) Break-Bounce-Confirm: this is the “Breaks with Confirmation Bounce” option of the script which fully automates the classical trend lines break confirmation, where the trend line is broken (which could be a fake out), so you wait for a touch/bounce of that trend line back from the initial break and open the position right there or wait and see if after the touch/bounce back, the price once again goes into the direction of the break.
For stop-loss and take-profit areas, you can use:
1) Pivots (these are marked with red and green crosses on the chart), which are used to draw the actual trend lines.
2) The actual trend lines themselves (if one gets broken + confirmation, you can set your stop-loss if that same line gets broken again in the opposite direction | similar for take-profit, you can take profit or partial profit at next trend line on the chart if the price reaches it.
3) Use the Round Numbers included, for example: use the closest round number as a visual soft stop-loss and the furthest one away as a visual soft take-profit.
You can try combining this indicator with divergence, stochastic, Bollinger bands, pretty much anything!
If you wish to try this out for a week or so – please reach out and I will give you access.

[-_-] Volatility Calibrated ATRDescription:
An indicator based on ATR adjusted for volatility of the market. It uses Heikin Ashi data to find short and long opportunities and displays a dynamic stop loss level. Additionally, it has alerts for when the trend changes (which is an entry signal).
How it works:
It works by dynamically calculating the Period for ATR which depends on current volatility level that is calculated by a function that uses Standard Deviation of price. ATR is then smoothed by Weighted Moving Average and multiplied by ATR Factor, resulting in a plot that changes its colour to red when we're in a downtrend and green when in an uptrend. This plot should be used as a dynamic Stop Loss level. Trend change is determined by price crossing the dynamic Stop Loss level. The squared red and green labels appear when the trend changes, and should be used as Entry signals.
Parameters:
- Source -> data used for calculations
- ATR Factor -> higher values produce less noise and longer trends, lower values give more signals

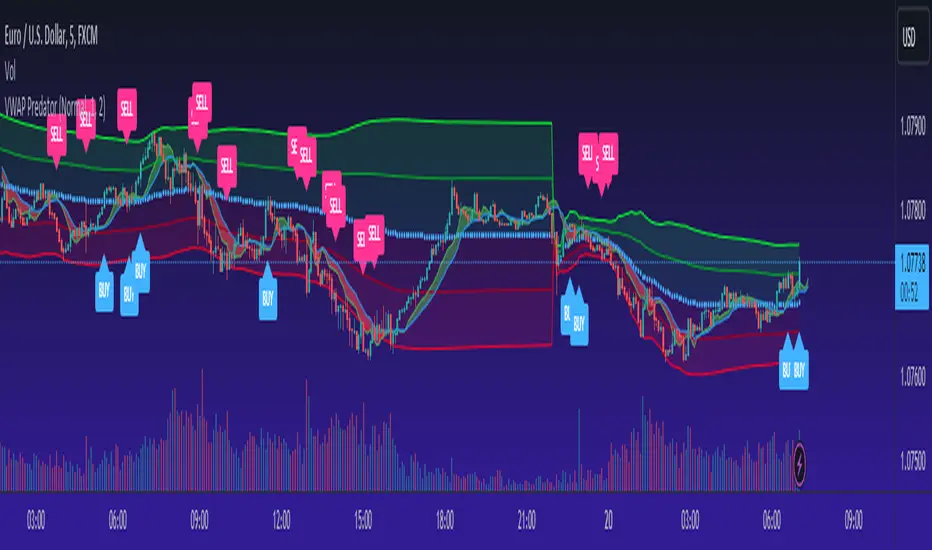
VWAP PredatorUsing VWAP as a start point, the VWAP Predator uses proprietary Fibonacci bands to help determine signal criteria. Most traders use VWAP in a simple way to determine whether an instrument is in a bearish or bullish state, but that doesn't help choosing the correct time to go long or short.
The xBat VWAP Predator uses behavioural analysis with volume, price action with open and close proximities to the Fibonacci bands/zones (Fib Zones). The following describes how the xBrat VWAP Predator is different to any standard use of Volume Weighted Average Price and uses xBrat Proprietary Behavioural logic to determine high probability long and Short signals. All of this heavy lifting and logic is done behind the scenes, keeping traders charts clean.
Long Trading Signals - Candle Coloured in Blue - There are many states with the logic to produce these signals, which are briefly described below:
1. The only standard criteria here - The price action must be above the VWAP Line
2. The Price must open below the boundary of one Fib Zone and close into the next Fib Zone
3. That Same Candle has to be an Accumulation Candle (more volume than the preceding candle and More Buyers) - This is determined with our proprietary logic coding
4. The Same signal candle also has to be higher than average volume. Again, our proprietary xBrat Logic just doesn't look back over a set number of bars, it looks at times of day and day of week, plus more to determine a true valuation of higher, lower or equal to average volume.
5. Only when these states are met, plus two more ema proximity logic, Does the xBrat VWAP predator give a Long Signal.
6. Trade Management is either set targets or indeed a simple ema cross which we provide as a ribbon on the chart to help traders. These ema's are different to entry logic. When the Ribbon turns from green to red, the trader should consider exiting the trade
Short Trading Signals - Candle Coloured in Pink - There are many states with the logic to produce these signals, which are briefly described below:
1. The only standard criteria here - The price action must be below the VWAP Line
2. The Price must open above the boundary of one Fib Zone and close into the next Fib Zone
3. That Same Candle has to be a Distribution Candle (more volume than the preceding candle and More Sellers) - This is determined with our proprietary logic coding
4. The Same signal candle also has to be higher than average volume. Again, our proprietary xBrat Logic just doesn't look back over a set number of bars, it looks at times of day and day of week, plus more to determine a true valuation of higher, lower or equal to average volume.
5. Only when these states are met, plus two more ema proximity logic, Does the xBrat VWAP predator give a Short Signal.
6. Trade Management is either set targets or indeed a simple ema cross which we provide as a ribbon on the chart to help traders. These ema's are different to entry logic. When the Ribbon turns from red to green, the trader should consider exiting the trade.
VWAP Predator is a day trading and scalping signals trading indicator.
Wunder Trend Reversal botWunder Trend Reversal bot
1. Wunder Trend Reversal Bot - this has only one goal to find a reversal of the trend.
2. The strategy determines, based on the specified value for the filter, a market reversal based on the price actions of the previous bars.
3. A short EMA is used to filter false signals after the reversal signal was received. Crossing the EMA and changing its direction confirms the trend change.
4. There are 2 ways to calculate stop loss and take profit. You can choose one of them:
- Classic stop loss and take profit in a fixed percentage
- ATR stop loss and take pro
5. ATR uses risk reward (R:R) to calculate take profit. The script calculates the risk-reward based on a certain stop loss level and uses it to calculate the take profit
6. A function for calculating risk on the portfolio (your deposit) has been added to the script. When this option is enabled, you get a calculation of the entry amount in dollars relative to your Stop Loss. In the settings, you can select the risk percentage on your portfolio. The loss will be calculated from the amount that will be displayed on the chart.
For example. Deposit - $1000, you set the risk to 1%. SL 5%. Entry volume will be $200. The loss at SL will be $10.10$ this is your 1% risk or 1% of the deposit.
Important! The risk per trade must be less than the Stop Loss value. If the risk is greater than SL, then you should use leverage.
The amount of funds entering the trade is calculated in dollars. This option was created if you want to send the dollar amount from Tradingview to the exchange. However, putting your volume in dollars you get the incorrect net profit and drawdown indication in the backtest results, as TradingView calculates the backtest volume in contracts.
To display the correct net profit and drawdown values in Tradingview Backtest results, use the ”Volume in contracts” option.

LuxAlgo - Backtester (S&O)The S&O Backtester is an innovative strategy script that encompasses features + optimization methods from our Signals & Overlays™ toolkit and combines them into one easy-to-use script for backtesting the most detailed trading strategies possible.
Our Signals & Overlays™ toolkit is notorious for its signal optimization methods such as the 'Optimal Sensitivity' displayed in its dashboard which provides optimization backtesting of the Sensitivity parameter for the Confirmation & Contrarian Signals.
This strategy script allows even more detailed & precise backtests than anything available previously in the Signals & Overlays™ toolkit; including External Source inputs allowing users to use any indicator including our other paid toolkits for take profit & stop loss customization to develop strategies, along with 10+ pre-built filters directly Signals & Overlays™' features.
🔶 Features
Full Sensitivity optimization within the dashboard to find the Best Win rates or Best Profits.
Counter Trade Mode to reverse signals in undesirable market conditions (may introduce higher drawdowns)
Built-in filters for Confirmation Signals w/ Indicator Overlays from Signals & Overlays™.
Built-in Confirmation exit points are available within the settings & on by default.
External Source Input to filter signals or set custom Take Profits & Stop Losses.
Optimization Matrix dashboard option showing all possible permutations of Sensitivity.
Option to Maximize for Winrate or Best Profit.
🔶 Settings
Sensitivity signal optimizations for the Confirmation Signals algorithm
Buy & Sell conditions filters with Indicator Overlays & External Source
Take Profit exit signals option
External Source for Take Profit & Stop Loss
Sensitivity ranges
Backtest window default at 2,000 bars
External source
Dashboard locations
🔶 Usage
Backtests are not necessarily indicative of future results, although a trader may want to use a strategy script to have a deeper understanding of how their strategy responds to varying market conditions, or to use as a tool for identifying possible flaws in a strategy that could potentially be indicative of good or bad performance in the future.
A strategy script can also be useful in terms of it's ability to generate more complete & configurable alerts, giving users the option to integrate with external processes.
In the chart below we are using default settings and built-in optimization parameters to generate the highest win rate.
Results like the above will vary & finding a strategy with a high win rate does not necessarily mean it will persist into the future, however, some indications of a well-optimized strategy are:
A high number of closed trades (100+) with a consistently green equity curve
An equity curve that outperforms buy & hold
A low % max drawdown compared to the Net Profit %.
Profit factor around 1.5 or above
In the chart below we are using the Trend Catcher feature from Signals & Overlays™ as a filter for standard Confirmation Signals + exits on a higher timeframe.
By filtering bullish signals only when the Trend Catcher is bullish, as well as bearish signals for when the Trend Catcher is bearish, we have a highly profitable strategy created directly from our flagship features.
While the Signals & Overlays features being used as built-in filters can generate interesting backtests, the provided External Sources can allow for even more creativity when creating strategies. This feature allows you to use many indicators from TradingView as filters or to trigger take-profit/stop-loss events, even if they aren't from LuxAlgo.
The chart below shows the HyperWave Oscillator from our Oscillator Matrix™ being used for take-profit exit conditions, exiting a long position on a profit when crossing 80, and exiting a short position when crossing 20.
🔶 Counter Trade Mode
Our thesis has always firmly remained to use Confirmation Signals within Signals & Overlays™ as a supportive tool to find trends & use as extra confirmation within strategies.
We included the counter-trade mode as a logical way to use the Confirmation signals as direct entries for longs & shorts within more contrarian trading strategies. Many traders can relate to using a trend-following indicator and having the market not respect its conditions for entries.
This mode directly benefits a trader who is aware that market conditions are generally not-so-perfect trends all the time. Acknowledging this, allows the user to use this to their advantage by introducing countertrend following conditions as direct entries, which tend to perform very well in ranging markets.
The big downfall of using counter-trade mode is the potential for very large max-drawdowns during trending market conditions. We suggest for making a strategy to consider introducing stop-loss conditions that can efficiently minimize max-drawdowns during the process of backtesting your creations.
Sensitivity Optimization
Within the Signals & Overlays™ toolkit, we allow users to adjust the Confirmation Signals with a Sensitivity parameter.
We believe the Sensitivity paramter is the most realistic way to generate the most actionable Confirmation Signals that can navigate various market conditions, and the Confirmation Signals algorithm was designed specifically with this in mind.
This script takes this parameter and backtests it internally to generate the most profitable value to display on the dashboard located in the top right of the chart, as well as an optimization table if users enable it to visualize it's backtesting.
In the image below, we can see the optimization table showing permutations of settings within the user-selected Sensitivity range.
The suggested best setting is given at the current time for the backtesting window that's customizable within the indicator. Optimized settings for technical indicators are not indicative of future results and the best settings are highly likely / guaranteed to change over time.
Optimizing signal settings has become a popular activity amongst technical analysts, however, the real-time beneficial applications of optimizing settings are limited & best described as complicated (even with forward testing).
🔶 Strategy Properties (Important)
We strongly recommend all users to ensure they adjust the Properties within the script settings to be in line with their accounts & trading platforms of choice to ensure results from strategies built are realistic.
🔶 How to access
You can see the Author's Instructions below to learn how to get access on our website.

MAGISTR Binary 3 EURUSD 1min The indicator is designed for use in binary options trading.
Designed for TF 1 minute, EURUSD pair (tested on Currency.com exchange instrument).
When the rules of the internal algorithm are triggered, the indicator generates a signal with the probable movement of the instrument on the next bar:
if a green bar appears at the bottom of the bar, it means that the indicator assumes that the next bar should close at a positive price growth value (it will be green) and vice versa, if a red bar appears at the bottom of the bar, then the indicator assumes that the next bar should close at a negative price growth value( will be red), the indicator also generates appropriate alerts about the expected price movement on the next bar.
In addition, the indicator counts the signals issued by it and the success of its processing for the period of time available in TradingView.
This indicator uses a set of values of such basic indicators as:
- Stochastic RSI;
- Bollinger Bands;
- Profile of Volumes;
- CCI;
- ADX;
- momentum;
and others.
I left all the settings "open", so it is quite possible, by slightly changing the parameters, to adjust it to another pair or time frame.
==========================================================================================================================
Индикатор разработан для применения в торговле на бинарных опционах.
Разработан для ТФ 1 минута, пара EURUSD (оттестирован на показателях инструмента биржи Currency.com).
При сработке правил внутреннего алгоритма - индикатор выдает сигнал с вероятным движением инструмента на следующем баре :
если появилась зеленая полоса внизу бара - значит индикатор предполагает, что следующий бар должен закрыться в положительном значении роста цены ( будет зеленым) и наоборот, если появилась красная полоса внизу бара - значит индикатор предполагает, что следующий бар должен закрыться в отрицательном значении роста цены( будет красным) , также индикатор выдает соответствующее оповещения о предполагаемом им движении цены на следующем баре.
Кроме того индикатором ведется подсчета выданных им сигналов и и успеха его отработки за доступный в TradingView период времени.
В данном индикаторе используются комплекс значений таких базовых индикаторов, как:
- Stochastic RSI;
- Bollindgers Bands;
- Profile of Volumes;
- CCI ;
- ADX;
- Momentum ;
и прочие.
Все настройки оставил "открытыми", так что его вполне можно, немного изменив параметры, подстроить под другую пару или тайм-фрейм.

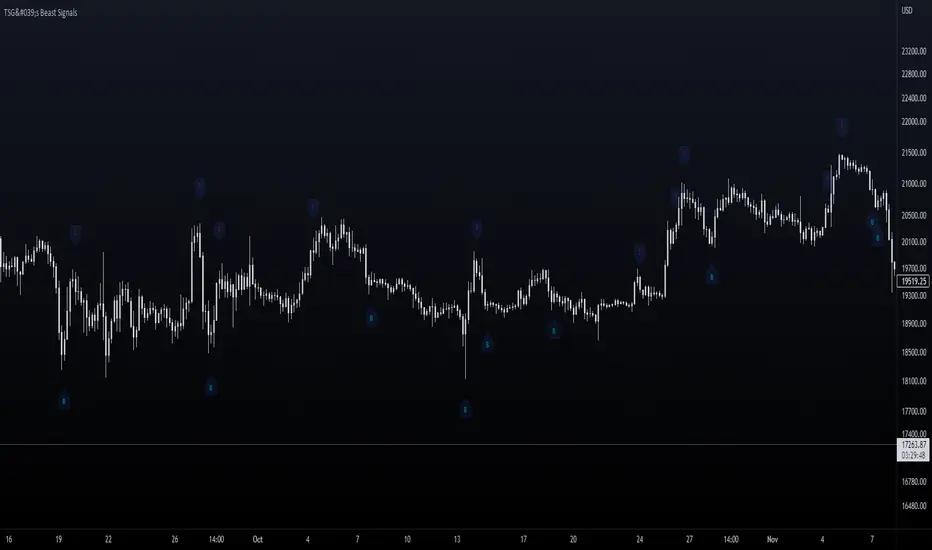
TSG's Beast SignalsThis indicator is built with the purpose of keeping things simple and user-friendly. It is a custom formula I developed lately and it signals pretty accurately changes of direction in the price.
Added an Alert option to it lately - with customizable messages.
_____________________________________________________
_____________________________________________________
HOW IT IS DONE
I make great use of the Average True Range indicator which is the best and simple volatility indicator out there and mix its behavior with several Moving Averages to catch exhaustions of trends and potential reversal points. Moving Averages are treated as bands and the price is kept within it (Something like Bollinger Bands , but custom).
_____________________________________________________
_____________________________________________________
WHAT TIMEFRAMES TO USE IT ON
The bigger the timeframe, the less noise you will have. It is playing out nicely to signal major trend reversal or retracements, but I used it for scalping aswell.
_____________________________________________________
_____________________________________________________
PLANS
Maybe MultiTimeframe table to align signals coming from different timeframes for better accuracy of entry?
Good Luck!
Colorful Channelwhat is "Colorful Channel"?
it is a overbought - oversold indicator.
what it does?
It fills the area between the upper band of the channel and the price line with green, the area between the lower band of the channel and the price line with red color and applies a transparency to these colors according to the distance of the price from the channel lines. thus allowing users to get an idea of ??the current value of the price.
how it does it?
subtracts the percentage of the price from the lower channel from the transparency ratio of the red color, and the percentage of the price from the upper band from the transparency ratio of the green color. thus, a different transparency value is obtained for each percentile. In addition, the transparency rate can be changed with a multiplier determined by the users.
how to use it?
In the "lenght" section, you select the number of bars that the indicator will base backwards on. For example, if length=100, the indicator determines the upper and lower bands according to the distances from the highest and lowest values ??within 100 bar. so the length part works like donchian channels.
You can change the transparency ratio of the colors in the "transp" section.
1 saat transp
yan trend
4 saat

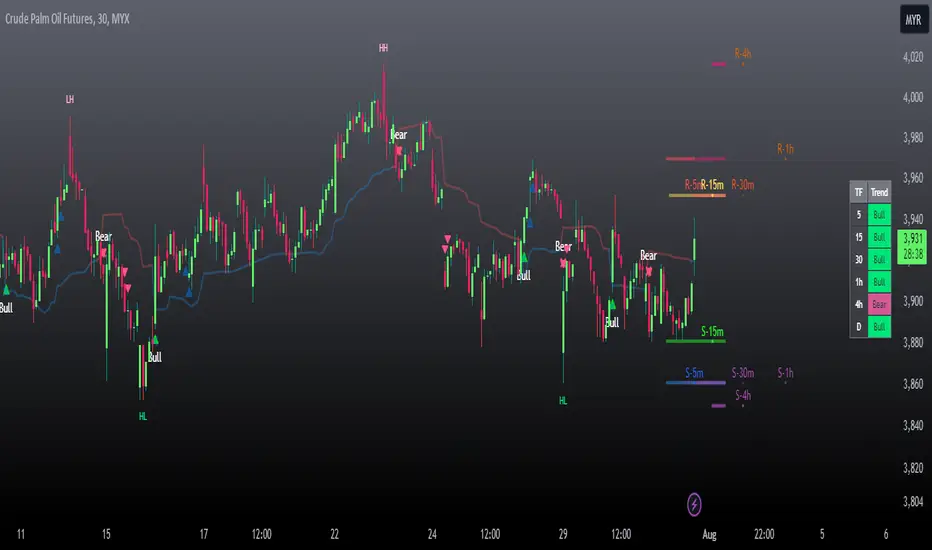
Q-TrendQ-Trend is an multipurpose indicatorm that can be used for swing- and trend-trading equally on any timeframe (non-volatile markets are better for this thing).
Settings:
Trend period - used to calculate trend line in the special moments(will explain below);
ATR Multiplier - changes sensitivity. The higher the multiplier = the more sensitive it is.
Also option to smooth source data (helps get cleaner signals, as always).
How to use?
Signals are given on the chart. Also ou can use trend line as S/R line.
The idea behind:
Terms:
SRС = Source
TL = trend line;
MP = ATR multiplier;
ATR = ATR :)
TL = (highest of source P-bars back + lowest of source P-bars back) / 2
Epsilon = MP * ATR
I was thinking for a week about combining volatility and relation between highest and lowest price point. That why I called indicator Q-Trend = Quantitative Trend , as I was trying to think about price in a mathematical way.
Okay, time to go philosophical:
1) TL is shows good price trend, but as it is slow enough and not enough informative, we need add additional conditions to produce signals.
2) Okay, so what can we add as conditions? We need to take volatility into account, as it is crucial in the moments of market uncertainty. So let's use ATR (Average True Range) somehow. My idea is that if SRC breaks TL + ATR , then it means that there will be upmove and we update our TL . Analogically for SRC breaking TL - ATR (breaks are crosses of TL +- ATR lines) .
Conclusion:
- if SRC breaks TL + ATR , it is a BUY signal and update of trend line;
- if SRC breaks TL - ATR , it is a SELL signal and update of trend line;
I think that such indicator already exisits on TradingView, as I've already saw something similar, but long ago, so please don't report, if such thing already exists.
But if not, then I hope, that you will gain some profits with Q-Trend :)
I will continue my work on this thing, so stay tuned.
Trade with your own risks and have your profits!
Wish you all the best!
- Tarasenko Fyodor

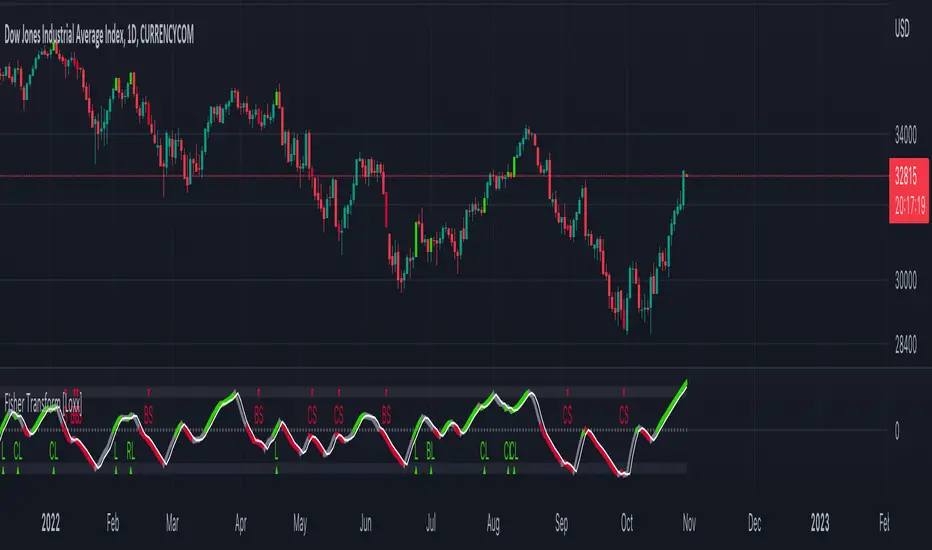
Fisher Transform [Loxx]The Fisher Transform is a technical indicator created by John F. Ehlers that converts prices into a Gaussian normal distribution. The indicator highlights when prices have moved to an extreme, based on recent prices. This may help in spotting turning points in the price of an asset.
What's different between this and regular Fisher Transform?
This version of Fisher Transform morphs the original Fisher Transform concept into a high-powered trading tool that works for all asset classes and all timeframes. There are 1000s of potential combinations of signal output between source selection and filtering preferences. Additional sources, volatility types, and moving averages will be added over time in future releases.
Sources
Loxx's Expanded Source Types enabling ~100 variations of source input including all Heikin Ashi and Better Heikin Ashi types. See here for more information here:
Signals
Initial Long "L": Zero-line or trigger/signal cross-up
Initial Short "L": Zero-line cross-down or trigger/signal cross-down
Continuation Long "CL": When price is in uptrend, cross-up trigger over signal
Continuation Short "CS": When price is in downtrend, cross-down trigger under signal
Post Baseline Cross Long "BL": When trigger and signal cross-up over zero-line but Baseline is still in downtrend, then if Baseline finally turns to uptrend within XX bars, then long
Post Baseline Cross Short "BS": When trigger and signal cross-down under zero-line but Baseline is still in uptrend, then if Baseline finally turns to downtrend within XX bars, then short
Long Exit "LX": When trigger is over XX boundary and trigger crosses down signal
Short Exit "SX": When trigger is under XX boundary and trigger crosses up signal
Filters
Baseline filter
41 Different moving averages to choose from including moving averages including Loxx's Moving Averages. See here for more information on included moving averages:
If the Baseline filter is turned on, the Post Baseline Cross signals are activated. For all Baseline types, the trigger is close, the signal is the moving average. If the trigger is above the signal, price is in an uptrend, if trigger is below the signal, price is in a downtrend. When this selected, the trend of the baseline must match the trend of the Fisher Transform for the signal to be valid.
Volatility filter
Volatility : If price crosses the baseline, we check to see how far it has moved in terms of multiples of volatility denoted in price ( volatility in price x multiple). If price has moved by at least "Qualifier multiplier" and less than "Range Multiplier", then, assuming other factors align in one direction, then a signal is printed
Volatility Types
v1.0 Included Volatility
Average True Range (ATR)
True Range Double (TRD)
Alerts
Includes alerts for all signal types listed above
UI Options
5 color schemes
5 trend coloring schemes
Ability to turn signals on/off
Fisher Transform Backtest