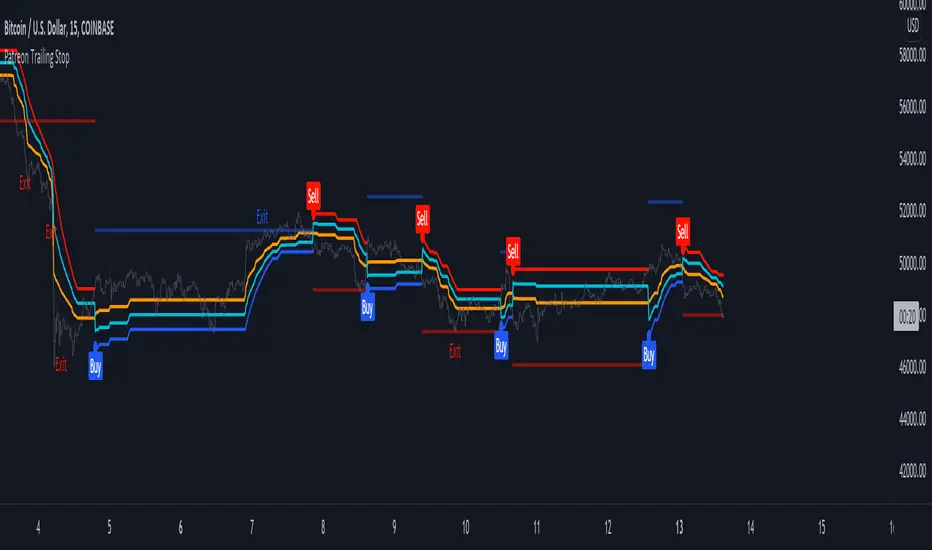
Patreon Trailing StopThe Patreon trailing stop technical indicator can detect trends, find support and resistance points, filter out noise, and help users make informed decisions easily and in a timely manner. In order to provide an accurate and useful indicator most of the efforts during its development were directed toward the minimization of false signals, thus giving to the indicator the potential to further improve your trading strategies.
The trailing stop integrates visual elements for an easier interpretation of the indicator, and integrate alerts based on the buy/sell signals given by the trailing stop. All the outputs of the indicator can be used as input for other indicators.
Settings
In order to make it easier to use, the indicator only possess three user settings:
Length: Control the sensitivity to price variations, with a higher value aiming to detect longer-term trends.
Factor: A setting that aims to filter out false signals, with a higher value filtering more false signals.
Src: Source input of the indicator, by default set to median price (hl2).
Easily Filter Out False Signals
The Factor setting was carefully implemented to filter out false signals without introducing significant delay.
In green/orange the indicator with a Factor setting of 1, in blue/red the indicator with a Factor setting of 10, both using Length = 50 , we can see that increasing factor remove false signals.
The integrated support and resistance line can also help you spot potential false signals:
When the price cross the S/R line before the occurrence of a signal we could expect the upcoming signal to be false, better signals are given when the price cross the S/R at the same time a signal is produced.
Finally, the distance between the trailing stop and the price when a new signal occurs can also help out determine if this signal is false, as a higher distance between the trailing stop and the price suggest a ranging market.
Entering Trades At A Better Position
Indicators can give false signals at the top or bottom of a movement, the Patreon trailing stop can help you enter trades at a more profitable position thanks to the integrated support and resistance line.
When we have a signal but fear it might be false, we can wait for the price to reach the S/R and enter our trade at that point, this allows us to either make a profit or minimize a loss.
Integrated Adaptive Filter
The indicator integrates a trend adaptive filter (in orange), with it you can:
Filter out noisy variations from the price.
Use it as a fast-moving average in a moving average crossover system.
Use it as input for other technical indicators.
Simple moving average with period 200 using the filter as input.
How To Access
The indicator is one of the "Patreon trend following indicators", and can only be used by my Patreons, you can become a Patreon by using the link on my signature.
Signals
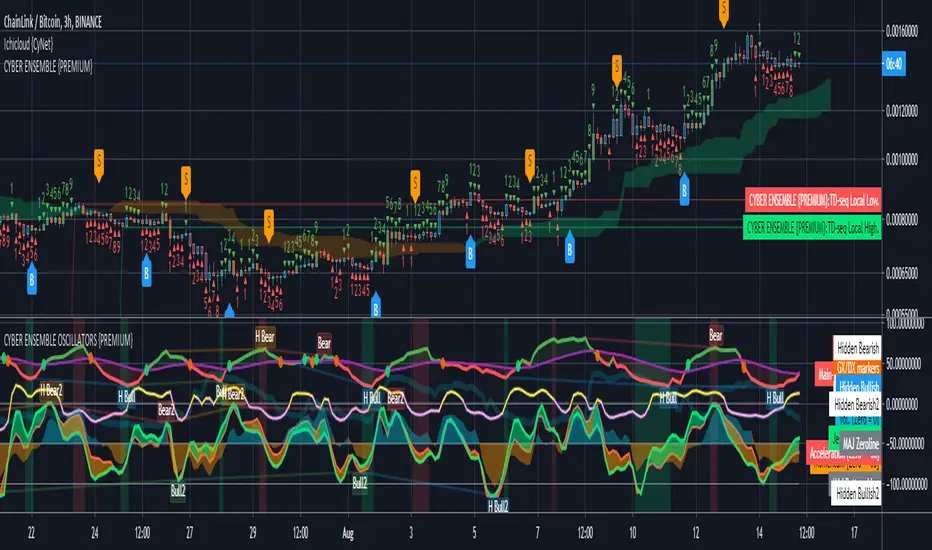
CYBER ENSEMBLE OSCILLATORS {PREMIUM}The CYBER ENSEMBLE OSCILLATORS is a companion to the CYBER ENSEMBLE buy/sell indiator.
It is based on the algorithms powering the PRISM OSCILLATORS SET, where instead of the pRSI, the main-oscillator ( main-osc ) is instead powered by an oscillator modulated by the sophisticated scoring engine of the CYBER ENSEMBLE buy/sell indicator.
In Summary
The Snap oscillator (yellow/pink) pulls the Jerk oscillator (lime), which in turns pulls the Acceleration oscillator (red), which then pulls the momentum oscillator (blue/orange fill). These constitutes the MAJeStic-Oscillators (or the MAJs) which are modulated by the main-osc .
These reveals the underlying movement of the main-osc (green/red). The Stochs of the main-osc (Stoch( main-osc )) is hidden by default, but can be made visible in the settings; and the background color fill/shading (green/red) suggests overbought/oversold states of the Stoch( main-osc ).
See PRISM OSCILLATORS SET for more detailed descriptions of the various derived oscillators modulated by the main-osc .
{PM me in TradingView to arrange subscription access}
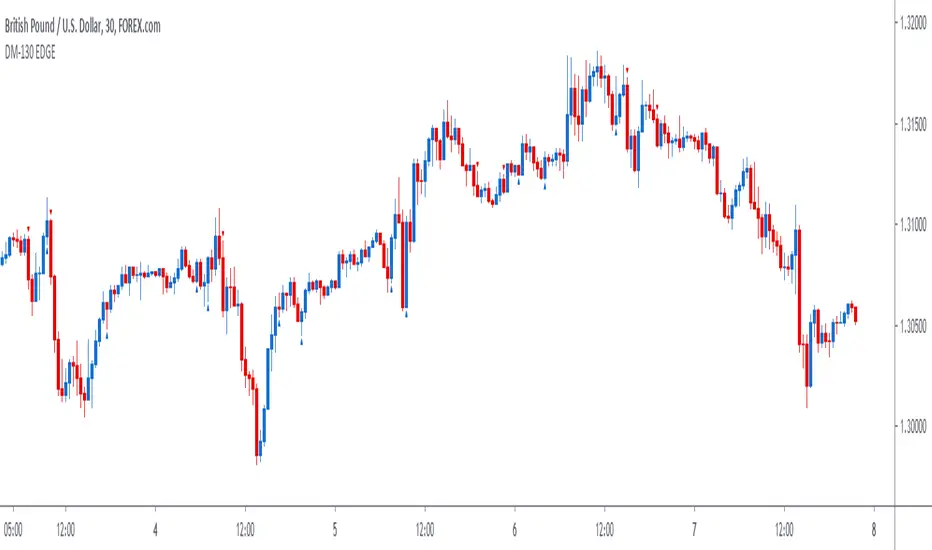
DM-130 EDGE SignalThe DM-130 EDGE is a price action trading signal indicator. There is no need for downloading nor installing. It is an effective signal indicator that has proven to be successful in trading. We will help you set it up within minutes so that you can start trading immediately. It works in trading most markets!
How To Use The DM-130 EDGE:
For a BUY, the signal will display a blue arrow below the candle stick facing upwards when there is a buying opportunity, a pullback or a bullish move in the market.
For a SELL, the signal will display a red arrow above the candle stick facing downwards when there is a selling opportunity, a pullback or a bearish move in the market.
Tradingview Account Level: All Users
The indicator appears once or twice during the UK trading sessions and works best in at confluence points:
1. A Trend Line
2. A Support or Resistant Level
3. Supply or Demand Zone
4. Off Pivots
5. Off a Fibonacci Level
6. In Trend Direction
Best Pair: GBP/USD
Best Trading Times: UK Sessions
How To Set Alerts:
Click on the Alerts button on the charts
Under 'Condition', change from the currency pair displayed to 'DM-130 EDGE Signal'
Then under 'Option' click on 'Once Per Bar'.
Make sure that the you tick the boxes that appeal to you under the 'Alert Actions' part (usually 'Notify on App' and 'Show Popup') and then click the 'Create' button at the bottom.
If you tick the 'Notify on App' box under 'Alerts Actions' the alerts would appear on your smart device if you have the Tradingview App set on the device.
Amongst many great benefits you will 1. Have the confidence to enter trades 2. Have the ability to enter trades after a pullback (something only experienced traders can spot that) and even more importantly 3. You can trade profitably with consistency even if you get stopped out a few times because the wins are usually bigger!
This strategy signal will analyse price action automatically when there is a high probability of a profitable trade to enter.
It does work on most markets. We recommend using the 30m charts as it works best with this indicator. This signal is ideal for intraday/day trading.
This signal allows you to enter trades with confidence.
Use the link below to obtain access to this indicator or you can send us a private message on Tradingview.
Market Surfers Signalshello guys its siple and easy indicator provide buy and sale signals but there are some rules to be followed are as below;
Plot below indicators;
1. EMA 50 Days
2. Vwap
Once there is indication of buy and price is above EMA 50 &VWAP can long from the next candle open SL will be the signal candle bottom or last swing low in 5 mint candle wise versa for SHORT /Sale.
I am improving it more and will improve further.
Enjoy.
From : Market Surfers (ASIF HUSSAIN)

ATR Auto Oscillator [DepthHouse]The ATR Auto Oscillator uses advanced range calculations to determine a dynamic range that the applied market moves within. Like an RSI , the ATR Auto Oscillator measures the speed and change of price movements through a given range. Unlike an RSI , the ATR Auto Oscillator automatically re-configures range values dependent on the user set lookback.
The oscillator ranges between (0.1) and 1.1. Generally, the market is oversold while the bands are below 0.2 and is overbought while above 0.8.
The two bands displayed are used to determine short term trend directions and the oversold/undersold state of the applied market. Crossovers of these bands could give a hint to the direction the market is moving.
The fast band (green) is the direct value of where the market is within its calculated range; 1.1 representing the top of range, and -0.1 representing the bottom. Even when this value is near the bottom of the top of the range, the auto oscillator will readjust to create a new range that the market travels within.
The slow band (red) is a lagging version of the fast band which is used to determine the oversold/overbought signals. When this band travels within the oversold and overbought regions the background color will change to signal a warning. If the fast band crosses the slow band within these zones, an opaque signal will appear. These signals are used to catch possible trend reversals.
Breakout Signals ( BETA ):
Breakout signals are the up and down arrows displayed on the top and bottom of the oscillator. A refined range is generated by the user set 'High Low Length'; it is then displayed by the light gray horizontal lines. If the user set band (fast or slow) returns into the range within a given period (breakout offset) then a signal will generate.
Built in Alerts (must be set up by user):
Bullish & Bearish Crossovers within the oversold and overbought ranges.
Bullish & Bearish Breakout alerts (beta)
Users can also set custom alerts. Example: Fast Band crossing up Value: 0.7
To gain access to this indicator please follow the link below.
Feel free to message me with any questions directly here on TradingView.

The SetUpps Strategy EDGE SignalThe SetUpps Trading Strategy HM-415 EDGE, DM-130 EDGE and MD-11 are price action trading signal indicators. There is no need for downloading nor installing. It is an effective signal indicator that has proven to be successful in trading. We will help you set it up within minutes so that you can start trading immediately. It works in trading most markets!
How To Use SetUpps Strategy Signals:
For a BUY, the SetUpps Signal will display a blue arrow below the candle stick facing upwards when there is a buying opportunity, a pullback or a bullish move in the market.
For a SELL, the SetUpps Signal will display a red arrow above the candle stick facing downwards when the is a selling opportunity, a pullback or a bearish move in the market.
The indicator works best in at confluence points:
1. A Trend Line
2. A Support or Resistant Level
3. Supply or Demand Zone
4. Off Pivots
5. Off a Fibonacci Level
How To Set Alerts:
Click on the Alerts button on the charts
Under 'Condition', change from the currency pair displayed to 'The SetUpps Strategy EDGE Signal'
Then under 'Option' click on 'Once Per Bar'.
Make sure that the you tick the boxes that appeal to you under the 'Alert Actions' part (usually 'Notify on App' and 'Show Popup') and then click the 'Create' button at the bottom.
If you tick the 'Notify on App' box under 'Alerts Actions' the alerts would appear on your smart device if you have the Tradingview App set on the device.
Amongst many great benefits you will 1. Have the confidence to enter trades 2. Have the ability to enter trades after a pullback (something only experienced traders can spot that) and even more importantly 3. You can trade profitably with consistency even if you get stopped out a few times because the wins are usually bigger!
The SetUpps Trading Strategy signals will analyse price action automatically when there is a high probability of a profitable trade to enter.
It does work on most markets on all time charts but we will give you our recommended time frames that works best with this indicator.
The SetUpps Strategy signal is ideal for scalping, intraday and for swing trading.
This signal allows you to enter trades with confidence.
Disclaimer:
Previous performances are not an indication of any future performances. We are not investment adviser nor do we advice you on trading. All our opinions, information, analysis, prices and/or market commentary are not advice about investments. Any SetUpps™ Trading staff or partners or representatives can not warrant the completeness, accuracy or timeliness of any information we have supplied and we shall not be liable for any losses or damages, consequential or otherwise, incurred by the use of our products which may be the result of relying on the SetUpps™ Trading strategy. © 2020 SetUpps™ Trading.
The SetUpps™ Trading indicator is built for use on Tradingview. SetUpps™ Trading is not part of Tradingview.

SIDD-Master-Moving-AverageSIDD-Master-Moving-Average is based on RSI average calculation Moving average plotted on chart.
This Moving Average is giving 2 signals Bullish and Bearish .
Whenever Bullish signals is coming price is doing crossover with moving average on upside and this indicate price will go up from current market price.
Whenever Bearish signals is coming price is doing cross-under with moving average on downside and this indicate price will go down from current market price.
Moving average color is changing based on upside movement or downside movement , for upside its green and for downside its orange color.
This indicator i have created with stop loss line means any price close below cross line for bullish position then that trade should be closed and take the stop loss. similarly for Bearish trade and candle close above stop loss line means trade should be closed and take the stop loss.
Stop loss i have taken care with ATR and Super trend you can see the settings.
I have defined setting for general use of indicator if any modification on setting then result may vary.
Its multi time frame moving average. And I have given time frame for indicator as well so if any trending move need to capture then that setting need to be increased with respect to chart time frame else keep it same.
I have added commission and slippages as well in indicator.
Ping me or DM me to subscribe this indicator.
I have given all my indicator details below link (Signature URL). You can check indicators and call me on given number or email me on given email to access the scripts and indicators. Telegram link is also given you can ping me there.
--------------------------------------------------------------------------------------------------------------------------------------
Disclaimer : Past performance of the indicator is not giving guarantee for future performance as well, it may change as per market condition.
-------------------------------------------------------------------------------------------------------------------------------------

TradeChartist Transformer ™TradeChartist Transformer is an extremely useful indicator that transforms any indicator plot, Oscillatory or Non-Oscillatory into Support/Resistance levels, thereby generating trade entries on Price chart.
How does ™TradeChartist Transformer work?
1. Connect any external indicator plot to Transformer by choosing it from the Transformer's Plug Indicator Here dropdown from the settings.
2. Choose whether the connected plot is Oscillatory or Non-Oscillatory from Indicator Type .
3. If connected indicator is an oscillator, enter the values for Transformer to generate Trade Entries. For example, if the connected Indicator is RSI, user can define RSI level 60 for BUY entries and RSI level 40 for SELL entries. For most oscillators, the value is 0 which is the default value.
4. There are two types of Trade Entries, one based on Fail/breach of Nearby Support/Resistance and the other based on Fail/breach of Ultimate Support/Resistance plotted by Transformer. For Higher Time-Frames like Daily, Fail/breach of Nearby S/R entry type will ensure early trade entries. This could vary from indicator to indicator and a thorough testing/observation on timeframe traded using paper trades is highly recommended before trading with real money.
5. Once Steps 1-4 are complete, BUY and SELL plots based on above will be plotted by Transformer on Price chart.
6. BUY and SELL plots are also decided by an ATR (Average True Range) condition + Indicator plot acting as filter itself along with fail/breach of Support/Resistance, as this helps minimise unproductive trade signals.
7. Enabling Dynamic Support/Resistance plots moving Support/Resistance levels for each bar. For most assets/timeframes, this doesn't alter the Trade entries.
8. Bar Colors and Profit Taking Bars can be enables from settings as these help identify the trend visually and also help recommend bars where profit taking is recommended.
9. Alerts can be created for Long and Short entries by using Once Per Bar Close as Alert Frequency. Entries are generated on Real time bars as close price fails Support or breaches Resistance. It is recommended to wait for bar close before taking a position based on Transformer Trade Entries.
10. Trade Entries or Transformer plots don't repaint. This can be verified using Bar Replay by confirming real time plots with historical plots. Also, when creating alerts, there will be no Alert Warning for repainting as the code doesn't use Security function or other functions that cause potential repainting.
===================================================================================================================
™TradeChartist Transformer can also be connected to ™TradeChartist Plug and Trade to generate Targets, Stop Loss Plot etc. and other alerts can also be created. Example chart shown below - Transformer connected to RSI to generate BUYs when RSI > 60 and SELLs when RSI < 40, connected to Plug and Trade.
===================================================================================================================
Example Charts:
1. CCI - (CCI>100 - Bullish and CCI<-100 - Bearish) connected to Transformer - BTC 1hr chart
2. Chaikin Money Flow with default values connected to Transformer - BTC 1hr chart
3. EMA connected to Transformer- BTC Daily chart
4. Awesome Oscillator connected to Transformer - GBPUSD Daily Chart
5. Ichimoku Cloud Conversion Line connected to Transformer - USOIL 1hr chart
===================================================================================================================
Best Practice: Test with different settings first using Paper Trades before trading with real money
===================================================================================================================
This is not a free to use indicator. Get in touch with me (PM me directly if you would like trial access to test the indicator)
Premium Scripts - Trial access and Information
Trial access offered on all Premium scripts.
PM me directly to request trial access to the scripts or for more information.
===================================================================================================================

20 EMA Daytrading Strategy20 EMA Daytrading Strategy
This strategy creates long and short signals based on a 20 EMA crossing condition. Works well in 4H timeframes or higher. Accuracy is around 60%.
BUY
When a green candle crosses above 20 EMA
Followed by another green candle which closes above the previous candle high
SELL
When a red candle crosses below 20 EMA
Followed by another red candle which closes below the previous candle low
Stop loss at ATR + 5
Take Profit at 1.3R

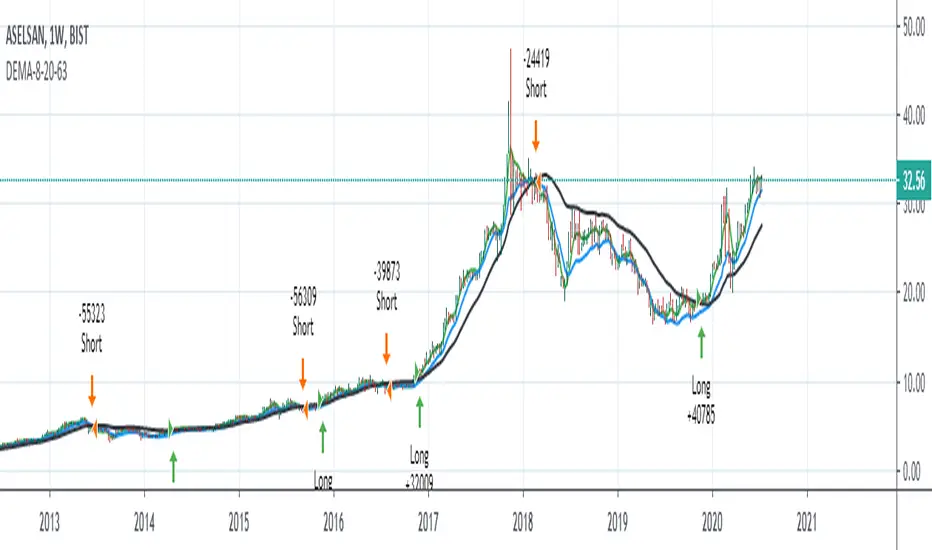
Double Exponential Moving Average 8-20-63 StrategyHello, this script was made upon the request of aliergin63, one of my followers.
I do not know exactly from whom it is quoted. (It may be author HighProfit.)
Long position when 8 dema is over 20 dema and 63 dema,
it opens a short position for the vice versa.
Alarms have been added.
%0.1 comission added.
Regards.
Note : DEMA = Double Exponential Moving Average
Candlestick Pattern IdentifierMy script builds upon another user-submitted script by rebuilding the logic used to identify candlestick patterns. The logic in my script is a mix of strict and lax guidelines to mitigate false flags and present valid buy and sell signals.
-To use this indicator, simply add it to any chart. It will identify trends on any time frame although the lower you go, the more signals you'll see and the higher probability of those signals being false flags. You can also disable any candlestick patterns that you feel are not as useful.
- This indicator works best with Stocks and also with Forex markets to a lesser extent.
- This indicator works the best on the Daily chart and also works (with varying degrees of success) on any timeframe at or above 1 hour. I've found that this indicator works the best when used in tandem with the Daily and Hourly charts with the Hourly chart being used to determine an entry point while the Daily chart is used for long term trend analysis.

Custom Screener with Alerts [QuantNomad]Some time ago I published an example of simple custom screener in PineScript:
The only thing this screener did is created a dynamic label with screener output.
Recently TradingView announced alerts from the strategy with the possibility to add custom messages to alerts.
So using it I was able to create a bit more advanced screener which sends results as alert messages. With tools like Alertatron, you can easily redirect them to Telegram if you want.
It works for 40 symbols (limitation of the number of security calls).
To create your own screener you need to change only screenerFunc. The logic of this function is very simple, it outputs value you want to display in screener and condition based on which your screener should filter your stocks.
To create alerts for this screener create an alert from strategy and use {{strategy.order.alert_message}} as alert message.
Do you know now how to make this screener better? Let me know.
Disclaimer
Please remember that past performance may not be indicative of future results.
Due to various factors, including changing market conditions, the strategy may no longer perform as good as in historical backtesting.
This post and the script don’t provide any financial advice.

Momentum Oscillator [Dynamic & Flow] (Expo)Momentum Oscillator -Dynamic & Flow (Expo) is a fast-moving, sensitive oscillator that makes use of momentum in various ways. The indicator has two additional layers (Buy & Sell moves) and (Extremes) which makes it reacts quickly to price changes.
The indicator displays overbought and oversold areas as well as extreme areas and how aggressive buyers and sellers are. It does also displays potential reversal points or potential pullbacks.
The following momentum modes are displayed:
1. Where momentum begins
2. Where momentum is strong
3. Where momentum begins to stall
Where momentum begins to stall is displayed as a red and green color on the momentum line .
Where momentum begins (light green and light red color) and where it's strong (dark green and dark red color) is displayed as upper and lower lines. The darker these lines are the stronger is the momentum.
Potential reversal or pullback is displayed as a blue color on the signal line.
♢ The indicator has inbuilt suggested buy & sell- and stop-loss signals. These signals have flexible settings, so a fast, slow, and sensitive mode can be enabled.
DIVERGENCES
All types of momentum oscillators produce divergences and so does Momentum Oscillator Dynamic & Flow (Expo) . Divergences occur when the oscillator deviates from the trending price action. Bullish divergence is then when the trending price makes a lower low but the oscillator makes a higher low. Bearish divergence is then when the trending price makes a higher high but the oscillator makes a lower high.
HOW TO USE
1. Use the indicator to identify overbought/oversold areas, as well as extreme modes.
2. Use the indicator to display momentum in various ways.
3. Use the indicator to confirm the existence, or a continuation, of a trend.
4. Use the indicator to identify potential reversal points or potential pullbacks.
INDICATOR IN ACTION
4-hour chart
I hope you find this indicator useful , and please comment or contact me if you like the script or have any questions/suggestions for future improvements. Thanks!
I will continually work on this indicator, so please share your experience and feedback as it will enable me to make even better improvements. Thanks to everyone that has already contacted me regarding my scripts. Your feedback is valuable for future developments!
ACCESS THE INDICATOR
• Contact me on TradingView or use the links below
-----------------
Disclaimer
Copyright by Zeiierman.
The information contained in my scripts/indicators/ideas does not constitute financial advice or a solicitation to buy or sell any securities of any type. I will not accept liability for any loss or damage, including without limitation any loss of profit, which may arise directly or indirectly from the use of or reliance on such information.
All investments involve risk, and the past performance of a security, industry, sector, market, financial product, trading strategy, or individual’s trading does not guarantee future results or returns. Investors are fully responsible for any investment decisions they make. Such decisions should be based solely on an evaluation of their financial circumstances, investment objectives, risk tolerance, and liquidity needs.
My scripts/indicators/ideas are only for educational purposes!

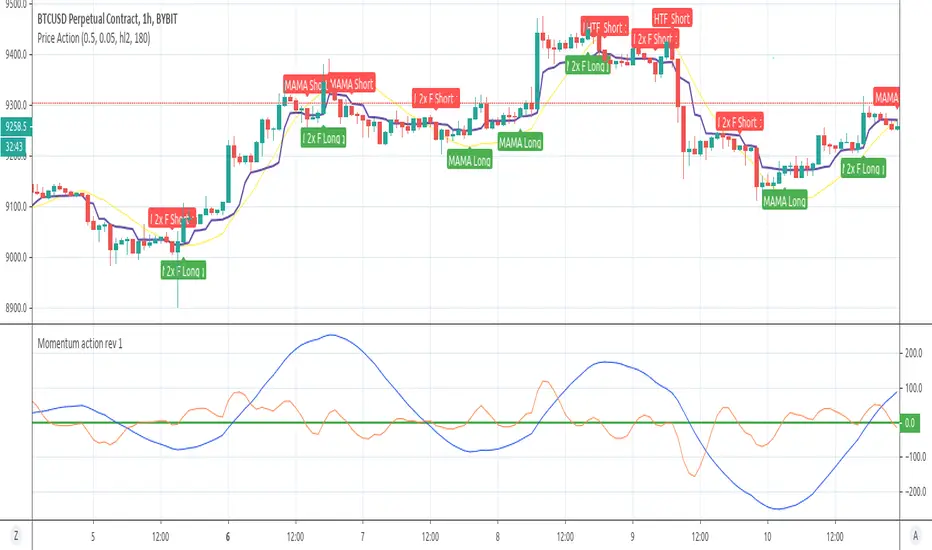
Advance strategy for trading and scalping for Crypto / Forex Hello traders ,
here i am introducing my strategy with updated features.
It provide signals for entering in the market and signal for exit.
Signal for opening short / sale position is when Price drop bellow the yellow line of the Indicator ( Price action ) and same time the red line of the Indicator Momentum Action is dropping .
Additional confirmation is if the price goes bellow MAMA line as well ( Violet colour on the chart )
For open buy/long position we need to see break over the Price action indicator ( Yellow line ) and same time the red line of Momentum indicator must goes over 0 level of the bottom chart.
The rule currently use 2 bars difference from break of price indicator or break of momentum level 0 , so the indicator will show long/short if the break of both points is within 2 bars .
I can suggest entering on H1 or H3/H4 time frames as on lower frames more noise .
I have added few more filters for more clear signals and higher win rate .
Added are MAMA ( The Mesa Adapter Moving Average by John Ehlers ) and FAMA ( Following Adaptive Moving Average )
Additional filter for monitoring Higher Time Frame Time frame position of the Momentum indicator .
For Example if we are watching basically at H1 time frame we can set HTF Filter Period to monitor 4 hours time frame and once we have same direction signals we will have confirmation . ( Moving Action indicator is same way in H1 and H4 ) .
Alerts can be set once signal appear you can be notified accordingly so you dont miss any trades
As before strongly suggest using Momentum Action Indicator on the chart .
Free trial period 15 days is available for all users who want to try the strategy , please contact me via personal message if you want to receive a trial period or for more information.
Thank you.
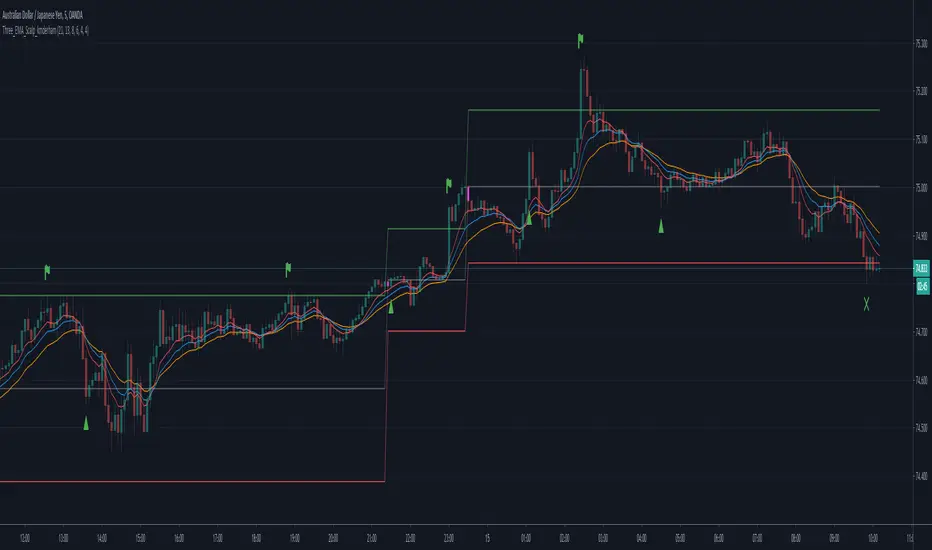
Three EMA Scalp Signals by kmderhamThis script looks for a set up condition where 5 consecutive candles have broken away from the fast EMA (set to 8 by default) followed by a "trigger" candle that crosses back over the fast EMA but not the medium EMA (set to 13 by default). It then determines the entry point based on the bar high or low (not tail or wick) depending on direction of the trend. Once the entry point is crossed, we can enter the position. Win or loss is determined whether the lower or upper levels are crossed (as per trend). After the position is won or lost and if the entry level is re-crossed before a new set up condition is found then a new entry signal is given.
Please note that this should really be used in conjunction with a higher timeframe "Anchor" chart with a fast and a slow EMA so setups and positions should should correspond to the trend of the higher timeframe chart. This was designed for a 5 minute timeframe and a 60 minute anchor chart.
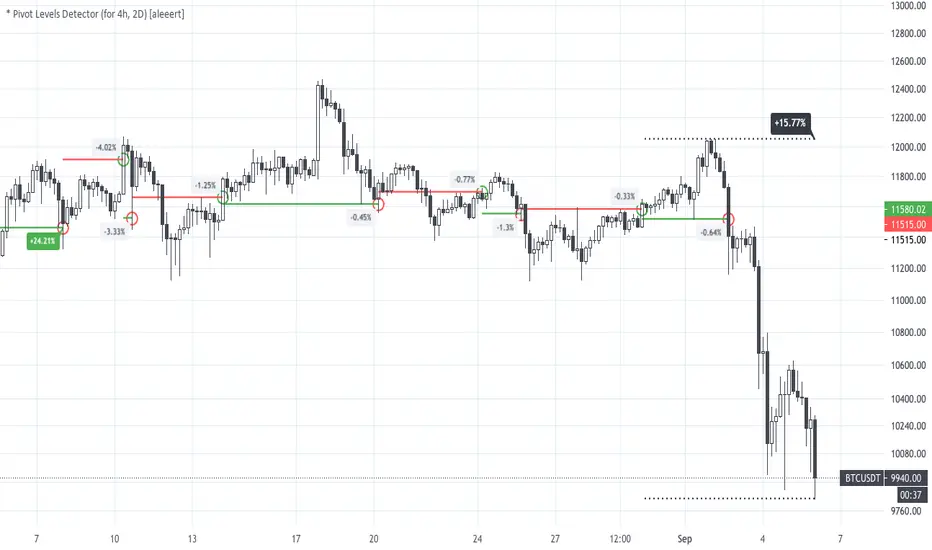
* Pivot Levels Detector (for H4, D2) [aleeert]Pivot Levels Detector is the script based on idea about breakouts of pivot levels which based on certain numbers of bars used for reaching the target and breakout the level. Working timeframes are H4 and 2D . The script works better with BTCUSD, ETHUSD, EOSBTC, AAPL, TSLA.
No repainting!
The script doesn't use any moving averages or other relative methods which cancel or change data on previous bars. Once the signal is showed it will stay forever.
NOTE: The results from Strategy Tester could slight vary from results you see on the chart. It's because of calculation method used on Strategy Tester, which uses a data from closed bars only, not by target reaching. So the results you see on the chart are more correct.
Follow me for receiving more scripts and indicators.
Regards,
aleeert
RSI with Bollinger Bands Binary system by Hashtag_binaryRSI with Bollinger Bands is binary options high/low trading system based on the volatility.
- Time frame 30min - 1H
- Expiry time 2 candles
- Markets: Forex currency pairs majors: EUR/USD, USD/CHF, GBP/USD, AUD/USD, NZD/USD, EUR/JPY, USD/JPY, AUD/JPY
Rules for RSI with Bollinger Bands Binary system
- Do not start before the economic news
- We wait for the price to eitherhit the lower bollinger band or the upper bollinger band and the moment this happens we take the trade immediatly.
Buy Put:
If the price touches the lower Bollinger band we and RSI is below the 30 we take a put.
Buy Call:
If the price touches the upper Bollinger band we and RSI is above the 70 we take a call.

MACD Binary Strategy by Hashtag_binary MACD Binary Options Strategy is an trend momentum system, It's based on the double MACD in the sub window below the chart.
- Markets: Stocks, Indicies, Metals, Forex. This binary strategy works good on the Indicies ( S&P 500, DAX, FTSE, ).
- MACD Binary System il also good as trading system for to trade.
- Time Frame 30 min or higher ( best 4H).
- Expires Time 3 bars after. (90 min, 180 min, 720 min, 3 daily).
Rules MACD Binary Options Strategy
Buy Call:
- EMA 6 over EMA 13;
- MACD ( 5, 15, 1) crosses upward MACD ( 12,26,1 );
- MACD (5,15, 1) over level 0.
Buy Put:
- EMA 6 under EMA 13;
- MACD ( 5, 15, 1) crosses downward MACD ( 12,26,1 );
- MACD (5,15, 1) under level 0.
The same conditions for entry trade.
Exit position options:
- When MACD (5, 15, 1,) crosses in opposite direction MACD (12,26,1);
- When exponential moving average crosses in opposite direction;
- Make profit with ratio 1:3 stop loss.
- Initial stop loss at the previous swing.

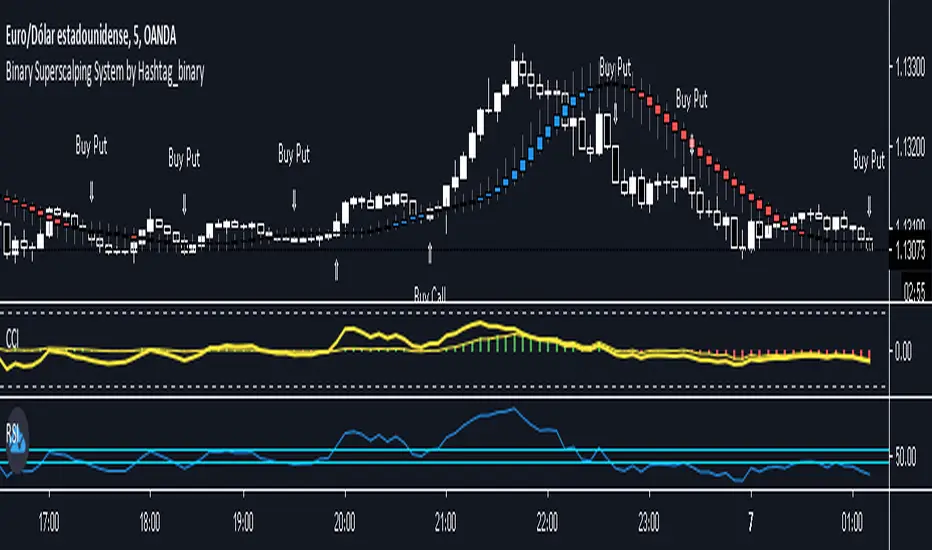
Binary Superscalping System by Hashtag_binaryBinary Superscalping Systyemis a trend momentum strategy designed for scalping and trading with binary options. This trading system is very accurate with the 80% profitable trades.
- Markets: Forex (EUR/USD, GBP/USD, AUD/USD, USD/CHF, USD/CAD, NZF/USD, USD/JPY,) Indicies (S&P500, Dow Jones, DAX, FTSE100) and Gold.
- Time Frame 5 min, 15min, 30min.
- Expiry Time (4-6 candles).
Buy Call or Buy:
- Trend CCI (170) crossed the zero line upwards (green bar >0);
- Entry CCI (34) crosses upward the zero line ;
- RSI (Relative Strength Index) indicator value is greater than 55 level;
- Heiken Ashi Smoothed indicator is color blue (optional).
Buy Put or Sell
- Trend CCI (170) crossed the zero line downwards (red bar <0);
- Entry CCI (34) crosses downward the zero line ;
- RSI indicator value is lower than 45 level;
- Heiken Ashi Smoothed indicator is color red (optiona).
Exit position for Scalping options:
- Entry CCI (34) crosses in opposite direction trend CCI (170),
- Profit Target:5 min time frame 7-10 pips, 15 min time frame (9-14 pips), 30 min time frame (15- 18 pips).
- Make Profit at fibopivot levels.
- Initial stop loss on the previous swing.
ADX signal Binary Options System by Hashtag_binary ADX signal Binary Options System is amanual trading system trend-momentum high/low. This system is still really interesting to use for binary options and trading without binary.
- Time Frame 15 min or higher.
- Expiry time 2-4 candles.
- Markets: Forex (Currency pairs: Majors; Index: S&P 500, Dow Jones, DAX, FTSE).
Trading rules ADX signal Binary Options System
Buy call:
1. The Moving Average line (14) is above others two Moving Averages (60 and 100 red and magenta line).
2. The TrendSignal Bar first subwindow indicator with bar green.
3. Stochastic is above 50 level.
4 If the previous conditions are agree when appear ADX green arrow you can enter buy call.
Buy Put:
1. The Moving Average line (14) is below others two Moving Averages (60 and 100 red and magenta line).
2. The TrendSignal Bar first subwindow indicator with bar red.
3. Stochastic is below 50 level.
4. If the previous conditions are agree when appear ADX red arrow you can enter buy put.
Exit position for trading without binary
Time Frame H1 and 30 min place trailing stop 15 or 20 pips, 4H time frame place trailing stop 30-40 pips depends by currency pairs.
Initial stop loss on the previous swing High/Low.

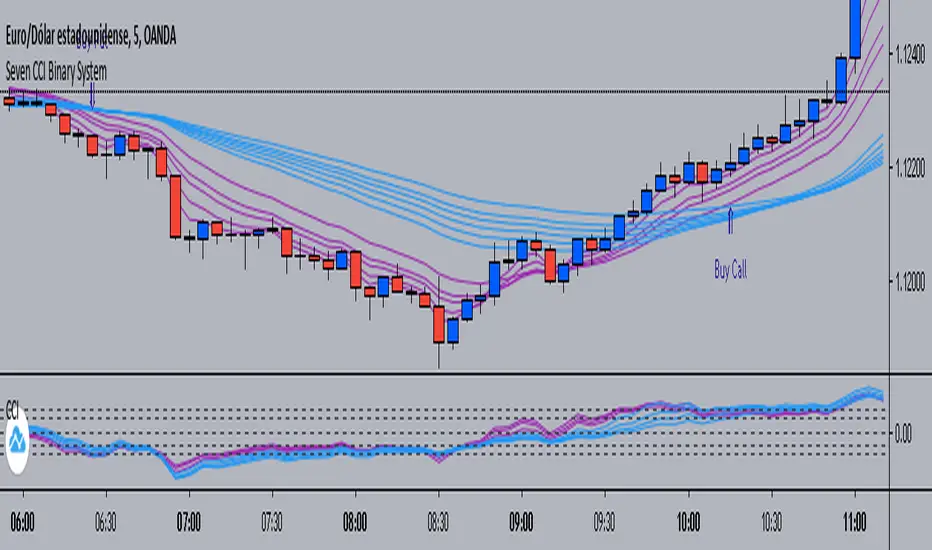
Seven CCI Binary System by Hashtag_binarySeven CCI binary system is trend-momentum strategy based on CCI and exponential moving averages. This trading system is also good for scalping and intraday trading.
Rules for Binary Options:
- Time Frame 5 min or 15 min.
- Expiry time 4-5 candles.
- Trades only in trend.
Buy Call:
- EMA's lines color magenta above EMA's lines color blue;
- CCI lines color magenta are above CCI lines color blue and zero level.
- When thes conditions are agree buy call at opening of the next bar.
Buy Put:
- EMA's lines color magenta below EMA's lines color blue;
- CCI lines color magenta are below CCI lines color blue and zero level.
- When thes conditions are agree buy put at opening of the next bar.
Scalping:
-Time Frame 5 min, 15min.
- Currency Pairs: EUR/USD, GBP/USD, AUD/USD, USD/CHF, USD/JPY.
- The rules for buy and sell are the same.
- When the price is within the bundle of the moving averages do not trade.
Exit position
- Make Profit on the pivot points levels or with fast profit target.
- Initial stop loss on the previous swing price.
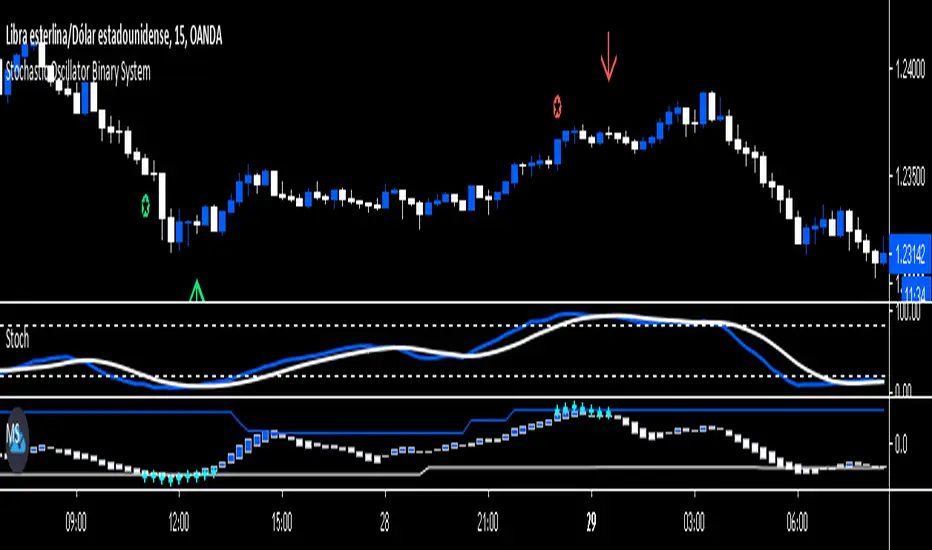
Stochastic Oscillator Binary System by Hashtag_binaryRules
- Time Frame 1 min.
- Expires Time 3 min or 15 min (the best option).
- Markets: Forex (only volatile currency pair), Futures.
- Sessions: London and New York.
Call
- Heiken Ashi Dodger blue;
-Stochastic Oscillator cross upward from oversold Zone (conservative trade, aggressive trade: Stochastic Oscillator cross upward ).
-Matrix three square dodger blue.
Put
- Heiken Ashi white;
- Stochastic Oscillator cross downward from overbougth Zone (conservative trade, aggressive trade: Stochastic Oscillator cross downward ).
- Matrix three square withe.
This Binary System is also good for trade scalping. The same rule for entry with conservative trade:
Exit position options
- For Buy close position when the stochastic line touches 80 levels,
- For Sell close positions when stochastic line touches 20 levels.
- Initial Stop loss on the previous swing.
HFT Momentum IndicatorDefault Settings are meant to be used in XBT/USD chart on 1 hour time frame. If you want to use for another asset on another time frame YOU MUST CHANGE THE SETTINGS
This is momentum-based strategy designed by HFT Research in order to take advantage of volatile, trending markets.
Use ADX
ADX stands for average directional index . It is an indicator that measures volatility in the market. Unfortunately, the worst market condition for this strategy is sideways market. ADX becomes a useful tool since it can detect trend. If the volatility is low and there is no real price movement, ADX will pick that up and will not let you get in trades during a sideways market. It will allow you to enter trades only when the market is trending.
Use MA CrossOver
This strategy’s main driver is the moving average cross over however, unlike many other indicators, this strategy has ALL the moving averages that are on trading view. Total of 13 different moving averages all calculated in a different fashion available in a drop-down menu. You are able to choose two different moving averages to cross for your entry as well as being able to adjust the length of each individual moving average.
Use MA Spread % Filter
As an extra protection, we introduced MA spread % filter. We all know that momentum strategy works when there is actually a trend that has momentum. When there is no trend and market side choppy, we get a lot of noisy signals. In order to battle that we have introduced MA spread % filter. Using this piece of setting, you will be able to chose how strong the cross over actually is. If price is moving sideways, the moving averages will cross each other barely. If the price has actually any steam and momentum, MA 1 will cross over MA 2 aggressively because it will be trending market.
First you chose what the minimum % difference there should be between your 2 moving averages. If you keep this too tight, it won’t be as useful and if you keep this too large then the script will not generate any signals. Trust us, there is a fine balance in between! Then you proceed to chose your moving averages that the bot should keep track of.
Check our website for more information.
