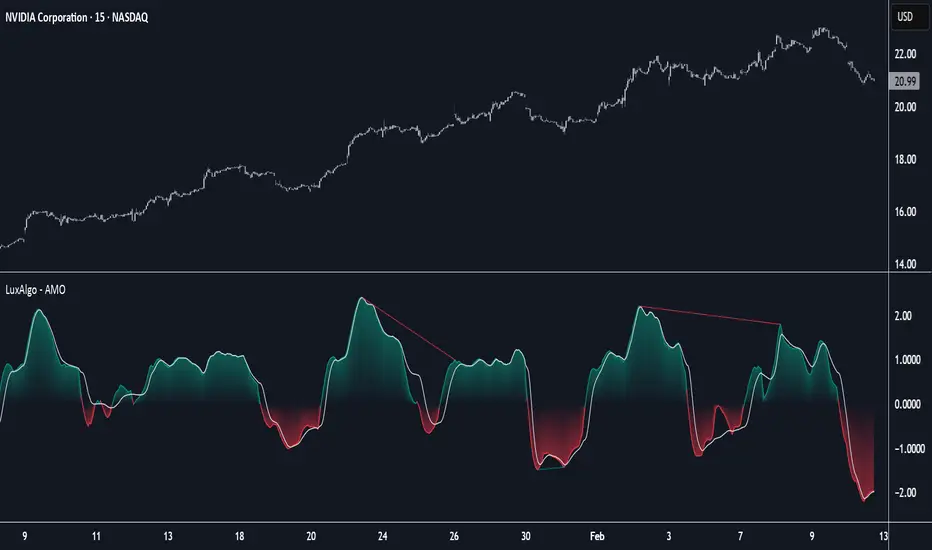
Adaptive Momentum Oscillator [LuxAlgo]The Adaptive Momentum Oscillator tool allows traders to measure the current relative momentum over a given period using the maximum delta in price.
It features a histogram with gradient color, divergences, and an adaptive moving average that allows traders to clearly see the smoothed trend direction.
🔶 USAGE
This unbounded oscillator has positive momentum when values are above 0 and negative momentum when values are below 0. The adaptive moving average is used as a minimum lag smoothing tool over the momentum histogram.
🔹 Signal Line
There are two main uses for the signal line drawn on the chart above.
Momentum crosses above or below the signal line: acceleration in momentum.
Signal line crosses the 0 value: positive or negative momentum.
🔹 Data Length
On the chart above, we can compare different length sizes and how the tool values change, allowing traders to get a shorter or longer-term view of current market strength.
🔹 Smoothing Length
In the previous figure, we can compare how different Smoothing Length values affect the oscillator output.
🔹 Divergences
The divergence detector is disabled by default. Traders can enable it and adjust the divergence length from the settings panel.
As we can see in the chart above, by changing the length of the divergences, traders can fine-tune their detection, a small number will detect smaller divergences, and use a larger number for larger divergences.
🔶 SETTINGS
Data: Select data source, close price by default
Data Length: Select the length for data gathering
Smoothing Length: Select the length for data smoothing
Divergences: Enable/Disable divergences detection and length
Signals
Equal High/Low (EQH/EQL) [AlgoAlpha]OVERVIEW
This script detects and visualizes Equal High (EQH) and Equal Low (EQL) zones—key liquidity areas where price has previously stalled or reversed. These levels often attract institutional interest due to the liquidity buildup around them. The indicator is built to highlight such zones using dynamic thresholding, overbought/oversold RSI filtering, and adaptive mitigation logic to manage zone relevance over time.
CONCEPTS
Equal Highs/Lows are price points where the market has repeatedly failed to break past a certain high or low, hinting at areas where stop orders and pending interest may be concentrated. These areas are often prime targets for liquidity grabs or reversals. By combining this with RSI filtering, the script avoids false signals during neutral conditions and instead focuses on zones where market pressure is more directional.
FEATURES
Detection Logic: The script identifies EQH and EQL zones by comparing the similarity between recent highs or lows with a dynamic volatility threshold. The `tolerance` input allows users to control how strict this comparison is.
RSI Filtering: If enabled, it only creates zones when RSI is significantly overbought or oversold (based on the `state_thresh` input). This helps ensure zones form only in meaningful market conditions.
Zone Display: Bullish (EQL) zones are shown in grey, while bearish (EQH) zones are in blue. Two horizontal lines mark the zone using wick and body extremes, and a filled area visualizes the zone between them.
Zone Management: Zones automatically extend with price until they’re invalidated. You can choose whether a zone is removed based on wick or body sweeps and whether it requires one or two candle confirmations. Zones also expire after a customizable number of bars.
Alerts: Four alert conditions are built in—when a new EQH/EQL is formed and when one is mitigated—making it easy to integrate into alert-based workflows.
USAGE
Equal highs/lows can be used as liquidity markers, either as entry points or as take-profit targets.
This tool is ideal for liquidity-based strategies and helps traders map out possible reversal or sweep zones that often precede aggressive moves.

NR4 & NR7 with Breakouts [LuxAlgo]NR4 & NR7 with Breakouts is a simple indicator that utilizes the NR4 and NR7 candle patterns to display candle ranges and signals from range breakouts.
🔶 USAGE
The Narrow Range Patterns are candle formations determined by the last candle having a narrower (high-low) range than the previous number. This indicator showcases the 2 most recognized Narrow Range Patterns, which are the 4 and 7 bar variants (NR4 and NR7).
These patterns, introduced by Toby Crabel, are thought to provide insight for potential market breakouts by identifying periods of low volatility indicated by a candle with a small range. This is due to the idea that markets often move from periods of low volatility (contraction) to high volatility (expansion), and the NR4 and NR7 patterns help spot these transitions.
By utilizing these patterns, traders are better able to anticipate and respond to market shifts for better decision-making and risk management.
NOTE: These patterns have traditionally been studied on the Daily Timeframe Chart. This indicator allows the user to select a timeframe to generate these patterns from. It is suggested to be mindful of this when considering these patterns.
In this indicator, on the bar after the pattern is detected, the Narrow Range Bar will be highlighted with a zone, and lines displaying the range will extend from it. These ranges are helpful for providing levels to set limit orders and for managing risk.
Users are able to adjust which pattern they want visualized on their chart, please note;
All NR7s are NR4s but not all NR4s are NR7s.
Because of this, you will notice that when selecting "NR4" to display, the colors will change, but the detected ranges will not change.
🔹 Signals
When a Narrow Range Bar is detected, the script will wait for the price to close outside of the Range, then a signal will fire indicating the direction of exit. The signals are produced from the last NR4 or NR7 and will have the potential to fire from that range until a new NR4 or NR7 is detected.
After a signal fires, the logic goes into a "reset" period where it will wait for the price to reach the Range Mean before firing another signal.
These signals can be anticipated by considering the underlying logic and watching price approach the range extremities, and can be improved by utilizing other market information for confluence.
🔶 SETTINGS
Timeframe: Choose which timeframe to identify the NR4 and NR7 Pattern on. This must be Higher than the chart timeframe.
Pattern Type: Choose which (or all) patterns to display.

Market Structure Confluence [AlgoAlpha]OVERVIEW
This script is called "Market Structure Confluence" and it combines classic market structure analysis with a dynamic volatility-based band system to detect shifts in trend and momentum more reliably. It tracks key swing points (higher highs, higher lows, lower highs, lower lows) to define the trend, then overlays a basis and ATR-smoothed volatility bands to catch rejection signals and highlight potential inflection points in the market.
CONCEPTS
Market structure is the foundation of price action trading, focusing on the relationship between successive highs and lows to understand trend conditions. Break of Structure (BOS) and Change of Character (CHoCH) events are important because they signal when a market might be shifting direction. This script enhances traditional structure by integrating volatility bands, which act like dynamic support/resistance zones based on ATR, allowing it to capture momentum surges and rejections beyond just structural shifts.
FEATURES
Swing Detection: It detects and labels Higher Highs (HH), Higher Lows (HL), Lower Highs (LH), and Lower Lows (LL) based on user-defined time horizons, helping traders quickly spot the trend direction.
BOS and CHoCH Lines: When a previous swing point is broken, the script automatically plots a Break of Structure (BOS) line. If the break represents a major trend reversal (a CHoCH), it is marked differently to separate simple breakouts from real trend changes.
Rejection Signals: Special arrows plot when price pierces a band and then pulls back, suggesting a potential trap move or rejection signal in the direction of the new structure.
Alerts: Built-in alerts for structure breaks, CHoCHs, swing points, rejections at bands, and trend flips make it easy to automate setups without manually watching the chart.
USAGE
Set your preferred swing detection size depending on your timeframe and trading style — smaller numbers for intraday, larger numbers for swing trading. Choose whether you want BOS/CHoCH confirmed by candle closes or by wick breaks. Use the volatility band settings to fine-tune how tightly or loosely the bands hug the price, adjusting sensitivity based on market conditions. When a BOS or CHoCH occurs, or when a rejection happens at the bands, the script will highlight it clearly and optionally trigger alerts. Watch for combinations where both structure breaks and volatility band rejections happen together — those are high-quality trade signals. This setup works best when used with basic trend filtering and higher timeframe confirmation.

RSI Candlestick Oscillator [LuxAlgo]The RSI Candlestick Oscillator displays a traditional Relative Strength Index (RSI) as candlesticks. This indicator references OHLC data to locate each candlestick point relative to the current RSI Value, leading to a more accurate representation of the Open, High, Low, and Close price of each candlestick in the context of RSI.
In addition to the candlestick display, Divergences are detected from the RSI candlestick highs and lows and can be displayed over price on the chart.
🔶 USAGE
Translating candlesticks into the RSI oscillator is not a new concept and has been attempted many times before. This indicator stands out because of the specific method used to determine the candlestick OHLC values. When compared to other RSI Candlestick indicators, you will find that this indicator clearly and definitively correlates better to the on-chart price action.
Traditionally, the RSI indicator is simply one running value based on (typically) the close price of the chart. By introducing high, low, and open values into the oscillator, we can better gauge the specific price action throughout the intrabar movements.
Interactions with the RSI levels can now take multiple forms, whether it be a full-bodied breakthrough or simply a wick test. Both can provide a new analysis of price action alongside RSI.
An example of wick interactions and full-bodied interactions can be seen below.
As a result of the candlestick display, divergences become simpler to spot. Since the candlesticks on the RSI closely resemble the candlesticks on the chart, when looking for divergence between the chart and RSI, it is more obvious when the RSI and price are diverging.
The divergences in this indicator not only show on the RSI oscillator, but also overlay on the price chart for clearer understanding.
🔹 Filtering Divergence
With the candlesticks generating high and low RSI values, we can better sense divergences from price, since these points are generally going to be more dramatic than the (close) RSI value.
This indicator displays each type of divergence:
Bullish Divergence
Bearish Divergence
Hidden Bullish Divergence
Hidden Bearish Divergence
From these, we get many less-than-useful indications, since every single divergence from price is not necessarily of great importance.
The Divergence Filter disregards any divergence detected that does not extend outside the RSI upper or lower values.
This does not replace good judgment, but this filter can be helpful in focusing attention towards the extremes of RSI for potential reversal spotting from divergence.
🔶 DETAILS
In order to get the desired results for a display that resembles price action while following RSI, we must scale. The scaling is the most important part of this indicator.
To summarize the process:
Identify a range on Price and RSI
Consider them as equal to create a scaling factor
Use the scaling factor to locate RSI's "Price equivalent" Upper, Lower, & Mid on the Chart
Use those prices (specifically the RSI Mid) to check how far each OHLC value lies from it
Use those differences to translate the price back to the RSI Oscillator, pinning the OHLC values at their relative location to our anchor (RSI Mid)
🔹 RSI Channel
To better understand, and for your convenience, the indicator includes the option to display the RSI Channel on the chart. This channel helps to visualize where the scaled RSI values are relative to price.
If you analyze the RSI channel, you are likely to notice that the price movement throughout the channel matches the same movement witnessed in the RSI Oscillator below. This makes sense since they are the exact same thing displayed on different scales.
🔹 Scaling the Open
While the scaling method used is important, and provides a very close view of the real price bar's relative locations on the RSI oscillator… It is designed for a single purpose.
The scaling does NOT make the price candles display perfectly on the RSI oscillator.
The largest place where this is noticeable is with the opening of each candle.
For this reason, we have included a setting that modifies the opening of each RSI candle to be more accurate to the chart's price candles.
This setting positions the current bar's opening RSI candlestick value accurately relative to the price's open location to the previous closing price. As seen below.
🔶 SETTINGS
🔹 RSI Candles
RSI Length: Sets the Length for the RSI Oscillator.
Overbought/Oversold Levels: Sets the Overbought and Oversold levels for the RSI Oscillator.
Scale Open for Chart Accuracy: As described above, scales the open of each candlestick bar to more accurately portray the chart candlesticks.
🔹 Divergence
Show on Chart: Choose to display divergence line on the chart as well as on the Oscillator.
Divergence Length: Sets the pivot width for divergence detection. Normal Fractal Pivot Detection is used.
Divergence Style: Change color and line style for Regular and Hidden divergences, as well as toggle their display.
Divergence Filter: As described above, toggle on or off divergence filtering.
🔹 RSI Channel
Toggle: Display RSI Channel on Chart.
Color: Change RSI Channel Color

Aurora Flow Oscillator [QuantAlgo]The Aurora Flow Oscillator is an advanced momentum-based technical indicator designed to identify market direction, momentum shifts, and potential reversal zones using adaptive filtering techniques. It visualizes price momentum through a dynamic oscillator that quantifies trend strength and direction, helping traders and investors recognize momentum shifts and trading opportunities across various timeframes and asset class.
🟢 Technical Foundation
The Aurora Flow Oscillator employs a sophisticated mathematical approach with adaptive momentum filtering to analyze market conditions, including:
Price-Based Momentum Calculation: Calculates logarithmic price changes to measure the rate and magnitude of market movement
Adaptive Momentum Filtering: Applies an advanced filtering algorithm to smooth momentum calculations while preserving important signals
Acceleration Analysis: Incorporates momentum acceleration to identify shifts in market direction before they become obvious
Signal Normalization: Automatically scales the oscillator output to a range between -100 and 100 for consistent interpretation across different market conditions
The indicator processes price data through multiple filtering stages, applying mathematical principles including exponential smoothing with adaptive coefficients. This creates an oscillator that dynamically adjusts to market volatility while maintaining responsiveness to genuine trend changes.
🟢 Key Features & Signals
1. Momentum Flow and Extreme Zone Identification
The oscillator presents market momentum through an intuitive visual display that clearly indicates both direction and strength:
Above Zero: Indicates positive momentum and potential bullish conditions
Below Zero: Indicates negative momentum and potential bearish conditions
Slope Direction: The angle and direction of the oscillator provide immediate insight into momentum strength
Zero Line Crossings: Signal potential trend changes and new directional momentum
The indicator also identifies potential overbought and oversold market conditions through extreme zone markings:
Upper Zone (>50): Indicates strong bullish momentum that may be approaching exhaustion
Lower Zone (<-50): Indicates strong bearish momentum that may be approaching exhaustion
Extreme Boundaries (±95): Mark potentially unsustainable momentum levels where reversals become increasingly likely
These zones are displayed with gradient intensity that increases as the oscillator moves toward extremes, helping traders and investors:
→ Identify potential reversal zones
→ Determine appropriate entry and exit points
→ Gauge overall market sentiment strength
2. Customizable Trading Style Presets
The Aurora Flow Oscillator offers pre-configured settings for different trading approaches:
Default (80,150): Balanced configuration suitable for most trading and investing situations.
Scalping (5,80): Highly responsive settings for ultra-short-term trades. Generates frequent signals and catches quick price movements. Best for 1-15min charts when making many trades per day.
Day Trading (8,120): Optimized for intraday movements with faster response than default settings while maintaining reasonable signal quality. Ideal for 5-60min or 4h-12h timeframes.
Swing Trading (10,200): Designed for multi-day positions with stronger noise filtering. Focuses on capturing larger price swings while avoiding minor fluctuations. Works best on 1-4h and daily charts.
Position Trading (14,250): For longer-term position traders/investors seeking significant market trends. Reduces false signals by heavily filtering market noise. Ideal for daily or even weekly charts.
Trend Following (16,300): Maximum smoothing that prioritizes established directional movements over short-term fluctuations. Best used on daily and weekly charts, but can also be used for lower timeframe trading.
Countertrend (7,100): Tuned to detect potential reversals and exhaustion points in trends. More sensitive to momentum shifts than other presets. Effective on 15min-4h charts, as well as daily and weekly charts.
Each preset automatically adjusts internal parameters for optimal performance in the selected trading context, providing flexibility across different market approaches without requiring complex manual configuration.
🟢 Practical Usage Tips
1/ Trend Analysis and Interpretation
→ Direction Assessment: Evaluate the oscillator's position relative to zero to determine underlying momentum bias
→ Momentum Strength: Measure the oscillator's distance from zero within the -100 to +100 range to quantify momentum magnitude
→ Trend Consistency: Monitor the oscillator's path for sustained directional movement without frequent zero-line crossings
→ Reversal Detection: Watch for oscillator divergence from price and deceleration of movement when approaching extreme zones
2/ Signal Generation Strategies
Depending on your trading approach, multiple signal strategies can be employed:
Trend Following Signals:
Enter long positions when the oscillator crosses above zero
Enter short positions when the oscillator crosses below zero
Add to positions on pullbacks while maintaining the overall trend direction
Countertrend Signals:
Look for potential reversals when the oscillator reaches extreme zones (±95)
Enter contrary positions when momentum shows signs of exhaustion
Use oscillator divergence with price as additional confirmation
Momentum Shift Signals:
Enter positions when oscillator changes direction after establishing a trend
Exit positions when oscillator direction reverses against your position
Scale position size based on oscillator strength percentage
3/ Timeframe Optimization
The indicator can be effectively applied across different timeframes with these considerations:
Lower Timeframes (1-15min):
Use Scalping or Day Trading presets
Focus on quick momentum shifts and zero-line crossings
Be cautious of noise in extreme market conditions
Medium Timeframes (30min-4h):
Use Default or Swing Trading presets
Look for established trends and potential reversal zones
Combine with support/resistance analysis for entry/exit precision
Higher Timeframes (Daily+):
Use Position Trading or Trend Following presets
Focus on major trend identification and long-term positioning
Use extreme zones for position management rather than immediate reversals
🟢 Pro Tips
Price Momentum Period:
→ Lower values (5-7) increase sensitivity to minor price fluctuations but capture more market noise
→ Higher values (10-16) emphasize sustained momentum shifts at the cost of delayed response
→ Adjust based on your timeframe (lower for shorter timeframes, higher for longer timeframes)
Oscillator Filter Period:
→ Lower values (80-120) produce more frequent directional changes and earlier response to momentum shifts
→ Higher values (200-300) filter out shorter-term fluctuations to highlight dominant market cycles
→ Match to your typical holding period (shorter holding time = lower filter values)
Multi-Timeframe Analysis:
→ Compare oscillator readings across different timeframes for confluence
→ Look for alignment between higher and lower timeframe signals
→ Use higher timeframe for trend direction, lower for earlier entries
Volatility-Adaptive Trading:
→ Use oscillator strength to adjust position sizing (stronger = larger)
→ Consider reducing exposure when oscillator reaches extreme zones
→ Implement tighter stops during periods of oscillator acceleration
Combination Strategies:
→ Pair with volume indicators for confirmation of momentum shifts
→ Use with support/resistance levels for strategic entry and exit points
→ Combine with volatility indicators for comprehensive market context

Advanced Momentum Scanner [QuantAlgo]The Advanced Momentum Scanner is a sophisticated technical indicator designed to identify market momentum and trend direction using multiple exponential moving averages (EMAs), momentum metrics, and adaptive visualization techniques. It is particularly valuable for those looking to identify trading and investing opportunities based on trend changes and momentum shifts across any market and timeframe.
🟢 Technical Foundation
The Advanced Momentum Scanner utilizes a multi-layered approach with four different EMA periods to identify market momentum and trend direction:
Ultra-Fast EMA for quick trend changes detection (default: 5)
Fast EMA for short-term trend analysis (default: 10)
Mid EMA for intermediate confirmation (default: 30)
Slow EMA for long-term trend identification (default: 100)
For momentum detection, the indicator implements a Rate of Change (RoC) calculation to measure price momentum over a specified period. It further enhances analysis by incorporating RSI readings for overbought/oversold conditions, volatility measurements through ATR, and optional volume confirmation. When these elements align, the indicator generates trading signals based on the selected sensitivity mode (Conservative, Balanced, or Aggressive).
🟢 Key Features & Signals
1. Multi-Period Trend Identification
The indicator combines multiple EMAs of different lengths to provide comprehensive trend analysis within the same timeframe, displaying the information through color-coded visual elements on the chart.
When an uptrend is detected, chart elements are colored with the bullish theme color (default: green/teal).
Similarly, when a downtrend is detected, chart elements are colored with the bearish theme color (default: red).
During neutral or indecisive periods, chart elements are colored with a neutral gray color, providing clear visual distinction between trending and non-trending market conditions.
This visualization provides immediate insights into underlying trend direction without requiring separate indicators, helping traders and investors quickly identify the market's current state.
2. Trend Strength Information Panel
The trend panel operates in three different sensitivity modes (Conservative, Aggressive, and Balanced), each affecting how the indicator processes and displays market information.
The Conservative mode prioritizes trend sustainability over frequency, showing only strong trend movements with high probability.
The Aggressive mode detects early trend changes, providing more frequent signals but potentially more false positives.
The Balanced mode offers a middle ground with moderate signal frequency and reliability.
Regardless of the selected mode, the panel displays:
Current trend direction (UPTREND, DOWNTREND, or NEUTRAL)
Trend strength percentage (0-100%)
Early detection signals when applicable
The active sensitivity mode
This comprehensive approach helps traders and investors:
→ Assess the strength of current market trends
→ Identify early potential trend changes before full confirmation
→ Make more informed trading and investing decisions based on trend context
3. Customizable Visualization Settings
This indicator offers extensive visual customization options to suit different trading styles and preferences:
Display options:
→ Fully customizable uptrend, downtrend, and neutral colors
→ Color-coded price bars showing trend direction
→ Dynamic gradient bands visualizing potential trend channels
→ Optional background coloring based on trend intensity
→ Adjustable transparency levels for all visual elements
These visualization settings can be fine-tuned through the indicator's interface, allowing traders and investors to create a personalized chart environment that emphasizes the most relevant information for their strategy.
The indicator also features a comprehensive alert system with notifications for:
New trend formations (uptrend, downtrend, neutral)
Early trend change signals
Momentum threshold crossovers
Other significant market conditions
Alerts can be customized and delivered through TradingView's notification system, making it easy to stay informed of important market developments even when you are away from the charts.
🟢 Practical Usage Tips
→ Trend Analysis and Interpretation: The indicator visualizes trend direction and strength directly on the chart through color-coding and the information panel, allowing traders and investors to immediately identify the current market context. This information helps in assessing the potential for continuation or reversal.
→ Signal Generation Strategies: The indicator generates potential trading signals based on trend direction, momentum confirmation, and selected sensitivity mode. Users can choose between Conservative (fewer but more reliable signals), Balanced (moderate approach), or Aggressive (more frequent but potentially less reliable signals).
→ Multi-Period Trend Assessment: Through its layered EMA approach, the indicator enables users to understand trend conditions across different lookback periods within the same timeframe. This helps in identifying the dominant trend and potential turning points.
🟢 Pro Tips
Adjust EMA periods based on your timeframe:
→ Lower values for shorter timeframes and more frequent signals
→ Higher values for higher timeframes and more reliable signals
Fine-tune sensitivity mode based on your trading style:
→ "Conservative" for position trading/long-term investing and fewer false signals
→ "Balanced" for swing trading/medium-term investing with moderate signal frequency
→ "Aggressive" for scalping/day trading and catching early trend changes
Look for confluence between components:
→ Strong trend strength percentage and direction in the information panel
→ Overall market context aligning with the expected direction
Use for multiple trading approaches:
→ Trend following during strong momentum periods
→ Counter-trend trading at band extremes during overextension
→ Early trend change detection with sensitivity adjustments
→ Stop loss placement using dynamic bands
Combine with:
→ Volume indicators for additional confirmation
→ Support/resistance analysis for strategic entry/exit points
→ Multiple timeframe analysis for broader market context

Exponential Trend [AlgoAlpha]OVERVIEW
This script plots an adaptive exponential trend system that initiates from a dynamic anchor and accelerates based on time and direction. Unlike standard moving averages or trailing stops, the trend line here doesn't follow price directly—it expands exponentially from a pivot determined by a modified Supertrend logic. The result is a non-linear trend curve that starts at a specific price level and accelerates outward, allowing traders to visually assess trend strength, persistence, and early-stage reversal points through both base and volatility-adjusted extensions.
CONCEPTS
This indicator builds on the idea that trend-following tools often need dynamic, non-static expansion to reflect real market behavior. It uses a simplified Supertrend mechanism to define directional context and anchor levels, then applies an exponential growth function to simulate trend acceleration over time. The exponential growth is unidirectional and resets only when the direction flips, preserving trend memory. This method helps avoid whipsaws and adds time-weighted confirmation to trends. A volatility buffer—derived from ATR and modifiable by a width multiplier—adds a second layer to indicate zones of risk around the main trend path.
FEATURES
Exponential Trend Logic : Once a directional anchor is set, the base trend line accelerates using an exponential formula tied to elapsed bars, making the trend stronger the longer it persists.
Volatility-Adjusted Extension : A secondary band is plotted above or below the base trend line, widened by ATR to visualize volatility zones, act as soft stop regions or as a better entry point (Dynamic Support/Resistance).
Color-Coded Visualization : Clear green/red base and extension lines with shaded fills indicate trend direction and confidence levels.
Signal Markers & Alerts : Triangle markers indicate confirmed trend reversals. Built-in alerts notify users of bullish or bearish direction changes in real-time.
USAGE
Use this script to identify strong trends early, visually measure their momentum over time, and determine safe areas for entries or exits. Start by adjusting the *Exponential Rate* to control how quickly the trend expands—the higher the rate, the more aggressive the curve. The *Initial Distance* sets how far the anchor band is placed from price initially, helping filter out noise. Increase the *Width Multiplier* to widen the volatility zone for more conservative entries or exits. When the price crosses above or below the base line, a new trend is assumed and the exponential projection restarts from the new anchor. The base trend and its extension both shift over time, but only reset on a confirmed reversal. This makes the tool especially useful for momentum continuation setups or trailing stop logic in trending markets.

Statistical Trailing Stop [LuxAlgo]The Statistical Trailing Stop tool offers traders a way to lock in profits in trending markets with four statistical levels based on the log-normal distribution of volatility.
The indicator also features a dashboard with statistics of all detected signals.
🔶 USAGE
The tool works out of the box, traders can adjust the data used with two parameters: data & distribution length.
By default, the tool takes volatility measures of groups of 10 candles, and statistical measures of the last 100 of these groups then traders can adjust the base level to use as trailing, the larger the level, the more resistant the tool will be to moves against the trend.
🔹 Base Levels
Traders can choose up to 4 different levels of trailing, all based on the statistical distribution of volatility.
As we can see in the chart above, each higher level is more resistant to market movements, so level 0 is the most reactive and level 3 the least.
It is up to the trader to determine the best level for each underlying, time frame and market conditions.
🔹 Dashboard
The tool provides a dashboard with the statistics of all trades, making it very easy to assess the performance of the parameters used for any given market.
As we can see on the chart, all Daily BTC signals with default parameters but different base levels, level 2 is the best performing of all four, giving a positive expectation of $2435 per trade, taking into account all long and short trades.
Of note are the long trades with a win rate of 76.47% and a risk-to-reward of 3.34, giving a positive expectation of $4839 per trade, with winners having an average duration of 210 days and losers 32 days.
This, compared to short trades with negative expectation, speaks to the uptrend bias of this particular market.
🔶 SETTINGS
Data Length: Select how many bars to use per data point
Distribution Length: Select how many data points the distribution will have
Base Level: Choose between 4 different trailing levels
🔹 Dashboard
Show Statistics: Enable/disable dashboard
Position: Select dashboard position
Size: Select dashboard size

Parabolic RSI [ChartPrime]The Parabolic RSI indicator applies the Parabolic SAR directly to the Relative Strength Index (RSI) . This combination helps traders identify trend shifts and potential reversal points within the RSI framework. The indicator provides both regular and strong signals based on whether the Parabolic SAR crosses above or below key RSI thresholds.
⯁ KEY FEATURES
Parabolic SAR Applied to RSI – Tracks momentum shifts within the RSI indicator.
Dynamic SAR Dots – Plots SAR levels directly on the RSI for visual clarity.
Threshold-Based Signal Filtering – Uses upper (70) and lower (30) RSI levels to determine strong signals.
Simple and Strong Signal System :
Big Diamonds (Strong Signals) – Appear when Parabolic SAR crosses above 70 or below 30 RSI, indicating potential reversals.
Small Diamonds (Regular Signals) – Appear when Parabolic SAR flips inside the RSI range, signaling weaker trend shifts.
Chart Overlay Signals – Highlights strong RSI-based trend shifts directly on the price chart.
Fully Customizable – Modify RSI length, SAR parameters, colors, and signal displays.
⯁ HOW TO USE
Look for strong signals (big diamonds) when SAR flips above 70 RSI (overbought) or below 30 RSI (oversold) for potential reversals.
Use regular signals (small diamonds) for minor trend shifts within the RSI range.
Combine with price action and other indicators to confirm entry and exit points.
Adjust the SAR acceleration factors to fine-tune sensitivity based on market conditions.
⯁ CONCLUSION
The Parabolic RSI indicator merges trend-following and momentum-based analysis by applying the Parabolic SAR to RSI. This allows traders to detect trend shifts inside the RSI space with an intuitive diamond-based signal system . Whether used alone or as part of a broader trading strategy, this indicator provides a clear and structured approach to identifying momentum reversals and potential trading opportunities.

Gradient Range [BigBeluga]
This indicator highlights range-bound market conditions by dynamically plotting gradient-colored candlesticks within a defined price box. It detects whether the market is ranging or trending using ADX and can identify mean reversion points when price steps outside the established range.
🔵KEY FEATURES:
Range Detection Box:
➣ A transparent box is drawn based on the highest and lowest price close over a user-defined period.
➣ Helps visualize range boundaries and the midline for support/resistance reference.
Gradient Candlestick Coloring:
➣ Candles inside the range are colored with a gradient from top to bottom based on proximity to the midline.
➣ Top range candles are shaded with bearish tones, while bottom range candles use bullish tones.
Ranging/Trending State Detection:
➣ Uses ADX to determine if the market is currently in a ranging or trending state.
➣ A label in the bottom right corner shows a real-time status (🟢 Ranging / 🟡 Trending).
Mean Reversion Signal Circles:
➣ When the market is ranging, white circles are plotted at highs/lows that breach the box boundary, indicating potential mean reversion points.
➣ These levels can act as fade trade setups or exhaustion markers.
🔵USAGE:
Range Trading: Trade between the upper and lower boundaries during range-bound conditions with clearer visual feedback.
Mean Reversion Plays: Use circle signals as early alerts to identify when price extends beyond the range and may revert to the mean.
Visual Trend Strength: Instantly recognize where price is concentrated inside the range via the color gradient system.
Ranging Filter: Use the ADX label to avoid false setups during strong trending periods.
Gradient Range provides an elegant and data-driven approach to range-bound market analysis. With its gradient visualization and smart reversion detection, it empowers traders to better time entries and exits within consolidation zones.

Trend Targets [AlgoAlpha]OVERVIEW
This script combines a smoothed trend-following model with dynamic price rejection logic and ATR-based target projection to give traders a complete visual framework for trading trend continuations. It overlays on price and automatically detects potential trend shifts, confirms rejections near dynamic support/resistance, and displays calculated stop-loss and take-profit levels to support structured risk-reward management. Unlike traditional indicators that only show trend direction or signal entries, this tool brings together a unique mix of signal validation, volatility-aware positioning, and layered profit-taking to guide decision-making with more context.
CONCEPTS
The core trend logic is built on a custom Supertrend that uses an ATR-based band structure with long smoothing chains—first through a WMA, then an EMA—allowing the trend line to respond to major shifts while ignoring noise. A key addition is the use of rejection logic: the script looks for consolidation candles that "hug" the smoothed trend line and counts how many consecutive bars reject from it. This behavior often precedes significant moves. A user-defined threshold filters out weak tests and highlights only meaningful rejections.
FEATURES
Trend Detection : Automatically identifies trend direction using a smoothed Supertrend (WMA + EMA), with shape markers on trend shifts and color-coded bars for clarity.
Rejection Signals : Detects price rejections at the trend line after a user-defined number of consolidation bars; plots ▲/▼ icons to highlight strong continuation setups.
Target Projection : On trend confirmation, plots entry, stop-loss (ATR-based), and three dynamic take-profit levels based on customizable multiples.
Dynamic Updates : All levels (entry, SL, TP1–TP3) auto-adjust based on volatility and are labeled in real time on the chart.
Customization : Users can tweak trend parameters, rejection confirmation count, SL/TP ratios, smoothing lengths, and appearance settings.
Alerts : Built-in alerts for trend changes, rejection events, and when TP1, TP2, or TP3 are reached.
Chart Overlay : Plots directly on price chart with minimal clutter and clearly labeled levels for easy trading.
USAGE
Start by tuning the Supertrend factor and ATR period to fit your asset and timeframe—higher values will catch bigger swings, lower values catch faster moves. The confirmation count should match how tightly you want to filter rejection behavior—higher values make signals rarer but stronger. When the trend shifts, the indicator colors the bars and line accordingly, and if enabled, plots the full entry-TP-SL structure. Rejection markers appear only after enough qualifying bars confirm price pressure at the trend line. This is especially useful for continuation plays where price retests the trend but fails to break it. All calculations are based on volatility (ATR), so targets naturally adjust with market conditions. Add alerts to get notified of important signals even when away from the chart.

Trendline Breakout Navigator [LuxAlgo]The Trendline Breakout Navigator indicator shows three trendlines, representing trends of different significance between Swing Points.
Dots highlight a Higher Low (HL) or Lower High (LH) that pierces through the Trendline without the closing price breaking the Trendline.
A bar color and background color option is included, which offers insights into the price against the trendlines.
🔶 USAGE
Trendlines (TL) are drawn, starting as a horizontal line from a Swing Point.
When an HL (in the case of a bullish TL) or an LH (bearish TL) is found, this Swing Point is connected to the first Swing Point. In both cases, the TL can be optimized when one or more historical close prices breach the TL (see DETAILS).
A solid-styled long-term trendline represents the overall market direction, while a dashed-styled medium-term trendline captures medium-term movements within the long-term trend. Finally, a dotted-styled short-term trendline tracks short-term fluctuations.
🔹 Swing Points vs. Trend
A "Higher High" (HH) or "Lower Low" (LL) will initialize a new trendline, respectively, starting from the previous "Swing Low" or Swing High".
To spot the trend shift, "HH/LL" labels and an optional background color are included. They can be enabled/disabled or set at "Long, Medium, or Short" term TL (Settings—"MS", "HH/LL" and "Background Color").
These features are linked to one Trendline of choice only.
Where the "HH/LL" labels can show a potential trend shift, the background color is:
Green from the moment the close price breaks above a bearish trendline or when an HH occurs
Red from the moment the close price breaks below a bullish trendline or when an LL occurs
🔹 Bar Color
The bar color will depend on the location of the closing price against the three trendlines. When a trendline is unavailable (for example, if the close price breaks the TL and there is no HH/LL), the last known trendline value will be considered.
All three trendlines influence the bar color.
If the close price is above the "Long Term" TL, the bar color will show a gradient of green, darker when the close price is below the "Medium Term" and/or "Short Term" TLs.
On the other hand, when the close price is below the "Long Term" TL, the bar color will show a gradient of red, which becomes darker when the close price is above the "Medium Term" and/or "Short Term" TLs.
To keep the above example simple, only the "Long Term" TL is considered. The white line (not included in the script) resembles the actual value of the TL at each bar, where you can see the effect on the bar color.
Combined with the trendlines and dots, the bar color can provide extra depth and insights into the underlying trends.
🔹 Tested Trendlines
If a new HL/LH pierces the Trendline without the close price breaking the Trendline, the Trendline will be updated.
The exact location where the price exceeded the Trendline is visualized by a dot, colored blue on a bullish trendline and orange when bearish.
These dots can be indicative of a potential trend continuation or reversal.
🔹 Higher TimeFrame Option
The "Period" setting enables users to visualize higher-timeframe trendlines as long as the line length doesn't exceed 5000 bars.
🔶 DETAILS
When a new trendline is drawn, the script first draws a preliminary line and then checks whether a historical close price exceeded this line above (in the case of a bearish TL) or below (in a bullish case).
Subsequently, the most valid point in between is chosen as the starting point of the Trendline.
🔶 SETTINGS
Period: Choose "chart" for trendlines from the current chart timeframe, or choose a higher timeframe
🔹 Swing Length
Toggle and Swing Length for three trendlines: Period used for the swing detection, with higher values returning longer-term Swing Levels.
🔹 Style
Trendline: color for bullish/bearish Trendline
Wick Dot: color for bullish/bearish trendline test
Term: Long-, medium- or short-term
HH/LL: Show HH/LL labels (with or without previous Swing High/Low) of chosen Term
Background Color: Green when the closing price is above the trendline of choice, red otherwise
Bar Color

Uptrick: Z-Score FlowOverview
Uptrick: Z-Score Flow is a technical indicator that integrates trend-sensitive momentum analysi s with mean-reversion logic derived from Z-Score calculations. Its primary objective is to identify market conditions where price has either stretched too far from its mean (overbought or oversold) or sits at a statistically “normal” range, and then cross-reference this observation with trend direction and RSI-based momentum signals. The result is a more contextual approach to trade entry and exit, emphasizing precision, clarity, and adaptability across varying market regimes.
Introduction
Financial instruments frequently transition between trending modes, where price extends strongly in one direction, and ranging modes, where price oscillates around a central value. A simple statistical measure like Z-Score can highlight price extremes by comparing the current price against its historical mean and standard deviation. However, such extremes alone can be misleading if the broader market structure is trending forcefully. Uptrick: Z-Score Flow aims to solve this gap by combining Z-Score with an exponential moving average (EMA) trend filter and a smoothed RSI momentum check, thus filtering out signals that contradict the prevailing market environment.
Purpose
The purpose of this script is to help traders pinpoint both mean-reversion opportunities and trend-based pullbacks in a way that is statistically grounded yet still mindful of overarching price action. By pairing Z-Score thresholds with supportive conditions, the script reduces the likelihood of acting on random price spikes or dips and instead focuses on movements that are significant within both historical and current contextual frameworks.
Originality and Uniquness
Layered Signal Verification: Signals require the fulfillment of multiple layers (Z-Score extreme, EMA trend bias, and RSI momentum posture) rather than merely breaching a statistical threshold.
RSI Zone Lockout: Once RSI enters an overbought/oversold zone and triggers a signal, the script locks out subsequent signals until RSI recovers above or below those zones, limiting back-to-back triggers.
Controlled Cooldown: A dedicated cooldown mechanic ensures that the script waits a specified number of bars before issuing a new signal in the opposite direction.
Gradient-Based Visualization: Distinct gradient fills between price and the Z-Mean line enhance readability, showing at a glance whether price is trading above or below its statistical average.
Comprehensive Metrics Panel: An optional on-chart table summarizes the Z-Score’s key metrics, streamlining the process of verifying current statistical extremes, mean levels, and momentum directions.
Why these indicators were merged
Z-Score measurements excel at identifying when price deviates from its mean, but they do not intrinsically reveal whether the market’s trajectory supports a reversion or if price might continue along its trend. The EMA, commonly used for spotting trend directions, offers valuable insight into whether price is predominantly ascending or descending. However, relying solely on a trend filter overlooks the intensity of price moves. RSI then adds a dedicated measure of momentum, helping confirm if the market’s energy aligns with a potential reversal (for example, price is statistically low but RSI suggests looming upward momentum). By uniting these three lenses—Z-Score for statistical context, EMA for trend direction, and RSI for momentum force—the script offers a more comprehensive and adaptable system, aiming to avoid false positives caused by focusing on just one aspect of price behavior.
Calculations
The core calculation begins with a simple moving average (SMA) of price over zLen bars, referred to as the basis. Next, the script computes the standard deviation of price over the same window. Dividing the difference between the current price and the basis by this standard deviation produces the Z-Score, indicating how many standard deviations the price is from its mean. A positive Z-Score reveals price is above its average; a negative reading indicates the opposite.
To detect overall market direction, the script calculates an exponential moving average (emaTrend) over emaTrendLen bars. If price is above this EMA, the script deems the market bullish; if below, it’s considered bearish. For momentum confirmation, the script computes a standard RSI over rsiLen bars, then applies a smoothing EMA over rsiEmaLen bars. This smoothed RSI (rsiEma) is monitored for both its absolute level (oversold or overbought) and its slope (the difference between the current and previous value). Finally, slopeIndex determines how many bars back the script compares the basis to check whether the Z-Mean line is generally rising, falling, or flat, which then informs the coloring scheme on the chart.
Calculations and Rational
Simple Moving Average for Baseline: An SMA is used for the core mean because it places equal weight on each bar in the lookback period. This helps maintain a straightforward interpretation of overbought or oversold conditions in the context of a uniform historical average.
Standard Deviation for Volatility: Standard deviation measures the variability of the data around the mean. By dividing price’s difference from the mean by this value, the Z-Score can highlight whether price is unusually stretched given typical volatility.
Exponential Moving Average for Trend: Unlike an SMA, an EMA places more emphasis on recent data, reacting quicker to new price developments. This quicker response helps the script promptly identify trend shifts, which can be crucial for filtering out signals that go against a strong directional move.
RSI for Momentum Confirmation: RSI is an oscillator that gauges price movement strength by comparing average gains to average losses over a set period. By further smoothing this RSI with another EMA, short-lived oscillations become less influential, making signals more robust.
SlopeIndex for Slope-Based Coloring: To clarify whether the market’s central tendency is rising or falling, the script compares the basis now to its level slopeIndex bars ago. A higher current reading indicates an upward slope; a lower reading, a downward slope; and similar readings, a flat slope. This is visually represented on the chart, providing an immediate sense of the directionality.
Inputs
zLen (Z-Score Period)
Specifies how many bars to include for computing the SMA and standard deviation that form the basis of the Z-Score calculation. Larger values produce smoother but slower signals; smaller values catch quick changes but may generate noise.
emaTrendLen (EMA Trend Filter)
Sets the length of the EMA used to detect the market’s primary direction. This is pivotal for distinguishing whether signals should be considered (price aligning with an uptrend or downtrend) or filtered out.
rsiLen (RSI Length)
Defines the window for the initial RSI calculation. This RSI, when combined with the subsequent smoothing EMA, forms the foundation for momentum-based signal confirmations.
rsiEmaLen (EMA of RSI Period)
Applies an exponential moving average over the RSI readings for additional smoothing. This step helps mitigate rapid RSI fluctuations that might otherwise produce whipsaw signals.
zBuyLevel (Z-Score Buy Threshold)
Determines how negative the Z-Score must be for the script to consider a potential oversold signal. If the Z-Score dives below this threshold (and other criteria are met), a buy signal is generated.
zSellLevel (Z-Score Sell Threshold)
Determines how positive the Z-Score must be for a potential overbought signal. If the Z-Score surpasses this threshold (and other checks are satisfied), a sell signal is generated.
cooldownBars (Cooldown (Bars))
Enforces a bar-based delay between opposite signals. Once a buy signal has fired, the script must wait the specified number of bars before registering a new sell signal, and vice versa.
slopeIndex (Slope Sensitivity (Bars))
Specifies how many bars back the script compares the current basis for slope coloration. A bigger slopeIndex highlights larger directional trends, while a smaller number emphasizes shorter-term shifts.
showMeanLine (Show Z-Score Mean Line)
Enables or disables the plotting of the Z-Mean and its slope-based coloring. Traders who prefer minimal chart clutter may turn this off while still retaining signals.
Features
Statistical Core (Z-Score Detection):
This feature computes the Z-Score by taking the difference between the current price and the basis (SMA) and dividing by the standard deviation. In effect, it translates price fluctuations into a standardized measure that reveals how significant a move is relative to the typical variation seen over the lookback. When the Z-Score crosses predefined thresholds (zBuyLevel for oversold and zSellLevel for overbought), it signals that price could be at an extreme.
How It Works: On each bar, the script updates the SMA and standard deviation. The Z-Score is then refreshed accordingly. Traders can interpret particularly large negative or positive Z-Score values as scenarios where price is abnormally low or high.
EMA Trend Filter:
An EMA over emaTrendLen bars is used to classify the market as bullish if the price is above it and bearish if the price is below it. This classification is applied to the Z-Score signals, accepting them only when they align with the broader price direction.
How It Works: If the script detects a Z-Score below zBuyLevel, it further checks if price is actually in a downtrend (below EMA) before issuing a buy signal. This might seem counterintuitive, but a “downtrend” environment plus an oversold reading often signals a potential bounce or a mean-reversion play. Conversely, for sell signals, the script checks if the market is in an uptrend first. If it is, an overbought reading aligns with potential profit-taking.
RSI Momentum Confirmation with Oversold/Overbought Lockout:
RSI is calculated over rsiLen, then smoothed by an EMA over rsiEmaLen. If this smoothed RSI dips below a certain threshold (for example, 30) and then begins to slope upward, the indicator treats it as a potential sign of recovering momentum. Similarly, if RSI climbs above a certain threshold (for instance, 70) and starts to slope downward, that suggests dwindling momentum. Additionally, once RSI is in these zones, the indicator locks out repetitive signals until RSI fully exits and re-enters those extreme territories.
How It Works: Each bar, the script measures whether RSI has dropped below the oversold threshold (like 30) and has a positive slope. If it does, the buy side is considered “unlocked.” For sell signals, RSI must exceed an overbought threshold (70) and slope downward. The combination of threshold and slope helps confirm that a reversal is genuinely in progress instead of issuing signals while momentum remains weak or stuck in extremes.
Cooldown Mechanism:
The script features a custom bar-based cooldown that prevents issuing new signals in the opposite direction immediately after one is triggered. This helps avoid whipsaw situations where the market quickly flips from oversold to overbought or vice versa.
How It Works: When a buy signal fires, the indicator notes the bar index. If the Z-Score and RSI conditions later suggest a sell, the script compares the current bar index to the last buy signal’s bar index. If the difference is within cooldownBars, the signal is disallowed. This ensures a predefined “quiet period” before switching signals.
Slope-Based Coloring (Z-Mean Line and Shadow):
The script compares the current basis value to its value slopeIndex bars ago. A higher reading now indicates a generally upward slope, while a lower reading indicates a downward slope. The script then shades the Z-Mean line in a corresponding bullish or bearish color, or remains neutral if little change is detected.
How It Works: This slope calculation is refreshingly straightforward: basis – basis . If the result is positive, the line is colored bullish; if negative, it is colored bearish; if approximately zero, it remains neutral. This provides a quick visual cue of the medium-term directional bias.
Gradient Overlays:
With gradient fills, the script highlights where price stands in relation to the Z-Mean. When price is above the basis, a purple-shaded region is painted, visually indicating a “bearish zone” for potential overbought conditions. When price is below, a teal-like overlay is used, suggesting a “bullish zone” for potential oversold conditions.
How It Works: Each bar, the script checks if price is above or below the basis. It then applies a fill between close and basis, using distinct colors to show whether the market is trading above or below its mean. This creates an immediate sense of how extended the market might be.
Buy and Sell Labels (with Alerts):
When a legitimate buy or sell condition passes every check (Z-Score threshold, EMA trend alignment, RSI gating, and cooldown clearance), the script plots a corresponding label directly on the chart. It also fires an alert (if alerts are set up), making it convenient for traders who want timely notifications.
How It Works: If rawBuy or rawSell conditions are met (refined by RSI, EMA trend, and cooldown constraints), the script calls the respective plot function to paint an arrow label on the chart. Alerts are triggered simultaneously, carrying easily recognizable messages.
Metrics Table:
The optional on-chart table (activated by showMetrics) presents real-time Z-Score data, including the current Z-Score, its rolling mean, the maximum and minimum Z-Score values observed over the last zLen bars, a percentile position, and a short-term directional note (rising, falling, or flat).
Current – The present Z-Score reading
Mean – Average Z-Score over the zLen period
Min/Max – Lowest and highest Z-Score values within zLen
Position – Where the current Z-Score sits between the min and max (as a percentile)
Trend – Whether the Z-Score is increasing, decreasing, or flat
Conclusion
Uptrick: Z-Score Flow offers a versatile solution for traders who need a statistically informed perspective on price extremes combined with practical checks for overall trend and momentum. By leveraging a well-defined combination of Z-Score, EMA trend classification, RSI-based momentum gating, slope-based visualization, and a cooldown mechanic, the script reduces the occurrence of false or premature signals. Its gradient fills and optional metrics table contribute further clarity, ensuring that users can quickly assess market posture and make more confident trading decisions in real time.
Disclaimer
This script is intended solely for informational and educational purposes. Trading in any financial market comes with substantial risk, and there is no guarantee of success or the avoidance of loss. Historical performance does not ensure future results. Always conduct thorough research and consider professional guidance prior to making any investment or trading decisions.

Professional MSTI+ Trading Indicator"Professional MSTI+ Trading Indicator" is a comprehensive technical analysis tool that combines over 20 indicators to generate high-quality trading signals and assess market sentiment. The script integrates standard indicators (MACD, RSI, Bollinger Bands, Stochastic, Simple Moving Averages, and Volume Analysis) with advanced components (Squeeze Momentum, Fisher Transform, True Strength Index, Heikin-Ashi, Laguerre RSI, Hull MA) and further includes metrics such as ADX, Chaikin Money Flow, Williams %R, VWAP, and EMA for in-depth market analysis.
Key Features:
Multiple Presets for Different Trading Styles:
Choose from optimal configurations like Professional, Swing Trading, Day Trading, Scalping, or Reversal Hunter. Note that the presets may not work perfectly on all pairs, and manual calibration might be required. This flexibility allows you to fine-tune the settings to align with your unique strategies and signals.
Multi-Layered Signal Filtering:
Filters based on trend, volume, and volatility help eliminate false signals, enhancing the accuracy of market entries.
Comprehensive Fear & Greed Index:
The indicator aggregates data from RSI, volatility, momentum, trend, and volume to gauge overall market sentiment, providing an additional layer of market context.
Dynamic Information Panel:
Displays detailed status updates for each component (e.g., MACD, RSI, Laguerre RSI, TSI, Fisher Transform, Squeeze, Hull MA, etc.) along with a visual strength bar that represents the intensity of the trading signal.
Signal Generation:
Buy and sell signals are generated when a predefined number of conditions are met and confirmed over multiple bars. These signals are clearly displayed on the chart with arrows, making it easier to spot potential entry and exit points.
Alert Setup:
Built-in alert conditions allow you to receive real-time notifications when trading signals are generated, helping you stay on top of market movements.
"Professional MSTI+ Trading Indicator" is designed to enhance your trading strategy by providing a multi-faceted market analysis and an intuitive visual interface. While the presets offer a robust starting point, they may require manual calibration on certain pairs, giving you the flexibility to configure your own unique strategies and signals.

EMA Clouds with Strict Buy/Sell SignalsEMA Clouds with Strict Buy/Sell Signals - Precision Trading Unleashed
Unlock the power of trend-following precision with the EMA Clouds with Strict Buy/Sell Signals indicator, a sophisticated tool built for traders who demand reliability and clarity in their decision-making. Inspired by the legendary Ripster EMA Clouds, this indicator takes the classic cloud concept to the next level by incorporating stricter, high-confidence signals—perfect for navigating the markets on 15-minute or higher timeframes.
Why You’ll Want This on Your Chart:
Dual EMA Clouds for Crystal-Clear Trends: Watch as two dynamic clouds—formed by carefully paired Exponential Moving Averages (8/21 and 34/50)—paint a vivid picture of market momentum. The green short-term cloud and red long-term cloud provide an intuitive, at-a-glance view of trend direction and strength.
Stricter Signals, Fewer False Moves: Tired of chasing weak signals? This indicator only triggers buy and sell signals when the stars align: a cloud crossover (short-term crossing above or below long-term) and price confirmation above or below both clouds. The result? Fewer trades, higher conviction, and a cleaner chart.
Customizable Timeframe Power: Whether you’re a scalper on the 15-minute chart or a swing trader on the daily, tailor the clouds to your preferred higher timeframe (15min, 30min, 1hr, 4hr, or daily) for seamless integration into your strategy.
Visual Mastery Meets Actionable Alerts: Green buy triangles below the bars and red sell triangles above them make spotting opportunities effortless. Pair this with built-in alerts, and you’ll never miss a high-probability trade again.
How It Works:
Buy Signal: Triggers when the short-term cloud crosses above the long-term cloud and the price surges above both, signaling a robust bullish breakout.
Sell Signal: Activates when the short-term cloud dips below the long-term cloud and the price falls beneath both, confirming bearish dominance.
Cloud Visualization: The green cloud (8/21 EMA) tracks fast-moving trends, while the red cloud (34/50 EMA) anchors the broader market direction—together, they filter noise and spotlight tradable moves.
Why Traders Will Love It:
Designed for those who value precision over guesswork, this indicator cuts through market clutter to deliver signals you can trust. Whether you’re trading stocks, forex, crypto, or futures, its adaptability and strict logic make it a must-have tool for serious traders. Customize the EMA lengths, tweak the timeframe, and watch your edge sharpen.
Add EMA Clouds with Strict Buy/Sell Signals to your chart today and experience the confidence of trading with a tool that’s as disciplined as you are. Your next big move is waiting—don’t let it slip away.

Scalping Entry/Exit Indicator by DiGetImagine having a tool that not only spots high-probability entry signals but also visually marks them on your chart with color-coded cues and automated alerts. The Scalping Entry/Exit Indicator by DiGet does exactly that—by fusing a range of classic candlestick patterns (such as Bullish Hammers, Engulfing patterns, and Morning/Evening Stars) with dynamic risk management levels, this script empowers you to make swift and informed trading decisions. Whether you're an active trader or an algorithm enthusiast, this indicator offers both precision and clarity in identifying scalp opportunities, making your chart analysis more efficient and visually engaging.
Indicator Breakdown
Input Parameters:
The indicator accepts a customizable risk-reward ratio, an ATR period for volatility measurement, and a lookback period to scan for valid candlestick patterns.
ATR & Candle Calculations:
It computes the Average True Range (ATR) to dynamically set stop-loss and take-profit levels. Additionally, it determines the body and wick sizes of each candlestick to help identify key reversal patterns.
Pattern Detection:
Multiple bullish patterns (Hammer, Engulfing, Morning Star) and bearish patterns (Shooting Star, Engulfing, Evening Star) are detected. There’s also a simplified version of the Head & Shoulders pattern, offering further validation for reversal signals.
Signal Generation & Trade Levels:
The script consolidates the pattern signals into combined “buy” and “sell” triggers. It then calculates the respective stop-loss (SL) and take-profit (TP) levels based on the current price and ATR, providing a robust risk management framework.
Visual Aids & Alerts:
To enhance usability, the indicator changes the chart’s background color to green for buy signals and red for sell signals. It also draws labels, lines (representing SL and TP), and markers directly on the chart, along with alert conditions to notify traders of actionable signals.
This indicator is an excellent addition to your TradingView toolkit—ideal for scalpers and short-term traders seeking clarity, precision, and automated signal generation on their charts.
Enjoy trading with confidence and precision!

Uptrick: Acceleration ShiftsIntroduction
Uptrick: Acceleration Shifts is designed to measure and visualize price momentum shifts by focusing on acceleration —the rate of change in velocity over time. It uses various moving average techniques as a trend filter, providing traders with a clearer perspective on market direction and potential trade entries or exits.
Purpose
The main goal of this indicator is to spot strong momentum changes (accelerations) and confirm them with a chosen trend filter. It attempts to distinguish genuine market moves from noise, helping traders make more informed decisions. The script can also trigger multiple entries (smart pyramiding) within the same trend, if desired.
Overview
By measuring how quickly price velocity changes (acceleration) and comparing it against a smoothed average of itself, this script generates buy or sell signals once the acceleration surpasses a given threshold. A trend filter is added for further validation. Users can choose from multiple smoothing methods and color schemes, and they can optionally enable a small table that displays real-time acceleration values.
Originality and Uniqueness
This script offers an acceleration-based approach, backed by several different moving average choices. The blend of acceleration thresholds, a trend filter, and an optional extra-entry (pyramiding) feature provides a flexible toolkit for various trading styles. The inclusion of multiple color themes and a slope-based coloring of the trend line adds clarity and user customization.
Inputs & Features
1. Acceleration Length (length)
This input determines the number of bars used when calculating velocity. Specifically, the script computes velocity by taking the difference in closing prices over length bars, and then calculates acceleration based on how that velocity changes over an additional length. The default is 14.
2. Trend Filter Length (smoothing)
This sets the lookback period for the chosen trend filter method. The default of 50 results in a moderately smooth trend line. A higher smoothing value will create a slower-moving trend filter.
3. Acceleration Threshold (threshold)
This multiplier determines when acceleration is considered strong enough to trigger a main buy or sell signal. A default value of 2.5 means the current acceleration must exceed 2.5 times the average acceleration before signaling.
4. Smart Pyramiding Strength (pyramidingThreshold)
This lower threshold is used for additional (pyramiding) entries once the main trend has already been identified. For instance, if set to 0.5, the script looks for acceleration crossing ±0.5 times its average acceleration to add extra positions.
5. Max Pyramiding Entries (maxPyramidingEntries)
This sets a limit on how many extra positions can be opened (beyond the first main signal) in a single directional trend. The default of 3 ensures traders do not become overexposed.
6. Show Acceleration Table (showTable)
When enabled, a small table displaying the current acceleration and its average is added to the top-right corner of the chart. This table helps monitor real-time momentum changes.
7. Smart Pyramiding (enablePyramiding)
This toggle decides whether additional entries (buy or sell) will be generated once a main signal is active. If enabled, these extra signals act as filtered entries, only firing when acceleration re-crosses a smaller threshold (pyramidingThreshold). These signals have a '+' next to their signal on the label.
8. Select Color Scheme (selectedColorScheme)
Allows choosing between various pre-coded color themes, such as Default, Emerald, Sapphire, Golden Blaze, Mystic, Monochrome, Pastel, Vibrant, Earth, or Neon. Each theme applies a distinct pair of colors for bullish and bearish conditions.
9. Trend Filter (TrendFilter)
Lets the user pick one of several moving average approaches to determine the prevailing trend. The options include:
Short Term (TEMA)
EWMA
Medium Term (HMA)
Classic (SMA)
Quick Reaction (DEMA)
Each method behaves differently, balancing reactivity and smoothness.
10. Slope Lookback (slopeOffset)
Used to measure the slope of the trend filter over a set number of bars (default is 10). This slope then influences the coloring of the trend filter line, indicating bullish or bearish tilt.
Note: The script refers to this as the "Massive Slope Index," but it effectively serves as a Trend Slope Calculation, measuring how the chosen trend filter changes over a specified period.
11. Alerts for Buy/Sell and Pyramiding Signals
The script includes built-in alert conditions that can be enabled or configured. These alerts trigger whenever the script detects a main Buy or Sell signal, as well as extra (pyramiding) signals if Smart Pyramiding is active. This feature allows traders to receive immediate notifications or automate a trading response.
Calculation Methodology
1. Velocity and Acceleration
Velocity is derived by subtracting the closing price from its value length bars ago. Acceleration is the difference in velocity over an additional length period. This highlights how quickly momentum is shifting.
2. Average Acceleration
The script smooths raw acceleration with a simple moving average (SMA) using the smoothing input. Comparing current acceleration against this average provides a threshold-based signal mechanism.
3. Trend Filter
Users can pick one of five moving average types to form a trend baseline. These range from quick-reacting methods (DEMA, TEMA) to smoother options (SMA, HMA, EWMA). The script checks whether the price is above or below this filter to confirm trend direction.
4. Buy/Sell Logic
A buy occurs when acceleration surpasses avgAcceleration * threshold and price closes above the trend filter. A sell occurs under the opposite conditions. An additional overbought/oversold check (based on a longer SMA) refines these signals further.
When price is considered oversold (i.e., close is below a longer-term SMA), a bullish acceleration signal has a higher likelihood of success because it indicates that the market is attempting to reverse from a lower price region. Conversely, when price is considered overbought (close is above this longer-term SMA), a bearish acceleration signal is more likely to be valid. This helps reduce false signals by waiting until the market is extended enough that a reversal or continuation has a stronger chance of following through.
5. Smart Pyramiding
Once a main buy or sell signal is triggered, additional (filtered) entries can be taken if acceleration crosses a smaller multiplier (pyramidingThreshold). This helps traders scale into strong moves. The script enforces a cap (maxPyramidingEntries) to limit risk.
6. Visual Elements
Candles can be recolored based on the active signal. Labels appear on the chart whenever a main or pyramiding entry signal is triggered. An optional table can show real-time acceleration values.
Color Schemes
The script includes a variety of predefined color themes. For bullish conditions, it might use turquoise or green, and for bearish conditions, magenta or red—depending on which color scheme the user selects. Each scheme aims to provide clear visual differentiation between bullish and bearish market states.
Why Each Indicator Was Part of This Component
Acceleration is employed to detect swift changes in momentum, capturing shifts that may not yet appear in more traditional measures. To further adapt to different trading styles and market conditions, several moving average methods are incorporated:
• TEMA (Triple Exponential Moving Average) is chosen for its ability to reduce lag more effectively than a standard EMA while still reacting swiftly to price changes. Its construction layers exponential smoothing in a way that can highlight sudden momentum shifts without sacrificing too much smoothness.
• DEMA (Double Exponential Moving Average) provides a faster response than a single EMA by using two layers of exponential smoothing. It is slightly less smoothed than TEMA but can alert traders to momentum changes earlier, though with a higher risk of noise in choppier markets.
• HMA (Hull Moving Average) is known for its balance of smoothness and reduced lag. Its weighted calculations help track trend direction clearly, making it useful for traders who want a smoother line that still reacts fairly quickly.
• SMA (Simple Moving Average) is the classic baseline for smoothing price data. It offers a clear, stable perspective on long-term trends, though it reacts more slowly than other methods. Its simplicity can be beneficial in lower-volatility or more stable market environments.
• EWMA (Exponentially Weighted Moving Average) provides a middle ground by emphasizing recent price data while still retaining some degree of smoothing. It typically responds faster than an SMA but is less aggressive than DEMA or TEMA.
Alongside these moving average techniques, the script employs a slope calculation (referred to as the “Massive Slope Index”) to visually indicate whether the chosen filter is sloping upward or downward. This adds an extra layer of clarity to directional analysis. The indicator also uses overbought/oversold checks, based on a longer-term SMA, to help filter out signals in overstretched markets—reducing the likelihood of false entries in conditions where the price is already extensively extended.
Additional Features
Alerts can be set up for both main signals and additional pyramiding signals, which is helpful for automated or semi-automated trading. The optional acceleration table offers quick reference values, making momentum monitoring more intuitive. Including explicit alert conditions for Buy/Sell and Pyramiding ensures traders can respond promptly to market movements or integrate these triggers into automated strategies.
Summary
This script serves as a comprehensive momentum-based trading framework, leveraging acceleration metrics and multiple moving average filters to identify potential shifts in market direction. By combining overbought/oversold checks with threshold-based triggers, it aims to reduce the noise that commonly plagues purely reactive indicators. The flexibility of Smart Pyramiding, customizable color schemes, and built-in alerts allows users to tailor their experience and respond swiftly to valid signals, potentially enhancing trading decisions across various market conditions.
Disclaimer
All trading involves significant risk, and users should apply their own judgment, risk management, and broader analysis before making investment decisions.

Triangular Hull Moving Average + Volatility [BigBeluga]This indicator combines the Triangular Hull Moving Average (THMA) with a volatility overlay to provide a smoother trend-following tool while dynamically visualizing market volatility.
🔵 Key Features:
THMA-Based Trend Detection: The indicator applies a Triangular Hull Moving Average (THMA) to smooth price data, reducing lag while maintaining responsiveness to trend changes.
// THMA
thma(_src, _length) =>
ta.wma(ta.wma(_src,_length / 3) * 3 - ta.wma(_src, _length / 2) - ta.wma(_src, _length), _length)
Dynamic Volatility Bands: When enabled, the indicator displays wicks extending from the THMA-based candles. These bands expand and contract based on price volatility.
Trend Reversal Signals The indicator marks trend shifts using triangle-shaped signals:
- Upward triangles appear when the THMA trend shifts to bullish.
- Downward triangles appear when the THMA trend shifts to bearish.
Customizable Settings: Users can adjust the THMA length, volatility calculation period, and colors for up/down trends to fit their trading style.
Informative Dashboard: The bottom-right corner displays the current trend direction and volatility percentage, helping traders quickly assess market conditions.
🔵 Usage:
Trend Trading: The colored candles indicate whether the market is trending up or down. Traders can follow the trend direction and use trend reversals for entry or exit points.
Volatility Monitoring: When the volatility feature is enabled, the expanding or contracting wicks help visualize market momentum and potential breakout strength.
Signal Confirmation: The triangle signals can be used to confirm potential entry points when the trend shifts.
This tool is ideal for traders who want a responsive moving average with volatility insights to enhance their trend-following strategies.
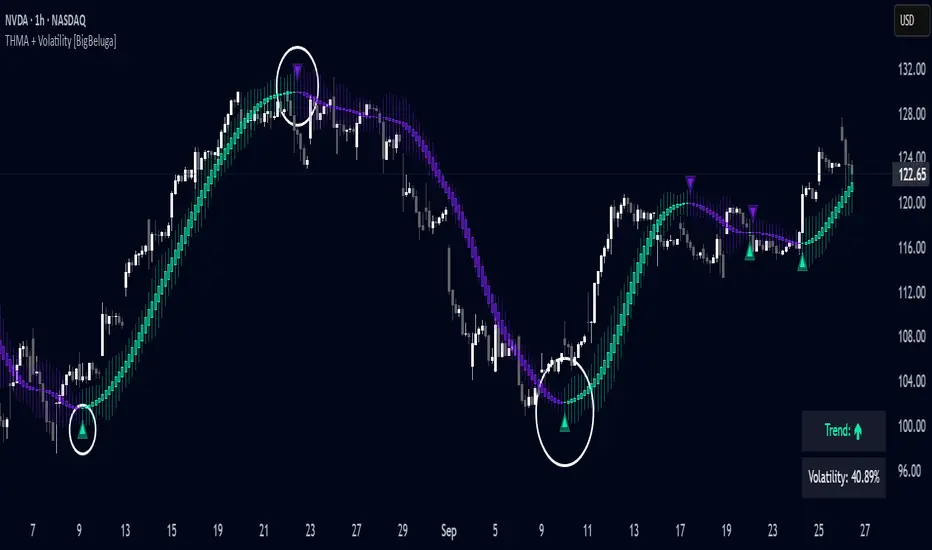
Ivan Gomes StrategyIG Signals+ - Ivan Gomes Strategy
This script is designed for scalping and binary options trading, generating buy and sell signals at the beginning of each candle. Although it is mainly optimized for short-term operations, it can also be used for medium and long-term strategies with appropriate adjustments.
How It Works
• The indicator provides buy or sell signals at the start of the candle, based on a statistical probability of candle patterns, depending on the timeframe.
• It is essential to enter the trade immediately after the signal appears and exit at the end of the same candle.
• If the first operation results in a loss (Loss), the script will send another trade signal at the start of the next candle. However, if the first trade results in a win (Gain), no new signal will be generated.
• The signals follow cycles of 3 candles, regardless of the timeframe. However, if a Doji candle appears, the cycle is interrupted, and no signals will be generated until the next valid cycle starts.
• The strategy consists of up to two trades per cycle: if the first trade is not successful, the second trade serves as an additional attempt to recover.
Key Points to Consider
1. Avoid trading in sideways markets – If price levels do not fluctuate significantly, the accuracy of the signals may decrease.
2. Trade in the direction of the trend – Using Ichimoku clouds or other trend indicators can help confirm trend direction and improve signal reliability. If the market is in an uptrend (bullish trend) and the indicator generates a sell signal, the most prudent decision would be to wait for a buy signal that aligns with the main trend. The same applies to downtrends, where buy signals may be riskier.
These decisions should be based on chart reading and supported by other technical analysis tools, such as support and resistance levels, which indicate zones where price might face obstacles or reverse direction. Additionally, Fibonacci retracement levels can help identify possible pullback points within a trend. Moving averages are also useful for visualizing the general market direction and confirming whether an indicator signal aligns with the overall price structure. Combining these tools can increase trade accuracy and prevent unnecessary trades against the main trend, reducing risks.
3. Works based on probability statistics – The algorithm analyzes candle formations and their statistical probabilities depending on the timeframe to optimize trade entries.
4. Best suited for scalping and binary options – This strategy performs best in 1-minute and 5-minute timeframes, allowing for multiple trades throughout the day.
Technical Details
• The script detects the candle cycle and assigns an index to each candle to identify patterns and possible reversals.
• It recognizes reference candles, stores their colors, and compares them with subsequent candles to determine if a signal should be triggered.
• Doji candle rules are implemented to avoid false signals in indecisive market conditions. When a Doji appears, the script does not generate signals for that cycle.
• The indicator displays visual alerts and notifications, ensuring fast execution of trades.
Disclaimer
The IG Signals+ indicator was created to assist traders who struggle to analyze the market by providing objective trade signals. However, no strategy is foolproof, and this script does not guarantee profits.
Trading involves significant financial risk, and users should test it in a demo account before trading with real money. Proper risk management is crucial for long-term success.

Breakout and Retest Signals [AlgoAlpha]OVERVIEW
This script detects breakout and retest signals by identifying key pivot points in price action and analyzing their relationship with historical swing highs and lows. It highlights breakout structures using ATR-based tolerance levels and volume analysis to confirm potential trend continuations or reversals. The script marks significant price levels with dynamic boxes and dashed lines to help traders visualize breakout and retest areas effectively.
CONCEPTS
The script relies on pivot point analysis, a technique used to identify significant price levels where the market has previously reversed. It dynamically tracks a set number of recent swing highs and lows, allowing traders to see if the price is revisiting a previously significant level. The concept of breakouts and retests is widely used in technical analysis to determine potential entry points. A breakout occurs when the price moves beyond a resistance or support level, and a retest happens when the price returns to test that level before continuing in the breakout direction. This script enhances that analysis by incorporating ATR-based tolerance levels, ensuring that price zones are not too large.
FEATURES
Breakout and Retest Markings : Highlights breakout and retest areas with shaded boxes, allowing traders to visualize where price action is confirming key levels.
Volume Delta and Ratio : Analyzes volume at breakout levels to gauge the strength of the move, displaying volume delta information for additional context. The script also displays the ratio of selling to buying at the retest along traders to make better judgement on their entries.
Multi-Timeframe Adaptability : Dynamically adjusts volume analysis to align with the appropriate lower timeframe, ensuring reliable volume comparisons.
Alerts for Breakout and Retest Events : Traders can receive real-time notifications when bullish or bearish breakout retests are detected.
USAGE
This script is best suited for traders looking to identify strong breakout and retest setups across different timeframes. Users can customize the pivot detection period and swing point memory to adjust sensitivity based on their trading style. The ATR length and multiplier allow further refinement of breakout tolerance, reducing noise in volatile markets. The breakout zones are displayed as shaded boxes, where traders can assess whether a price retest is occurring under favorable conditions. Alerts can be set to notify traders of potential trade opportunities.

[COG]TMS Crossfire 🔍 TMS Crossfire: Guide to Parameters
📊 Core Parameters
🔸 Stochastic Settings (K, D, Period)
- **What it does**: These control how the first stochastic oscillator works. Think of it as measuring momentum speed.
- **K**: Determines how smooth the main stochastic line is. Lower values (1-3) react quickly, higher values (3-9) are smoother.
- **D**: Controls the smoothness of the signal line. Usually kept equal to or slightly higher than K.
- **Period**: How many candles are used to calculate the stochastic. Standard is 14 days, lower for faster signals.
- **For beginners**: Start with the defaults (K:3, D:3, Period:14) until you understand how they work.
🔸 Second Stochastic (K2, D2, Period2)
- **What it does**: Creates a second, independent stochastic for stronger confirmation.
- **How to use**: Can be set identical to the first one, or with slightly different values for dual confirmation.
- **For beginners**: Start with the same values as the first stochastic, then experiment.
🔸 RSI Length
- **What it does**: Controls the period for the RSI calculation, which measures buying/selling pressure.
- **Lower values** (7-9): More sensitive, good for short-term trading
- **Higher values** (14-21): More stable, better for swing trading
- **For beginners**: The default of 11 is a good balance between speed and reliability.
🔸 Cross Level
- **What it does**: The centerline where crosses generate signals (default is 50).
- **Traditional levels**: Stochastics typically use 20/80, but 50 works well for this combined indicator.
- **For beginners**: Keep at 50 to focus on trend following strategies.
🔸 Source
- **What it does**: Determines which price data is used for calculations.
- **Common options**:
- Close: Most common and reliable
- Open: Less common
- High/Low: Used for specialized indicators
- **For beginners**: Stick with "close" as it's most commonly used and reliable.
🎨 Visual Theme Settings
🔸 Bullish/Bearish Main
- **What it does**: Sets the overall color scheme for bullish (up) and bearish (down) movements.
- **For beginners**: Green for bullish and red for bearish is intuitive, but choose any colors that are easy for you to distinguish.
🔸 Bullish/Bearish Entry
- **What it does**: Colors for the entry signals shown directly on the chart.
- **For beginners**: Use bright, attention-grabbing colors that stand out from your chart background.
🌈 Line Colors
🔸 K1, K2, RSI (Bullish/Bearish)
- **What it does**: Controls the colors of each indicator line based on market direction.
- **For beginners**: Use different colors for each line so you can quickly identify which line is which.
⏱️ HTF (Higher Timeframe) Settings
🔸 HTF Timeframe
- **What it does**: Sets which higher timeframe to use for filtering (e.g., 240 = 4 hour chart).
- **How to choose**: Should be at least 4x your current chart timeframe (e.g., if trading on 15min, use 60min or higher).
- **For beginners**: Start with a timeframe 4x higher than your trading chart.
🔸 Use HTF Filter
- **What it does**: Toggles whether the higher timeframe filter is applied or not.
- **For beginners**: Keep enabled to reduce false signals, especially when learning.
🔸 HTF Confirmation Bars
- **What it does**: How many bars must confirm a trend change on higher timeframe.
- **Higher values**: More reliable but slower to react
- **Lower values**: Faster signals but more false positives
- **For beginners**: Start with 2-3 bars for a good balance.
📈 EMA Settings
🔸 Use EMA Filter
- **What it does**: Toggles price filtering with an Exponential Moving Average.
- **For beginners**: Keep enabled for better trend confirmation.
🔸 EMA Period
- **What it does**: Length of the EMA for filtering (shorter = faster reactions).
- **Common values**:
- 5-13: Short-term trends
- 21-50: Medium-term trends
- 100-200: Long-term trends
- **For beginners**: 5-10 is good for short-term trading, 21 for swing trading.
🔸 EMA Offset
- **What it does**: Shifts the EMA forward or backward on the chart.
- **For beginners**: Start with 0 and adjust only if needed for visual clarity.
🔸 Show EMA on Chart
- **What it does**: Toggles whether the EMA appears on your main price chart.
- **For beginners**: Keep enabled to see how price relates to the EMA.
🔸 EMA Color, Style, Width, Transparency
- **What it does**: Customizes how the EMA line looks on your chart.
- **For beginners**: Choose settings that make the EMA visible but not distracting.
🌊 Trend Filter Settings
🔸 Use EMA Trend Filter
- **What it does**: Enables a multi-EMA system that defines the overall market trend.
- **For beginners**: Keep enabled for stronger trend confirmation.
🔸 Show Trend EMAs
- **What it does**: Toggles visibility of the trend EMAs on your chart.
- **For beginners**: Enable to see how price moves relative to multiple EMAs.
🔸 EMA Line Thickness
- **What it does**: Controls how the thickness of EMA lines is determined.
- **Options**:
- Uniform: All EMAs have the same thickness
- Variable: Each EMA has its own custom thickness
- Hierarchical: Automatically sized based on period (longer periods = thicker)
- **For beginners**: "Hierarchical" is most intuitive as longer-term EMAs appear more dominant.
🔸 EMA Line Style
- **What it does**: Sets the line style (solid, dotted, dashed) for all EMAs.
- **For beginners**: "Solid" is usually clearest unless you have many lines overlapping.
🎭 Trend Filter Colors/Width
🔸 EMA Colors (8, 21, 34, 55)
- **What it does**: Sets the color for each individual trend EMA.
- **For beginners**: Use a logical progression (e.g., shorter EMAs brighter, longer EMAs darker).
🔸 EMA Width Settings
- **What it does**: Controls the thickness of each EMA line.
- **For beginners**: Thicker lines for longer EMAs make them easier to distinguish.
🔔 How These Parameters Work Together
The power of this indicator comes from how these components interact:
1. **Base Oscillator**: The stochastic and RSI components create the main oscillator
2. **HTF Filter**: The higher timeframe filter prevents trading against larger trends
3. **EMA Filter**: The EMA filter confirms signals with price action
4. **Trend System**: The multi-EMA system identifies the overall market environment
Think of it as multiple layers of confirmation, each adding more reliability to your trading signals.
💡 Tips for Beginners
1. **Start with defaults**: Use the default settings first and understand what each element does
2. **One change at a time**: When customizing, change only one parameter at a time
3. **Keep notes**: Write down how each change affects your results
4. **Backtest thoroughly**: Test any changes on historical data before trading real money
5. **Less is more**: Sometimes simpler settings work better than complicated ones
Remember, no indicator is perfect - always combine this with proper risk management and other forms of analysis!

Volume Flow Indicator Signals | iSolani
Volume Flow Indicator Signals | iSolani: Decoding Trend Momentum with Volume Precision
In markets where trends are fueled by institutional participation, discerning genuine momentum from false moves is critical. The Volume Flow Indicator Signals | iSolani cuts through this noise by synthesizing price action with volume dynamics, generating high-confidence signals when capital flows align with directional bias. This tool reimagines traditional volume analysis by incorporating volatility-adjusted thresholds and dual-layer smoothing, offering traders a laser-focused approach to trend identification.
Core Methodology
The indicator employs a multi-stage calculation to quantify volume-driven momentum:
Volatility-Adjusted Filter: Measures price changes via log returns, scaling significance using a 30-bar standard deviation multiplied by user-defined sensitivity (default: 2x).
Volume Normalization: Caps extreme volume spikes at 3x the 50-bar moving average, preventing distortion from anomalous trades.
Directional Volume Flow: Assigns positive/negative values to volume based on whether price movement exceeds volatility-derived thresholds.
Dual Smoothing: Applies consecutive SMA (3-bar) and EMA (14-bar) to create the Volume Flow Indicator (VFI) and its signal line, filtering out transient fluctuations.
Breaking New Ground
This implementation introduces three key innovations:
Adaptive Noise Gates: Unlike static volume oscillators, the sensitivity coefficient dynamically adjusts to market volatility, reducing false signals during choppy conditions.
Institutional Volume Capping: The vcoef parameter limits the influence of outlier volume spikes, focusing on sustained institutional activity rather than one-off trades.
Non-Repainting Signals: Generates single-per-trend labels (buy below bars, sell above) to avoid chart clutter while maintaining visual clarity.
Engine Under the Hood
The script executes through five systematic stages:
Data Preparation: Computes HLC3 typical price and its logarithmic rate of change.
Threshold Calculation: Derives dynamic cutoff levels using 30-period volatility scaled by user sensitivity.
Volume Processing: Filters raw volume through a 50-bar SMA, capping extremes at 3x average.
VFI Construction: Sums directional volume flow over 50 bars, smoothed with a 3-bar SMA.
Signal Generation: Triggers alerts when VFI crosses zero, confirmed by a 14-bar EMA crossover.
Standard Configuration
Optimized defaults balance responsiveness and reliability:
Volume MA: 50-bar smoothing window
Sensitivity: 2.0 (doubles volatility threshold)
Signal Smoothing: 14-bar EMA
Volume Cap: 3x average (hidden parameter)
VFI Smoothing: Enabled (3-bar SMA)
By fusing adaptive volume filtering with price confirmation logic, the Volume Flow Indicator Signals | iSolani transforms raw market data into institutional-grade trend signals. Its ability to mute choppy price action while amplifying high-conviction volume moves makes it particularly effective for spotting early trend reversals in equities, forex, and futures markets.
